



Anti-Mouse CSF1R/CD115 Antibody (AFS98)

Based on 1 Customer Validation
Anti-Mouse (CSF1R/CD115) Antibody (AFS98) is an anti-mouse CSF1R IgG2a antibody inhibitor derived from rats. Anti-Mouse (CSF1R/CD115) Antibody (AFS98) inhibits M-CSF-dependent colony formation and cell growth by blocking the binding of M-CSF to its receptor. Anti-Mouse (CSF1R/CD115) Antibody (AFS98) can be used for the researches of inflammation, metabolic disease, cardiovascular disease and neurological disease, such as such as stroke, diabetes and arthritis.
For research use only. We do not sell to patients.
- Purity : 99%
- Molecular Weight:150 kDa
-
Storage:
Please store the product under the recommended conditions in the Certificate of Analysis.

To place orders, for customer services and technical support, please contact: MedChemExpress USA
Tel: 609-228-6898 E-mail: [email protected] [email protected]


-
 Biological Activity
-
Chemical Information
- Protocols
- Purity & Documentation
- References
-
 Help & FAQs




Biological Activity
Description
Isotype
Rat IgG2a kappa
Recommend Isotype Controls
Species Reactivity
Mouse
IC50 & Target
CSF1R/CD115
In Vitro
The antibody framework is stable, specific and adaptable, and has the ability to bind both antigens and endogenous immune receptors. Monoclonal antibodies have several derivatives, including bispecific antibodies, antibody-drug conjugates, and antibody fragments, and have significant effects in fields such as immunology and oncology. When designing inhibitory antibodies, considerations include identification of antigen-specific variable regions, choice of expression system, use of multispecific formats, and antibody derivatives based on fragmentation, oligomerization, or conjugation with other functional moieties[1].
MedChemExpress (MCE) has not independently confirmed the accuracy of these methods. They are for reference only. Further protocols information, click here.
In Vivo
Anti-Mouse (CSF1R/CD115) Antibody (AFS98) (25 mg/kg, i.p., every second day for 6 weeks) suppresses the progression of established diabetic nephropathy[2].
in Obese (db/db) mice by targeting macrophage-mediated injury[2].
Anti-Mouse (CSF1R/CD115) Antibody (AFS98) (2 mg/mouse, i.p., every second day for 6 weeks) acts as protection from early atherogenesis in apoE-deficient mice[3].
Anti-Mouse (CSF1R/CD115) Antibody (AFS98) (25 or 50 mg/kg, i.p., every day for 14 days) shows significant antiinflammatory effects in Collagen-induced arthritis (CIA) mice models[4].
MedChemExpress (MCE) has not independently confirmed the accuracy of these methods. They are for reference only.
-
Animal Model:Obese (db/db) mice models (C57BL/KS, 12 weeks)[2]
-
Dosage:25 mg/kg
-
Administration:Intraperitoneal injections, every second day for 6 weeks
-
Result:Reduced renal hypertrophy, but not obesity, diabetes or circulating monocytes.
Reduced macrophage accumulation in diabetic kidneys.
Suppressed diabetic glomerular hyperfiltration without altering albuminuria.
Reduced ubular damage and tubulo-interstitial fibrosis.
Upregulated the levels of phospho-ERK, phospho-p38, phospho-JNK, phospho-ATF2 and α-tubulin.
-
Animal Model:ApoE-deficient mice fed a high-fat diet from 6 to 12 weeks of age[3]
-
Dosage:2 mg/mouse
-
Administration:Intraperitoneal injections, every second day for 6 weeks
-
Result:Prevented development of fatty streaks.
Suppressed the accumulation of macrophage-derived foam cells in the aortic root by 70%.
-
Animal Model:Collagen-induced arthritis (CIA) mice models (DBA/1, male, 7-9 weeks)[4]
-
Dosage:25 or 50 mg/kg
-
Administration:Intraperitoneal injections, every day for 14 days
-
Result:Inhibitd inflammatory bone and cartilage loss.
Reduced synovial joint macrophage infiltrates and splenic monocyte recruitment.
Blocked systemic bone loss by blockade of osteoclast differentiation.
Protected against bone and cartilage erosion independent of effects on inflammation in serum-transfer arthritis.
Gene ID
Accession
Conjugated
Unconjugated
Reconsititution
The product can be reconstituted/diluted with sterile PBS or saline.
Application
in vivo macrophage depletion; in vitro CSF1R neutralization; in vivo monocyte depletion; Flow cyt
Verified Bioactivity
-
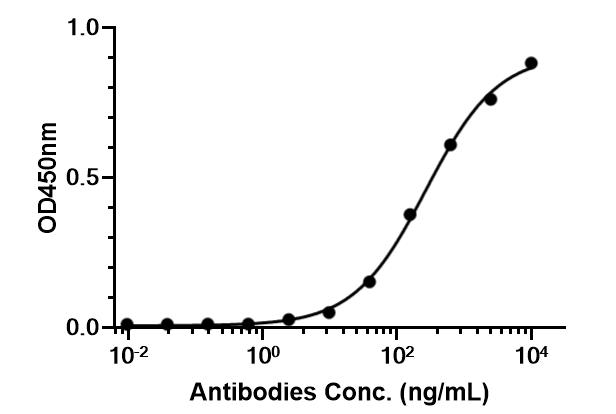 Immobilized CSF1R Protein, Mouse (HEK293, His, HY-P72952) can bind Anti-Mouse CSF1R/CD115 Antibody (AFS98). The EC50 for this effect is 262.9 ng/mL.


Chemical Information
-
Appearance Liquid
-
Molecular Weight 150 kDa
-
Color Colorless to light yellow
-
SMILES
[Anti-Mouse CSF1R/CD115 Antibody (AFS98)]
-
Formulation
Please refer to the lot-specific COA for specific buffer information.
-
Storage
Please store the product under the recommended conditions in the Certificate of Analysis.

Protocols
-
Somatic Cell Culture
A method of simulating the in vivo environment in vitro to maintain the cell growth, differentation and main functions.
-
CCK-8/WST-8 Cell Proliferation Assay
The CCK-8/WST-8 assay is based on the reduction of the water-soluble tetrazolium salt WST-8 to a water-soluble formazan product by cellular dehydrogenases in metabolically active cells, where the generated formazan amount is proportional to the number of living cells and is quantified by measuring absorbance in the visible range, providing a colorimetric readout for cell viability and proliferation assessment. This class of tetrazolium-based assays improves upon earlier MTT-based systems by producing a water-soluble formazan, eliminating the need for organic solubilization steps and enabling direct spectrophotometric measurement in culture medium.
-
Research Protocol for Cardiovascular Diseases
Cardiovascular disease can be modeled as maladaptive cardiac remodeling, where ischemic injury or pressure overload activates inflammatory signaling, fibroblast activation, extracellular-matrix deposition, cardiomyocyte hypertrophy, vascular remodeling, and progressive ventricular dysfunction. The TGF-β/SMAD axis is a central profibrotic pathway after myocardial injury and pressure overload, while innate immune and cytokine pathways regulate leukocyte recruitment, scar formation, and adverse remodeling. Key unresolved questions include which inflammatory signals are reparative versus harmful, when fibrosis is protective versus maladaptive, and whether pathway inhibition improves function without weakening necessary infarct healing or compensatory remodeling.
-
Cell Counting-Based Growth Curve Assay
Cell counting-based growth curve assays quantify cell proliferation by directly measuring changes in viable cell number over time using manual or automated counting methods such as hemocytometer-based counting or instrument-assisted cell enumeration, enabling construction of growth curves that reflect population expansion dynamics in response to culture conditions. A widely used approach is trypan blue exclusion with hemocytometer counting, where membrane-compromised (non-viable) cells take up the dye, allowing discrimination between viable and non-viable cells while simultaneously enabling total cell number quantification. Repeated sampling across time points allows estimation of proliferation rate, growth phases, and comparative growth kinetics between experimental conditions.
-
Research Protocol for Inflammation-related Diseases
The NLRP3 inflammasome is a cytosolic innate immune signaling platform that integrates priming signals and danger-signal activation to promote caspase-1 activation, maturation of IL-1β and IL-18, and gasdermin D-mediated pyroptotic cell death. The core experimental logic is to determine whether inflammatory disease phenotypes are driven by increased NLRP3 expression, ASC-containing inflammasome assembly, caspase-1 cleavage, GSDMD cleavage, and extracellular release of IL-1β/IL-18 rather than by nonspecific cell injury alone. The pathway is strongly linked to inflammation-related disease phenotypes because monosodium urate crystals activate NALP3/NLRP3 inflammasome signaling in gout-like crystal inflammation, cholesterol crystals activate NLRP3 inflammasomes in atherogenesis models, and DSS-induced intestinal inflammation has been reported to involve NLRP3 inflammasome activity. However, experimental colitis studies also show context-dependent protective effects of NLRP3 inflammasome co
-
Colony Formation (Clonogenic) Assay
The clonogenic (colony formation) assay measures the ability of a single cell to retain reproductive viability and form a macroscopic colony, typically defined as a cluster derived from one progenitor cell after a defined growth period. This assay is widely used to evaluate cell survival after exposure to ionizing radiation or cytotoxic treatments and is considered a standard method in radiation biology for generating dose-response relationships of reproductive cell death. Colony formation reflects long-term proliferative capacity rather than short-term metabolic activity, and survival is quantified by comparing treated versus untreated conditions based on colony number and derived survival fractions.
-
Research Protocol for Neurological Diseases
PINK1/Parkin-mediated mitophagy pathway is a mitochondrial quality-control signaling axis in which mitochondrial depolarization stabilizes PINK1 on damaged mitochondria, activates Parkin recruitment and E3 ubiquitin ligase activity, promotes ubiquitination of outer mitochondrial membrane proteins, recruits selective autophagy adaptors, and drives lysosomal degradation of damaged mitochondria. In neurological disease research, this pathway is experimentally important because neurons, especially dopaminergic neurons, are highly dependent on mitochondrial integrity, and defective mitochondrial turnover can lead to mitochondrial dysfunction, oxidative stress, impaired neuronal survival, α-synuclein accumulation, and neuroinflammatory damage-associated signals. The genetic disease link is strongest in Parkinson’s disease because mutations in PRKN/parkin cause autosomal recessive juvenile parkinsonism, mutations in PINK1 cause hereditary early-onset Parkinson’s disease, and Drosophila studie
-
Research Protocol for Metabolic Diseases
AMP-activated protein kinase, AMPK, is a conserved cellular energy sensor that responds to reduced cellular energy status and coordinates metabolism by increasing ATP-generating catabolic pathways while suppressing ATP-consuming anabolic processes. In metabolic disease research, the AMPK pathway is experimentally relevant because it regulates hepatic lipid synthesis, fatty acid oxidation, glucose production, skeletal-muscle glucose disposal, mTORC1-linked biosynthesis, autophagy, mitochondrial homeostasis, and whole-body energy balance. The central pathway logic is that energy stress, metformin, exercise-like stimulation, or direct AMPK activators increase AMPKα Thr172 phosphorylation and downstream substrate phosphorylation, including ACC and RAPTOR. Phosphorylation of ACC suppresses lipogenesis and supports fatty acid oxidation, whereas phosphorylation of RAPTOR suppresses mTORC1 signaling and links cellular energy status to growth and protein synthesis control. The pathway is linked
-
Cell Viability Determination by MTT Colorimetric Assay
The following protocol uses the MTT colorimetric assay as a classic literature-established method for assessing cell viability/metabolic activity in cultured mammalian cells. MTT[3-(4,5-dimethylthiazol-2-yl)-2,5-diphenyltetrazolium bromide] is reduced by metabolically active cells to a colored formazan product; the amount of formazan is quantified spectrophotometrically and provides an indirect measure of metabolically active viable cells. Importantly, MTT reduction reflects cellular oxidoreductase/metabolic activity rather than an absolute direct count of living cells, so changes in cellular metabolism can alter the signal independently of cell number.
-
Collagen-Induced Arthritis
Collagen-induced arthritis (CIA) is an autoimmune murine model of rheumatoid arthritis in which immunization with type II collagen (CII) emulsified in an adjuvant induces a T cell- and autoantibody-driven inflammatory arthritis characterized by synovial hyperplasia, immune cell infiltration, and joint destruction. The model typically relies on genetically susceptible mouse strains (e. g. , DBA/1) and reproduces key features of human rheumatoid arthritis, including anti-collagen immune responses and progressive joint inflammation. Disease onset generally occurs within ~3-4 weeks after immunization, depending on antigen/adjuvant combinations and protocol variation. The immunopathology is driven by adaptive immune activation against CII, leading to systemic and local joint inflammation mediated by pro-inflammatory cytokines and effector immune cells, making CIA a standard preclinical platform for evaluating immunomodulatory and anti-arthritic interventions.
-
Protocol for Cell Counting and Cell Density Analysis
Cell counting and cell-density analysis estimate the number of cells in a known volume or field area. Manual hemocytometer counting uses a chamber of defined geometry to convert counted cells into cells/mL, while automated counters and image-analysis workflows detect cell objects from optical, brightfield, fluorescence, impedance, or digital-image features. Trypan blue viability counting is based on dye exclusion: viable cells with intact membranes exclude dye, while non-viable cells with compromised membranes stain blue. The readout is total cell density, viable-cell density, dead-cell density, and percent viability. Cell density can also be estimated from microscopy images by counting objects per image area, from flow cytometry using calibrated volume or reference particles, or from in situ microscopy in bioreactors after calibration against reference methods such as hemocytometer or flow cytometry.
-
Soft Agar Colony Formation Assay
Soft agar colony formation assay measures anchorage-independent growth, in which transformed or tumorigenic cells proliferate as colonies in a semisolid agar matrix while many non-transformed adherent cells fail to proliferate without attachment; classic studies showed that growth in semisolid medium correlates with tumorigenicity in nude mice, and later protocol papers describe the method as a stringent in vitro assay for malignant transformation. The readout is the number, size, morphology, or signal intensity of colonies formed within agar after incubation; published formats include manual colony counting after staining, 96-well or 384-well quantitative formats, DNA-binding dye detection, MTT/tetrazolium-based detection, digital image analysis, and PCR-based marker detection from soft agar cultures.
-
MTT Cell Proliferation Assay
The MTT assay is a colorimetric endpoint assay for estimating viable cell number, cell growth, cytotoxicity, or cell activation in cultured mammalian cells. Living cells reduce the yellow tetrazolium salt MTT into purple/blue formazan, while dead cells do not generate the same signal; the resulting color can be quantified with a multiwell spectrophotometer. MTT reduction is commonly interpreted as a readout of metabolic activity that often correlates with viable cell number, but it should not be treated as a direct cell-counting method unless the assay is optimized for the cell type and experimental condition. Studies show that MTT reduction can involve mitochondrial and non-mitochondrial reducing systems, and formazan may accumulate in intracellular lipid droplets rather than simply marking mitochondria.


Purity & Documentation
-
Data Sheet (263 KB)
-
SDS (251 KB)
- English - EN (251 KB)
- Français - FR (251 KB)
- Deutsch - DE (251 KB)
- Norwegian - NO (251 KB)
- Español - ES (251 KB)
- Swedish - SV (251 KB)
- Italian - IT (251 KB)
- Korean - KR (251 KB)
- Portuguese - PT (251 KB)
-
Inhibitory Antibodies User Guide (603 KB)
References
[1]. Marino Lee S, et al. Microglia depletion increase brain injury after acute ischemic stroke in aged mice. Exp Neurol. 2021 Feb;336:113530. [Content Brief]
[2]. Lim AK, et al. Antibody blockade of c-fms suppresses the progression of inflammation and injury in early diabetic nephropathy in obese db/db mice. Diabetologia. 2009 Aug;52(8):1669-79. [Content Brief]
[3]. Murayama T, et al. Intraperitoneal administration of anti-c-fms monoclonal antibody prevents initial events of atherogenesis but does not reduce the size of advanced lesions in apolipoprotein E-deficient mice. Circulation. 1999 Apr 6;99(13):1740-6. [Content Brief]
[4]. Toh ML, et al. Bone- and cartilage-protective effects of a monoclonal antibody against colony-stimulating factor 1 receptor in experimental arthritis. Arthritis Rheumatol. 2014 Nov;66(11):2989-3000. [Content Brief]

Calculators
Concentration (start) × Volume (start) = Concentration (final) × Volume (final)


Anti-Mouse CSF1R/CD115 Antibody (AFS98) Related Classifications
HY-P990125 Related Classifications
 Powered by Bioz