



DRB18
Based on 2 publication(s) in Google Scholar
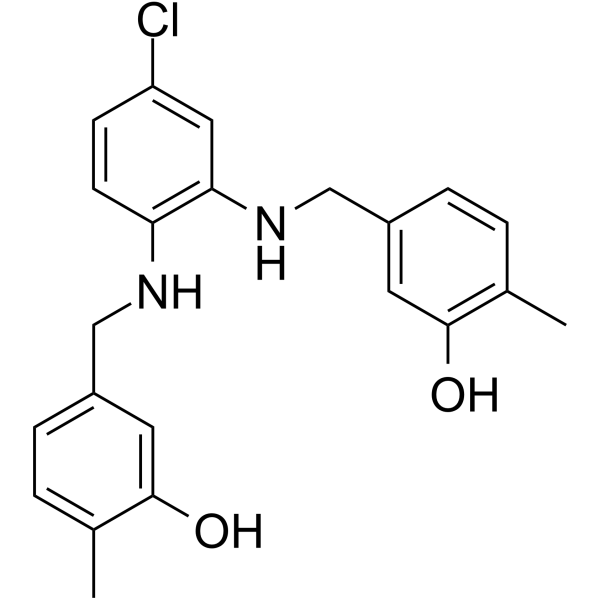
DRB18 is a potent pan-class GLUT inhibitor. DRB18 alters energy-related metabolism in A549 cells by changing the abundance of metabolites in glucose-related pathways. DRB18 can eventually lead to G1/S phase arrest and increase oxidative stress and necrotic cell death. DRB18 has anti-tumor activity.
For research use only. We do not sell to patients.
- Purity : 99.58%
- CAS No.: 2863686-81-9
- Formula: C22H23ClN2O2
- Molecular Weight:382.88
-
Storage:Powder -20°C, 3 years , 4°C, 2 years ; In solvent -80°C, 6 months , -20°C, 1 month

To place orders, for customer services and technical support, please contact: MedChemExpress USA
Tel: 609-228-6898 E-mail: [email protected] [email protected]


-
 Biological Activity
-
Chemical Information
-
Solvent & Solubility
- Protocols
- Purity & Documentation
- References
-
 Help & FAQs


-
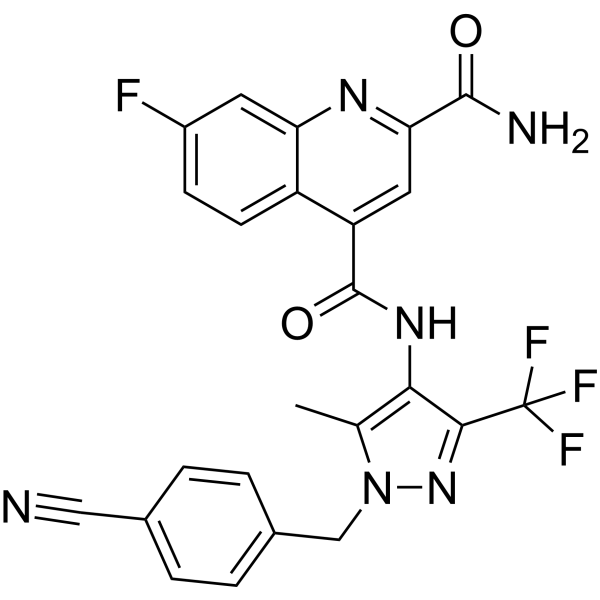
HY-100017
BAY-876GLUT1 Inhibitor -
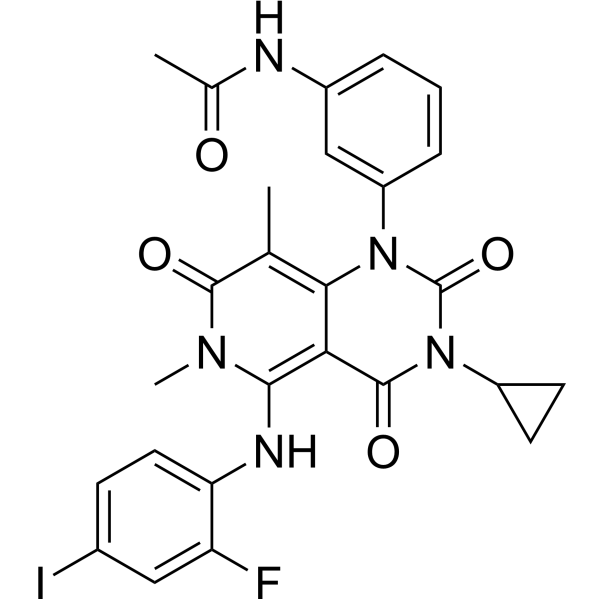
HY-10999
TrametinibMEK Inhibitor -
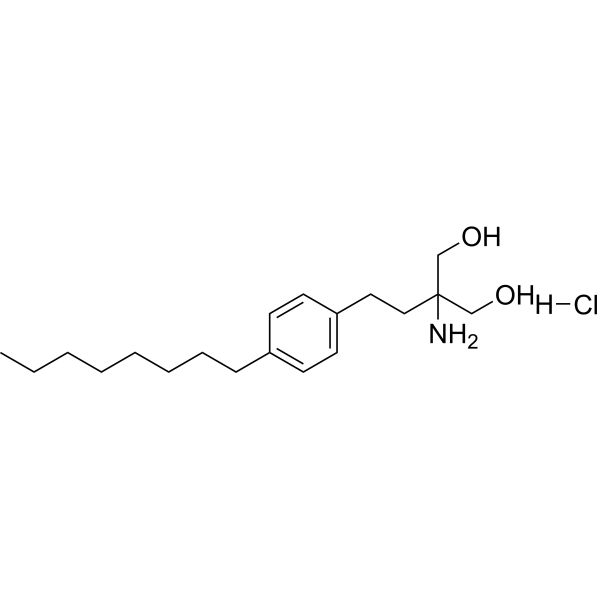
HY-12005
Fingolimod hydrochlorideS1P Receptors Modulator -
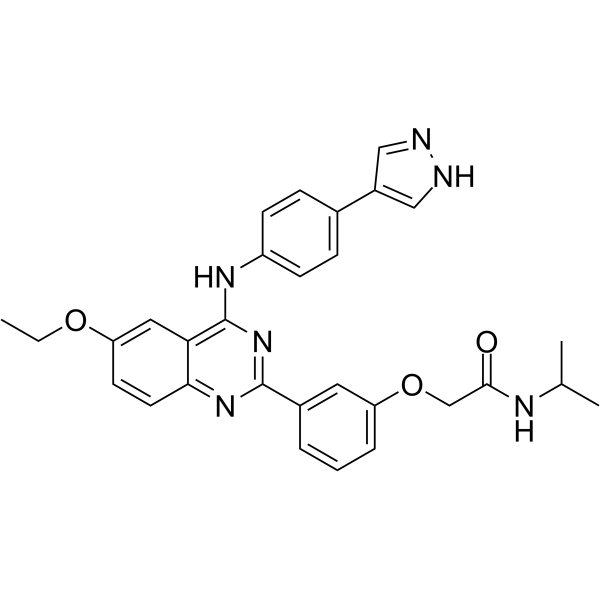
HY-145597
KL-11743GLUT1-4 Inhibitor -
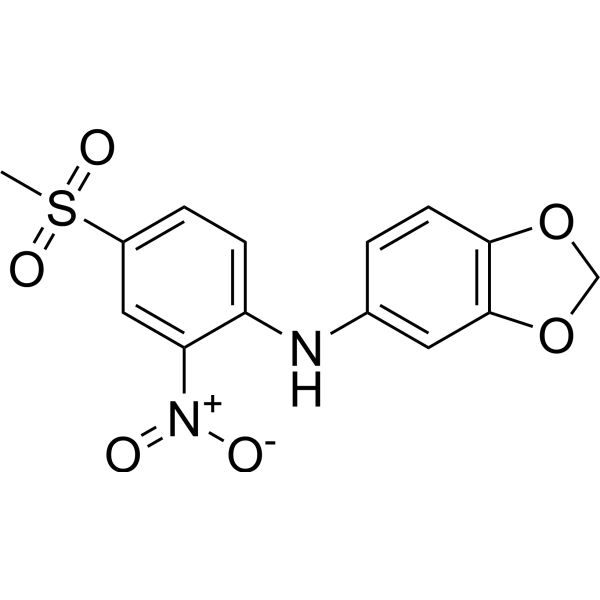
HY-W179181
MSNBAGLUT5 Fructose Transport Inhibitor -
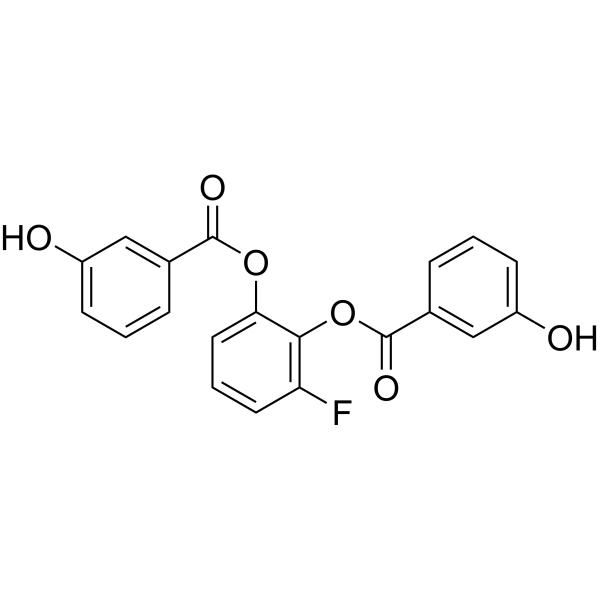
HY-19331
WZB117Glut1 Inhibitor -
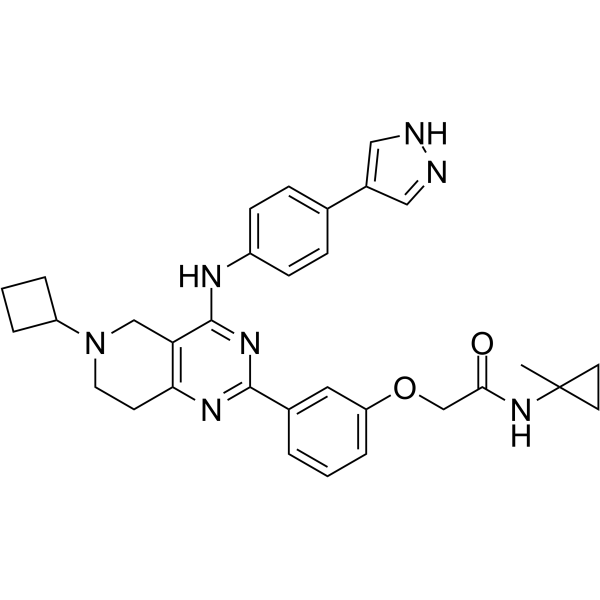
HY-139605
GLUT inhibitor-1GLUT1/GLUT3 Inhibitor -
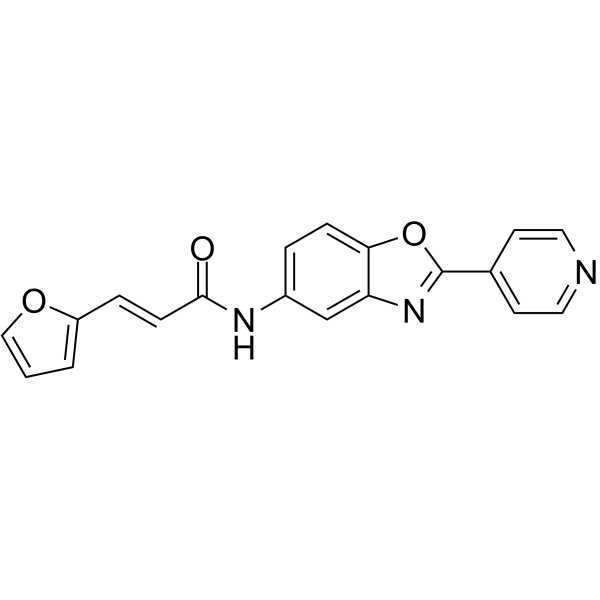
HY-139047
SW157765GLUT8 Inhibitor -

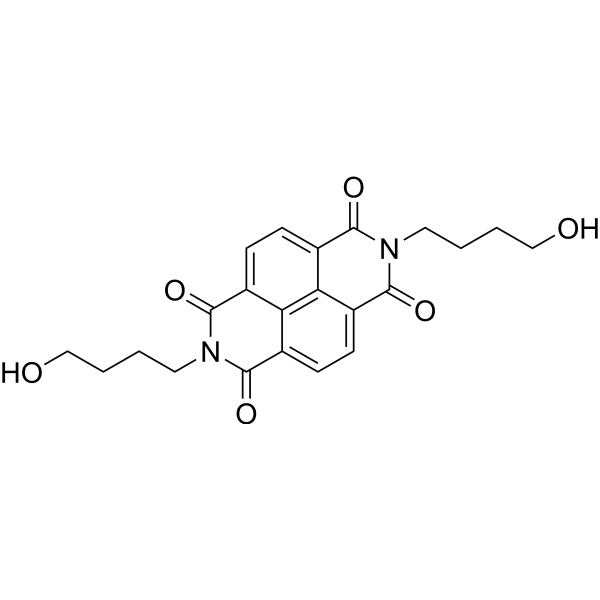
HY-100017R
BAY-876 (Standard)GLUT1 Inhibitor -
HY-153612
MMV009085PfHT1 Inhibitor -
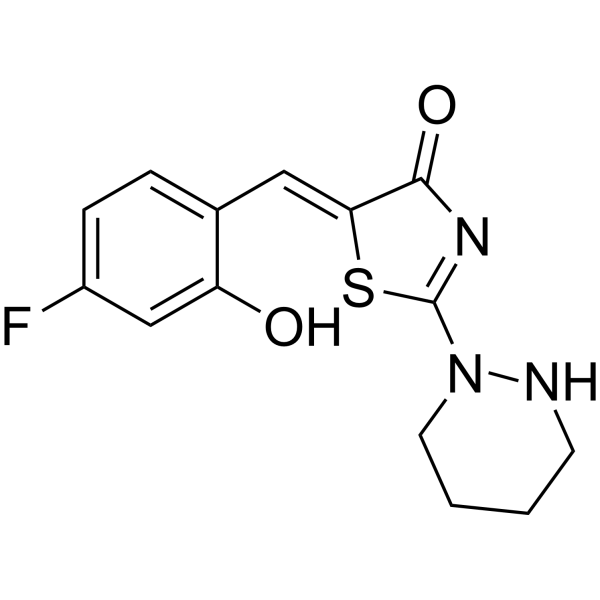
HY-110143
CLP257KCC2 Activator -
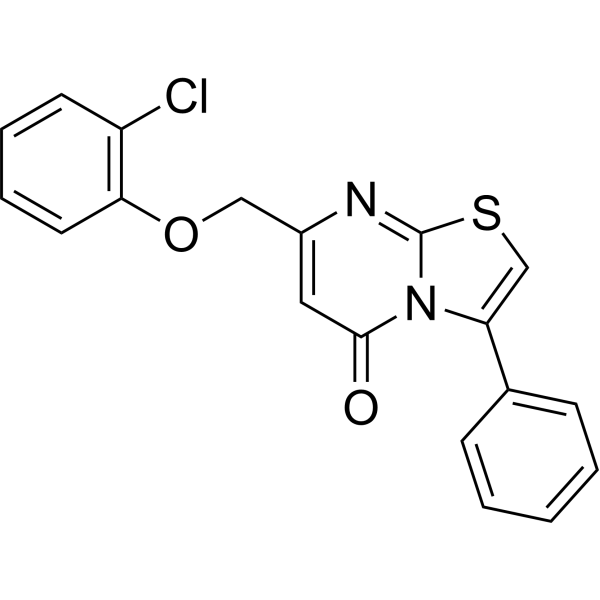
HY-149276
SLC26A3-IN-2SLC26A3 Inhibitor
Publications Citing Use of MedChemExpress (MCE) DRB18
More

Biological Activity
Description
IC50 & Target
GLUT[1]
Cellular Effect
|
Cell Line

|
Type | Value | Description | References |
|---|---|---|---|---|
| NCI-H1299 | IC50 |
1.9 μM
Compound: 4v
|
Inhibition of glucose uptake in human NCI-H1299 cells incubated for 10 mins followed by L-[3H]2-deoxyglucose and glucose addition and measured after 30 mins by scintillation counting method
Inhibition of glucose uptake in human NCI-H1299 cells incubated for 10 mins followed by L-[3H]2-deoxyglucose and glucose addition and measured after 30 mins by scintillation counting method
|
[PMID: 32736210] |
| NCI-H1299 | IC50 |
7 μM
Compound: 4v
|
Antiproliferative activity against human NCI-H1299 cells assessed as reduction in cell viability incubated for 48 hrs by MTT assay
Antiproliferative activity against human NCI-H1299 cells assessed as reduction in cell viability incubated for 48 hrs by MTT assay
|
[PMID: 32736210] |
In Vitro
DRB18 (0-10 μM; 30 min) reduces glucose uptake in GLUT1-4-expressed HEK293 cell lines in a dose-dependent manner with IC50s varying from ~ 900 nM to ~ 9 μM[1].
?
DRB18 (5 and 10 μM; 72 hours) causes cell cycle arrest in the G1/S phase transition[1].
?
DRB18 (5 and 10 μM; 72 hours) increases ROS levels in A549 cells[1].
?
DRB18 (5 and 10 μM; 72 hours) reduces expression of glycosylated GLUT1 and GLUT2-4 in A549 cells in a dose-dependent manner[1].
MedChemExpress (MCE) has not independently confirmed the accuracy of these methods. They are for reference only. Further protocols information, click here.
-
Cell Line:GLUT1-4-expressed HEK293 cell lines[1]
-
Concentration:0-10 μM
-
Incubation Time:30 min
-
Result:Reduced glucose uptake in these cell lines in a dose-dependent manner with IC50s varying from ~ 900 nM to ~ 9 μM.
-
Cell Line:A549[1]
-
Concentration:5 and 10 μM
-
Incubation Time:72 hours
-
Result:Caused cell cycle arrest in the G1/S phase transition.
-
Cell Line:A549[1]
-
Concentration:5 and 10 μM
-
Incubation Time:72 hours
-
Result:Reduced expression of glycosylated GLUT1 and GLUT2-4 in A549 cells in a dose-dependent manner.
-
Cell Line:A549[1]
-
Concentration:5 and 10 μM
-
Incubation Time:72 hours
-
Result:Reduced expression of glycosylated GLUT1 and GLUT2-4 in A549 cells in a dose-dependent manner.
In Vivo
MedChemExpress (MCE) has not independently confirmed the accuracy of these methods. They are for reference only.
-
Animal Model:Male NU/J nude mice (3-4 weeks; tumor cell-injected)[1]
-
Dosage:10 mg/kg
-
Administration:IP; thrice a week for 5 weeks
-
Result:The tumors were 44% smaller by volume and 43% smaller by weight, also showed DRB18 decreased expression of GLUT1-4 (Fig. 5f) and reduced proliferative capacity within the xenografted tumor.


Chemical Information
-
CAS No. 2863686-81-9
-
Appearance Solid
-
Molecular Weight 382.88
-
Formula C22H23ClN2O2
-
Color White to yellow
-
SMILES
ClC1=CC(NCC2=CC(O)=C(C)C=C2)=C(NCC3=CC=C(C)C(O)=C3)C=C1
-
Shipping
Room temperature in continental US; may vary elsewhere.
-
Storage
Powder -20°C 3 years 4°C 2 years In solvent -80°C 6 months -20°C 1 month


Publications (2)
-
Journal Impact Factor
-
Most Recent
-
Biochem Biophys Rep
Dimethyl-2-oxoglutarate but not antioxidants prevents glucose hypometabolism induced neural cell death: implications in the pathogenesis and therapy of Alzheimer's disease. [Abstract]2025 Jul 12:43:102150. PMID: 40688502 -


Solvent & Solubility
In Vitro:
DMSO : 50 mg/mL (130.59 mM; ultrasonic and warming and heat to 60°C; Hygroscopic DMSO has a significant impact on the solubility of product, please use newly opened DMSO)
Please refer to the solubility information to select the appropriate solvent. Once prepared, please aliquot and store the solution to prevent product inactivation from repeated freeze-thaw cycles.
Storage method and period of stock solution: -80°C, 6 months; -20°C, 1 month. When stored at -80°C, please use it within 6 months. When stored at -20°C, please use it within 1 month.
Please refer to the solubility information to select the appropriate solvent. Once prepared, please aliquot and store the solution to prevent product inactivation from repeated freeze-thaw cycles.
Storage method and period of stock solution: -80°C, 6 months; -20°C, 1 month. When stored at -80°C, please use it within 6 months. When stored at -20°C, please use it within 1 month.
Concentration (start) × Volume (start) = Concentration (final) × Volume (final)

Protocols
-
EdU Incorporation Assay (Click Chemistry-Based DNA Synthesis Measurement)
The EdU incorporation assay measures DNA synthesis by adding the thymidine analog 5-ethynyl-2′-deoxyuridine to cells or tissues, where it is incorporated into newly synthesized DNA during S phase. Incorporated EdU is detected by copper-catalyzed azide-alkyne cycloaddition, in which a fluorescent azide covalently reacts with the ethynyl group on EdU, allowing S-phase cells to be detected by fluorescence microscopy, flow cytometry, or high-content imaging. EdU detection does not require DNA denaturation or anti-BrdU antibody access, which preserves sample structure and improves compatibility with immunostaining and multiparameter cytometry compared with BrdU-based detection. EdU can be cytotoxic in a cell-type- and exposure-dependent manner, so pulse duration, concentration, and continuous-labeling designs should be validated for each cell type.
-
Flow cytometric DNA-content cell-cycle staining
Flow cytometric DNA-content cell-cycle staining measures the fluorescence intensity of DNA-bound fluorochromes in single cells or nuclei to estimate DNA content distributions, allowing assignment of populations to G0/G1, S, and G2/M phases by DNA histogram deconvolution. Propidium iodide (PI) intercalates into DNA, and PI fluorescence is proportional to cellular DNA content when staining is performed under conditions that make DNA accessible and minimize non-DNA signal. Cells with G2/M DNA content are expected to show approximately twice the fluorescence intensity of G0/G1 cells, while S-phase cells occupy intermediate fluorescence values. PI-based DNA-content analysis can also detect cells with fractional DNA content, often reported as sub-G1, when DNA fragmentation and extraction during staining reduce retained DNA signal in apoptotic cells. DAPI is an alternative DNA fluorochrome for univariate DNA-content analysis, while bivariate approaches combining DNA content with proliferation
-
Cell Cytotoxicity Assay
Cytotoxicity assays are usually based on the assessment of cell membrane damage, which can also be indirectly detected by measuring cell viability. Detection methods include MTT assay, CKK-8 assay, LDH assay and ATP assay, etc.
-
Mammalian live/dead viability and cytotoxicity staining
Live/dead viability and cytotoxicity staining assays are based on the simultaneous detection of intracellular esterase activity in metabolically active (viable) cells and membrane integrity loss in non-viable cells. In commonly used dual-staining approaches, membrane-permeant fluorogenic substrates are converted by intracellular esterases into fluorescent products in live cells, while impermeant DNA-binding dyes selectively enter cells with compromised plasma membranes and label nucleic acids in dead or dying cells, enabling discrimination between viable and non-viable populations by fluorescence microscopy or flow cytometry.
-
BrdU Incorporation Assay
Bromodeoxyuridine (BrdU) incorporation assay is based on the principle that BrdU, a thymidine analog, is incorporated into newly synthesized DNA during the S phase of the cell cycle, thereby serving as a marker of DNA replication and cellular proliferation. Incorporated BrdU can be detected using anti-BrdU antibodies following DNA denaturation, enabling visualization or quantification of proliferating cells through immunochemical detection methods such as immunofluorescence or immunohistochemistry.
-
ROS/oxidative-stress fluorescent staining
ROS/oxidative-stress fluorescent staining uses cell-permeant fluorogenic probes that become fluorescent after oxidation inside cells or tissues; commonly used examples include DCFH-DA/DCFDA for broad cellular oxidant detection, DHE for superoxide-related signal detection, MitoSOX for mitochondrial superoxide-related signal detection, and CellROX probes for oxidative-stress-associated fluorescence readouts. The assay detects probe oxidation rather than a single ROS species unless the probe and analysis method have been chemically validated for that species. DCFH-DA enters cells, is deacetylated by intracellular esterases to DCFH, and produces fluorescent DCF after oxidation, so the readout is used as an operational measure of total cellular oxidative stress rather than a species-specific ROS measurement. DHE and MitoSOX can report superoxide-related oxidation, but red fluorescence alone can include non-specific ethidium-like oxidation products; HPLC or optimized spectral approaches are
-
Apoptosis Solutions
Apoptosis is a regulated, generally non-lytic cell-death pathway that removes unwanted, damaged, infected, or abnormal cells through coordinated morphological changes, caspase activation, DNA fragmentation, and membrane remodeling. The intrinsic apoptosis pathway is controlled mainly by mitochondrial outer membrane permeabilization, BCL-2 family proteins, cytochrome c release, apoptosome formation, caspase-9 activation, and downstream executioner caspase-3/7 activation. The extrinsic apoptosis pathway is initiated by death receptors such as Fas, TNFR, and TRAIL receptors, which recruit adaptor proteins and activate caspase-8 before engaging executioner caspases or mitochondrial amplification through BID cleavage. Apoptosis is linked to many phenotypes, including cancer cell killing, tissue homeostasis, immune regulation, neurodegeneration, infection response, and treatment-induced cytotoxicity; unresolved questions include how apoptosis interacts with necroptosis, pyroptosis, ferroptos
-
Protocol for Cell Cycle
Cell-cycle analysis by flow cytometry measures DNA content in single cells to estimate the fraction of cells in G0/G1, S, and G2/M phases. Propidium iodide intercalates into DNA, and after RNA removal with RNase, fluorescence intensity reflects cellular DNA content: 2N cells are assigned to G0/G1, cells between 2N and 4N to S phase, and 4N cells to G2/M. DNA-content analysis alone cannot reliably separate G0 from G1 or G2 from M. Ki-67 can distinguish quiescent G0 cells from cycling cells, EdU or BrdU incorporation marks active DNA synthesis in S phase, and phospho-histone H3 staining identifies mitotic cells within the 4N population.


Purity & Documentation
-
Data Sheet (280 KB)
-
SDS (251 KB)
- English - EN (251 KB)
- Français - FR (251 KB)
- Deutsch - DE (251 KB)
- Norwegian - NO (251 KB)
- Español - ES (251 KB)
- Swedish - SV (251 KB)
- Italian - IT (251 KB)
- Korean - KR (251 KB)
- Portuguese - PT (251 KB)
-
Handling Instructions (2659 KB)
References


Complete Stock Solution Preparation Table
Please refer to the solubility information to select the appropriate solvent. Once prepared, please aliquot and store the solution to prevent product inactivation from repeated freeze-thaw cycles.
Storage method and period of stock solution: -80°C, 6 months; -20°C, 1 month. When stored at -80°C, please use it within 6 months. When stored at -20°C, please use it within 1 month.
| Optional Solvent | Concentration Solvent Mass | 1 mg | 5 mg | 10 mg | 25 mg |
|---|---|---|---|---|---|
| DMSO | 1 mM | 2.6118 mL | 13.0589 mL | 26.1178 mL | 65.2946 mL |
| 5 mM | 0.5224 mL | 2.6118 mL | 5.2236 mL | 13.0589 mL | |
| 10 mM | 0.2612 mL | 1.3059 mL | 2.6118 mL | 6.5295 mL | |
| 15 mM | 0.1741 mL | 0.8706 mL | 1.7412 mL | 4.3530 mL | |
| 20 mM | 0.1306 mL | 0.6529 mL | 1.3059 mL | 3.2647 mL | |
| 25 mM | 0.1045 mL | 0.5224 mL | 1.0447 mL | 2.6118 mL | |
| 30 mM | 0.0871 mL | 0.4353 mL | 0.8706 mL | 2.1765 mL | |
| 40 mM | 0.0653 mL | 0.3265 mL | 0.6529 mL | 1.6324 mL | |
| 50 mM | 0.0522 mL | 0.2612 mL | 0.5224 mL | 1.3059 mL | |
| 60 mM | 0.0435 mL | 0.2176 mL | 0.4353 mL | 1.0882 mL | |
| 80 mM | 0.0326 mL | 0.1632 mL | 0.3265 mL | 0.8162 mL | |
| 100 mM | 0.0261 mL | 0.1306 mL | 0.2612 mL | 0.6529 mL |


DRB18 Related Classifications
HY-145963 Related Classifications
 Powered by Bioz