



CMPF

Based on 1 Customer Validation
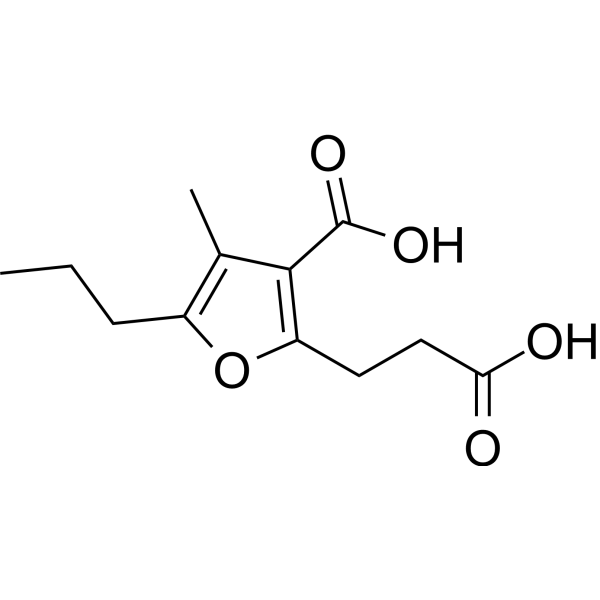
CMPF can be found in trace constituent of urine and blood. CMPF is a biomarker of type 2 diabetes. CMPF can act on the β cell and induces impaired mitochondrial function. CMPF decreases glucose-induced ATP accumulation, and induces oxidative stress. CMPF reverses hepatic lipid accumulation and improves insulin sensitivity in obese mice.
For research use only. We do not sell to patients.
- Purity : 99.64%
- CAS No.: 86879-39-2
- Formula: C12H16O5
- Molecular Weight:240.25
-
Storage:Powder -20°C, 3 years , 4°C, 2 years ; In solvent -80°C, 6 months , -20°C, 1 month

To place orders, for customer services and technical support, please contact: MedChemExpress USA
Tel: 609-228-6898 E-mail: [email protected] [email protected]


-
 Biological Activity
-
Chemical Information
-
Solvent & Solubility
- Protocols
- Purity & Documentation
- References
-
 Help & FAQs


All Endogenous Metabolite Isoforms
More

Biological Activity
Description
IC50 & Target
|
Human Endogenous Metabolite |


Chemical Information
-
CAS No. 86879-39-2
-
Appearance Solid
-
Molecular Weight 240.25
-
Formula C12H16O5
-
Color Off-white to light yellow
-
SMILES
O=C(O)CCC1=C(C(O)=O)C(C)=C(CCC)O1
-
Structure Classification
-
Initial Source
-
Shipping
Room temperature in continental US; may vary elsewhere.
-
Storage
Powder -20°C 3 years 4°C 2 years In solvent -80°C 6 months -20°C 1 month


Solvent & Solubility
In Vitro:
DMSO : 250 mg/mL (1040.58 mM; Need ultrasonic; Hygroscopic DMSO has a significant impact on the solubility of product, please use newly opened DMSO)
Please refer to the solubility information to select the appropriate solvent. Once prepared, please aliquot and store the solution to prevent product inactivation from repeated freeze-thaw cycles.
Storage method and period of stock solution: -80°C, 6 months; -20°C, 1 month. When stored at -80°C, please use it within 6 months. When stored at -20°C, please use it within 1 month.
Please refer to the solubility information to select the appropriate solvent. Once prepared, please aliquot and store the solution to prevent product inactivation from repeated freeze-thaw cycles.
Storage method and period of stock solution: -80°C, 6 months; -20°C, 1 month. When stored at -80°C, please use it within 6 months. When stored at -20°C, please use it within 1 month.
Concentration (start) × Volume (start) = Concentration (final) × Volume (final)
In Vivo:
Select the appropriate dissolution method based on your experimental animal and administration route.
- For the following dissolution methods, please ensure to first prepare a clear stock solution using an In Vitro approach and then sequentially add co-solvents:
- To ensure reliable experimental results, the clarified stock solution can be appropriately stored based on storage conditions. As for the working solution for In Vivo experiments, it is recommended to prepare freshly and use it on the same day.
- The percentages shown for the solvents indicate their volumetric ratio in the final prepared solution. If precipitation or phase separation occurs during preparation, heat and/or sonication can be used to aid dissolution.
Add each solvent one by one: 10% DMSO 40% PEG300 5% Tween-80 45% Saline
Solubility: ≥ 2.5 mg/mL (10.41 mM); Clear solution
This protocol yields a clear solution of ≥ 2.5 mg/mL (saturation unknown).
Taking 1 mL working solution as an example, add 100 μL DMSO stock solution (25.0 mg/mL) to 400 μL PEG300, and mix evenly; then add 50 μL Tween-80 and mix evenly; then add 450 μL Saline to adjust the volume to 1 mL.
Preparation of Saline: Dissolve 0.9 g sodium chloride in ddH₂O and dilute to 100 mL to obtain a clear Saline solution.
Add each solvent one by one: 10% DMSO 90% (20% SBE-β-CD in Saline)
Solubility: ≥ 2.5 mg/mL (10.41 mM); Clear solution
This protocol yields a clear solution of ≥ 2.5 mg/mL (saturation unknown).
Taking 1 mL working solution as an example, add 100 μL DMSO stock solution (25.0 mg/mL) to 900 μL 20% SBE-β-CD in Saline, and mix evenly.
Preparation of 20% SBE-β-CD in Saline (4°C, storage for one week): 2 g SBE-β-CD powder is dissolved in 10 mL Saline, completely dissolve until clear.
In Vivo Dissolution Calculator
Please enter the basic information of animal experiments:
-
-
-
-
Recommended: Prepare an additional quantity of animals to account for potential losses during experiments.
Please enter your animal formula composition:
-
%DMSO +
Recommended: Keep the proportion of DMSO in working solution below 2% if your animal is weak.
-
%+
-
+%Tween-80 + +
-
%Saline +
The co-solvents required include: DMSO, . All of co-solvents are available by MedChemExpress (MCE). , Tween 80. All of co-solvents are available by MedChemExpress (MCE).
Working solution concentration: 0.22 mg/mL
Method for preparing stock solution: mg drug dissolved in μL DMSO. Stock solution concentration: mg/mL.
1. Take μL DMSO stock solution;
2. Add μL .
μL , mix evenly;
3. Then add μL Tween 80, mix evenly;
4. Then add μL
Please ensure that the stock solution in the first step is dissolved to a clear state, and add co-solvents in sequence. You can use ultrasonic heating (ultrasonic cleaner, recommended frequency 20-40 kHz), vortexing, etc. to assist dissolution.

Protocols
-
3T3-L1 preadipocyte-to-adipocyte differentiation
3T3-L1 preadipocytes are induced to differentiate after growth arrest using adipogenic media containing insulin, dexamethasone, and IBMX; differentiation is assessed by lipid-droplet accumulation, triglyceride increase, Oil Red O staining, and adipocyte-marker induction such as PPARγ and C/EBPα.
-
Mitochondrial membrane-potential fluorescent assay
Mitochondrial membrane potential fluorescent assays estimate ΔΨm in living cells using lipophilic cationic dyes such as TMRM, TMRE, rhodamine 123, and JC-1, which accumulate in mitochondria according to membrane polarization; loss of signal after FCCP or CCCP treatment is interpreted as mitochondrial depolarization. TMRM/TMRE and rhodamine 123 are commonly used for semi-quantitative live-cell microscopy or flow cytometry, while JC-1 can report a shift from red aggregate fluorescence to green monomer fluorescence during depolarization; interpretation requires controls because dye concentration, quenching mode, cell type, dye efflux, and mitochondrial mass can affect fluorescence independently of ΔΨm.
-
ROS/oxidative-stress fluorescent staining
ROS/oxidative-stress fluorescent staining uses cell-permeant fluorogenic probes that become fluorescent after oxidation inside cells or tissues; commonly used examples include DCFH-DA/DCFDA for broad cellular oxidant detection, DHE for superoxide-related signal detection, MitoSOX for mitochondrial superoxide-related signal detection, and CellROX probes for oxidative-stress-associated fluorescence readouts. The assay detects probe oxidation rather than a single ROS species unless the probe and analysis method have been chemically validated for that species. DCFH-DA enters cells, is deacetylated by intracellular esterases to DCFH, and produces fluorescent DCF after oxidation, so the readout is used as an operational measure of total cellular oxidative stress rather than a species-specific ROS measurement. DHE and MitoSOX can report superoxide-related oxidation, but red fluorescence alone can include non-specific ethidium-like oxidation products; HPLC or optimized spectral approaches are
-
Research Protocol for Endocrine Diseases
Endocrine diseases often arise from disrupted hormone production, hormone signaling, or target-tissue responsiveness; for diabetes-focused endocrine disease models, insulin signaling regulates glucose uptake, hepatic glucose output, lipid metabolism, and β-cell compensation. Type 2 diabetes develops through interacting defects in insulin resistance, β-cell dysfunction, adipose inflammation, hepatic glucose overproduction, altered incretin signaling, and ectopic lipid metabolism. A major unresolved question is whether endocrine dysfunction is driven primarily by target-tissue insulin resistance, intrinsic β-cell failure, immune/inflammatory stress, or combined multi-organ failure that differs by disease stage.
-
Mitochondrial membrane-potential and mitochondrial mass staining
Mitochondrial membrane potential staining measures the electrochemical polarization across the mitochondrial inner membrane in live cells using lipophilic cationic fluorescent probes; early rhodamine-based work showed that selective mitochondrial dye accumulation is lost when the mitochondrial transmembrane potential is dissipated. JC-1 reports mitochondrial polarization by shifting from green monomer fluorescence to red J-aggregate fluorescence as dye concentration increases within energized mitochondria; therefore, the red/green fluorescence ratio is used as a relative readout of mitochondrial membrane potential. TMRE or TMRM staining provides a single-channel relative readout because these cationic rhodamine esters accumulate in polarized mitochondria, and lower fluorescence indicates reduced mitochondrial polarization when acquisition and dye-loading conditions are controlled. Mitochondrial mass staining is commonly performed with MitoTracker Green FM or related MitoTracker dyes as
-
Research Protocol for Metabolic Diseases
AMP-activated protein kinase, AMPK, is a conserved cellular energy sensor that responds to reduced cellular energy status and coordinates metabolism by increasing ATP-generating catabolic pathways while suppressing ATP-consuming anabolic processes. In metabolic disease research, the AMPK pathway is experimentally relevant because it regulates hepatic lipid synthesis, fatty acid oxidation, glucose production, skeletal-muscle glucose disposal, mTORC1-linked biosynthesis, autophagy, mitochondrial homeostasis, and whole-body energy balance. The central pathway logic is that energy stress, metformin, exercise-like stimulation, or direct AMPK activators increase AMPKα Thr172 phosphorylation and downstream substrate phosphorylation, including ACC and RAPTOR. Phosphorylation of ACC suppresses lipogenesis and supports fatty acid oxidation, whereas phosphorylation of RAPTOR suppresses mTORC1 signaling and links cellular energy status to growth and protein synthesis control. The pathway is linked
-
Lipid Droplets: Oil Red O/Sudan Dye Lipid Staining
Lipid droplets are intracellular organelles with a neutral-lipid core that stores triacylglycerols and sterol esters, and Oil Red O or Sudan dyes detect these hydrophobic lipid deposits by partitioning into retained lipids in fresh or frozen specimens. Oil Red O stains neutral triglycerides and lipids in frozen tissue sections or air-dried cytologic preparations, while Sudan Black B has also been used as a histochemical fat stain for lipid-rich tissue structures.


Purity & Documentation
-
Data Sheet (272 KB)
-
SDS (251 KB)
- English - EN (251 KB)
- Français - FR (251 KB)
- Deutsch - DE (251 KB)
- Norwegian - NO (251 KB)
- Español - ES (251 KB)
- Swedish - SV (251 KB)
- Italian - IT (251 KB)
- Korean - KR (251 KB)
- Portuguese - PT (251 KB)
-
Handling Instructions (2659 KB)
References
[1]. Prentice KJ, et al. The furan fatty acid metabolite CMPF is elevated in diabetes and induces β cell dysfunction. Cell Metab. 2014 Apr 1;19(4):653-66. [Content Brief]
[2]. Prentice KJ, et al. CMPF, a Metabolite Formed Upon Prescription Omega-3-Acid Ethyl Ester Supplementation, Prevents and Reverses Steatosis. EBioMedicine. 2018 Jan;27:200-213. [Content Brief]


Complete Stock Solution Preparation Table
Please refer to the solubility information to select the appropriate solvent. Once prepared, please aliquot and store the solution to prevent product inactivation from repeated freeze-thaw cycles.
Storage method and period of stock solution: -80°C, 6 months; -20°C, 1 month. When stored at -80°C, please use it within 6 months. When stored at -20°C, please use it within 1 month.
| Optional Solvent | Concentration Solvent Mass | 1 mg | 5 mg | 10 mg | 25 mg |
|---|---|---|---|---|---|
| DMSO | 1 mM | 4.1623 mL | 20.8117 mL | 41.6233 mL | 104.0583 mL |
| 5 mM | 0.8325 mL | 4.1623 mL | 8.3247 mL | 20.8117 mL | |
| 10 mM | 0.4162 mL | 2.0812 mL | 4.1623 mL | 10.4058 mL | |
| 15 mM | 0.2775 mL | 1.3874 mL | 2.7749 mL | 6.9372 mL | |
| 20 mM | 0.2081 mL | 1.0406 mL | 2.0812 mL | 5.2029 mL | |
| 25 mM | 0.1665 mL | 0.8325 mL | 1.6649 mL | 4.1623 mL | |
| 30 mM | 0.1387 mL | 0.6937 mL | 1.3874 mL | 3.4686 mL | |
| 40 mM | 0.1041 mL | 0.5203 mL | 1.0406 mL | 2.6015 mL | |
| 50 mM | 0.0832 mL | 0.4162 mL | 0.8325 mL | 2.0812 mL | |
| 60 mM | 0.0694 mL | 0.3469 mL | 0.6937 mL | 1.7343 mL | |
| 80 mM | 0.0520 mL | 0.2601 mL | 0.5203 mL | 1.3007 mL | |
| 100 mM | 0.0416 mL | 0.2081 mL | 0.4162 mL | 1.0406 mL |


CMPF Related Classifications
HY-129297 Related Classifications
 Powered by Bioz