
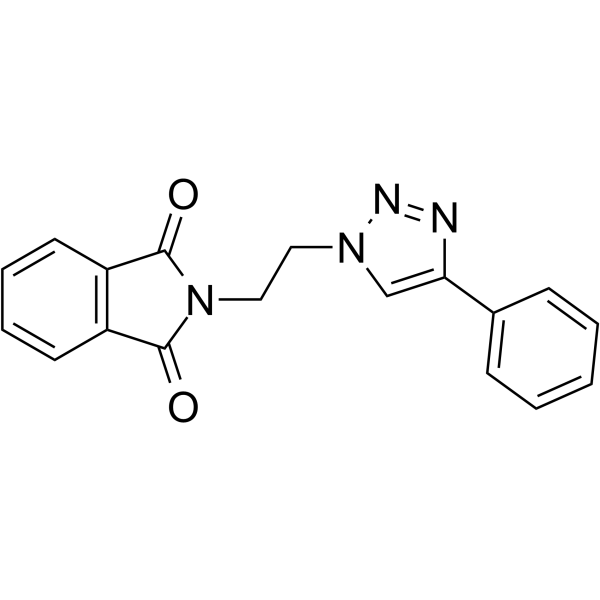
PT4
PT4 is a therapeutic agent against Cutaneous leishmaniasis (CL). PT4 is effective against both species of Leishmania, with IC50s of 125.18 and 233.18 μM for L. amazonensis and L. braziliensis, respectively. PT4 decreases of mitochondrial membrane potential and increases production of reactive oxygen species, which leads to parasite death. PT4 has a potent in vivo anti-inflammatory activity.
For research use only. We do not sell to patients.
- CAS No.: 1280738-47-7
- Formula: C18H14N4O2
- Molecular Weight:318.33
-
Storage:
Please store the product under the recommended conditions in the Certificate of Analysis.
All Parasite Isoforms
More
Biological Activity
Description
Cellular Effect
|
Cell Line
|
Type | Value | Description | References |
|---|---|---|---|---|
| J774.A1 | CC50 |
>500 μM
Compound: 58
|
Cytotoxicity against mouse J774.A1 cells assessed as reduction in cell viability incubated for 48 hrs by MTT assay
|
[PMID: 34171661] |
In Vitro
PT4 (0-1256.5 µM, 48 hours) can inhibit mammalian cells viability[1]. PT4 (314.1-19.6 μM, 48 hours) inhibits the growth of promastigote and amastigote of L. amazonensis and L. braziliensis promastigotes[1]. PT4 causes depolarization of the mitochondrial membrane of L. amazonensis and L. braziliensis promastigotes and increasing ROS in mitochondria[1].
MedChemExpress (MCE) has not independently confirmed the accuracy of these methods. They are for reference only. Further protocols information, click here.
-
Cell Line:Balb/c mice peritoneal exudate (mPEC), J774A.1 macrophages, Fibroblasts
-
Concentration:0-1256.5 µM
-
Incubation Time:48 hours
-
Result:Inhibited mPEC, J774A.1 and fibroblasts with CC50 value of 981.37 μM, 521.47 μM and 895.17 μM, respectively.
-
Cell Line:L. amazonensis, L. braziliensis promastigotes
-
Concentration:314.1-19.6 μM
-
Incubation Time:48 hours
-
Result:Inhibited promastigote of L. amazonensis and L. braziliensis promastigotes with IC50 value of 70.46 μM and 181.73 μM, respectively. Inhibited amastigote of them with IC50 value of 125.18 μM and 233.18 μM, respectively.
In Vivo
| Parameter | |
| HBA (≤10) | 4 |
| HBD (≤5) | 0 |
| LogP (≤5) | 2.23 |
| MW (≤500) g/mol | 318.33 |
| n-ROTB (≤10) | 4 |
| TPSA (A2) | 68.09 |
| BBB | Yes |
| GIA | High |
| P-GP substrate | No |
| Skin permeability (cm/s) | -6.85 |
| CYP450 2C9 inhibitor | Yes |
| CYP450 2D6 inhibitor | No |
| CYP450 2C19 inhibitor | Yes |
| CYP450 3A4 inhibitor | No |
| CYP450 1A2 inhibitor | Yes |
| Total Clearance (log ml/min/kg) | 0.117 |
| Renal OCT2 substrate | No |
| LD50 (mg/Kg) | 4700 |
MedChemExpress (MCE) has not independently confirmed the accuracy of these methods. They are for reference only.
Chemical Information
-
CAS No. 1280738-47-7
-
Molecular Weight 318.33
-
Formula C18H14N4O2
-
SMILES
O=C1N(CCN2N=NC(C3=CC=CC=C3)=C2)C(C4=C1C=CC=C4)=O
-
Shipping
Room temperature in continental US; may vary elsewhere.
-
Storage
Please store the product under the recommended conditions in the Certificate of Analysis.
Protocols
-
Mitochondrial membrane-potential fluorescent assay
Mitochondrial membrane potential fluorescent assays estimate ΔΨm in living cells using lipophilic cationic dyes such as TMRM, TMRE, rhodamine 123, and JC-1, which accumulate in mitochondria according to membrane polarization; loss of signal after FCCP or CCCP treatment is interpreted as mitochondrial depolarization. TMRM/TMRE and rhodamine 123 are commonly used for semi-quantitative live-cell microscopy or flow cytometry, while JC-1 can report a shift from red aggregate fluorescence to green monomer fluorescence during depolarization; interpretation requires controls because dye concentration, quenching mode, cell type, dye efflux, and mitochondrial mass can affect fluorescence independently of ΔΨm.
-
ROS/oxidative-stress fluorescent staining
ROS/oxidative-stress fluorescent staining uses cell-permeant fluorogenic probes that become fluorescent after oxidation inside cells or tissues; commonly used examples include DCFH-DA/DCFDA for broad cellular oxidant detection, DHE for superoxide-related signal detection, MitoSOX for mitochondrial superoxide-related signal detection, and CellROX probes for oxidative-stress-associated fluorescence readouts. The assay detects probe oxidation rather than a single ROS species unless the probe and analysis method have been chemically validated for that species. DCFH-DA enters cells, is deacetylated by intracellular esterases to DCFH, and produces fluorescent DCF after oxidation, so the readout is used as an operational measure of total cellular oxidative stress rather than a species-specific ROS measurement. DHE and MitoSOX can report superoxide-related oxidation, but red fluorescence alone can include non-specific ethidium-like oxidation products; HPLC or optimized spectral approaches are
-
Cotton Pellet Granuloma
Cotton pellet granuloma is a classical in vivo chronic inflammation model used to evaluate the anti-inflammatory potential of test substances by measuring their ability to inhibit granuloma tissue formation around an implanted foreign body (cotton pellet) in rodents. The method is based on the biological response to a sterile implanted material, which induces proliferative phase inflammation characterized by fibroblast proliferation and collagen-rich granuloma formation, and the final readout reflects the extent of chronic inflammatory tissue growth surrounding the pellet. In multiple preclinical pharmacological evaluations, inhibition of cotton pellet-induced granuloma formation has been used as an indicator of anti-inflammatory activity in both synthetic and natural product screening contexts.
-
Carrageenan-Induced Paw Edema
Carrageenan-induced paw edema is an acute inflammation model in which intraplantar injection of carrageenan induces localized inflammatory swelling characterized by vascular permeability, leukocyte infiltration, and production of inflammatory mediators such as prostaglandins and cytokines, making it widely used to evaluate anti-inflammatory agents in vivo. The resulting paw volume or thickness increase is quantified over time as a direct readout of inflammatory intensity and drug efficacy, typically reflecting cyclooxygenase-mediated prostaglandin-driven edema formation and immune cell recruitment in peripheral tissue[20].
-
Fluorescent plasma-membrane potential dye assay
Fluorescent plasma-membrane potential dye assays measure changes in cell membrane potential using voltage-sensitive dyes whose fluorescence changes when cells depolarize or hyperpolarize. Anionic bis-oxonol dyes such as DiBAC4(3) enter depolarized cells more readily and show increased fluorescence after intracellular binding, while hyperpolarization reduces dye accumulation and fluorescence. FMP/FLIPR membrane-potential dyes are used for faster, homogeneous microplate assays of ion-channel or receptor-mediated membrane-potential changes.
-
Mitochondrial membrane-potential and mitochondrial mass staining
Mitochondrial membrane potential staining measures the electrochemical polarization across the mitochondrial inner membrane in live cells using lipophilic cationic fluorescent probes; early rhodamine-based work showed that selective mitochondrial dye accumulation is lost when the mitochondrial transmembrane potential is dissipated. JC-1 reports mitochondrial polarization by shifting from green monomer fluorescence to red J-aggregate fluorescence as dye concentration increases within energized mitochondria; therefore, the red/green fluorescence ratio is used as a relative readout of mitochondrial membrane potential. TMRE or TMRM staining provides a single-channel relative readout because these cationic rhodamine esters accumulate in polarized mitochondria, and lower fluorescence indicates reduced mitochondrial polarization when acquisition and dye-loading conditions are controlled. Mitochondrial mass staining is commonly performed with MitoTracker Green FM or related MitoTracker dyes as
-
Research Protocol for Inflammation-related Diseases
The NLRP3 inflammasome is a cytosolic innate immune signaling platform that integrates priming signals and danger-signal activation to promote caspase-1 activation, maturation of IL-1β and IL-18, and gasdermin D-mediated pyroptotic cell death. The core experimental logic is to determine whether inflammatory disease phenotypes are driven by increased NLRP3 expression, ASC-containing inflammasome assembly, caspase-1 cleavage, GSDMD cleavage, and extracellular release of IL-1β/IL-18 rather than by nonspecific cell injury alone. The pathway is strongly linked to inflammation-related disease phenotypes because monosodium urate crystals activate NALP3/NLRP3 inflammasome signaling in gout-like crystal inflammation, cholesterol crystals activate NLRP3 inflammasomes in atherogenesis models, and DSS-induced intestinal inflammation has been reported to involve NLRP3 inflammasome activity. However, experimental colitis studies also show context-dependent protective effects of NLRP3 inflammasome co
Purity & Documentation
References
Calculators
Concentration (start) × Volume (start) = Concentration (final) × Volume (final)

