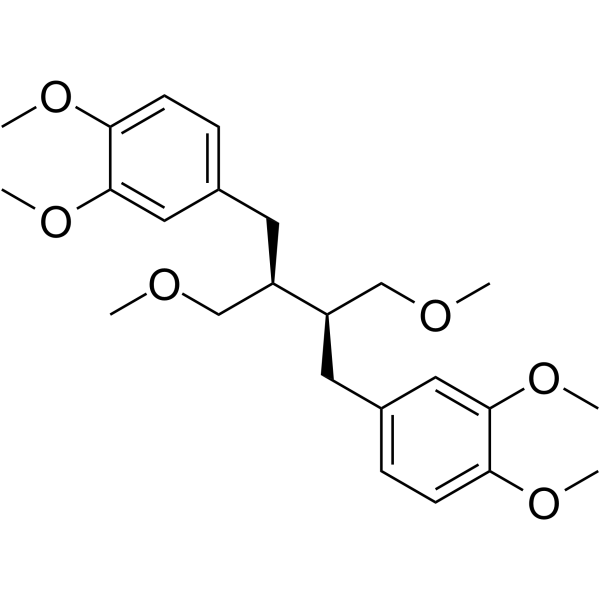
Phyllanthin
Based on 1 publication(s) in Google Scholar
Phyllanthin is an effective oral anticancer agent. Phyllanthin inhibits MOLT-4 cell viability, increases apoptosis, inhibits cell migration and invasion. Phyllanthin exerts anti-fibrotic effects by down-regulating TGF signaling pathway via ALK5 and Smad2/3. Phyllanthin also has anti-inflammatory and antibacterial properties .
For research use only. We do not sell to patients.
- Purity : 99.97%
- CAS No.: 10351-88-9
- Formula: C24H34O6
- Molecular Weight:418.52
-
Storage:
4°C, protect from light
* In solvent : -80°C, 6 months; -20°C, 1 month (protect from light)
Publications Citing Use of MedChemExpress (MCE) Phyllanthin
More
Biological Activity
Description
IC50 & Target
Inhibits TGF-β1 with inhibition constant of 33.15 mM.
In Vitro
Phyllanthin (1.56, 6.25 and 25μM; 2 h) inhibits LPS (HY-D1056) induced proinflammatory responses in U937 macrophages [4].
Phyllanthin (5-100 μM/mL; 24 h) inhibits cell growth with an IC 50 value of 25 µM/mL, and induces apoptosis in MOLT-4 leukemia cancer cells [3].
Phyllanthin is predicted to have strong activity against COVID-19 through inhibiting spike glycoprotein and main protease [7].
MedChemExpress (MCE) has not independently confirmed the accuracy of these methods. They are for reference only. Further protocols information, click here.
-
Cell Line:U937 macrophages, MOLT-4 cells and normal MS‐5 cells
-
Concentration:1.56, 3.12, 6.25, 12.5, and 25 μM (U937 macrophages);
5, 10, 25, 50, 75, and 100 μM/mL (MOLT-4 cells and normal MS‐5 cells) -
Incubation Time:24 h
-
Result:No effect on the viability of U937 macrophages and MS‐5 cells.
Reduced cell viability of MOLT-4 in a dose-dependent manner.
-
Cell Line:LPS (1 μg/mL) (HY- D1056) treated U937 macrophages for 30 min
-
Concentration:1.56, 6.25, and 25 μM
-
Incubation Time:2 h
-
Result:Inhibited phosphorylation levels of IKKα/β, p65 and IκBα in a concentration‐dependent manner.
Suppressed LPS‐stimulated activation of JNK, ERK, p38 and AKT in a concentration‐dependent manner.
-
Cell Line:LPS (1 μg/mL) (HY- D1056) treated U937 macrophages for 1 day
-
Concentration:1.56, 6.25 and 25 μM
-
Incubation Time:2 h
-
Result:Dose-dependently suppressed the increased TNF‐α mRNA level at concentrations of 1.25, 6.25 and 25 μM.
Significantly suppressed IL‐1β gene expression at concentrations of 6.25 and 25 μM.
In Vivo
Phyllanthin (30 mg/kg; oral administration; single dose) exerts anti-tumor effects in diethylnitrosamine (HY-N7434) induced liver carcinogenesis in rats [5].
Phyllanthin (20-100 mg/kg; oral administration; once a day; 14 days) inhibits cellular and humoral immune responses in Balb/C mice [6].
MedChemExpress (MCE) has not independently confirmed the accuracy of these methods. They are for reference only.
-
Animal Model:Carbon tetrachloride (HY-Y0298) treated Swiss strain female mice (32-35 g) [2]
-
Dosage:10 mg/kg
-
Administration:Oral administration (p.o.); once a day; 30 days
-
Result:Normalized the level of liver marker enzymes (ALT and AST) and collagen content in hepatotoxicity and experimental liver fibrosis mice.
Restored normal liver architecture, reversed the formation of continuous fibrotic septa between the central and portal veins and nodules.
Reduced the levels of TGF-β1, ALK5, p-Smad2 and p-Smad3 in hepatotoxicity and experimental liver fibrosis mice.
-
Animal Model:Diethylnitrosamine (Cat. No. HY-N7434) treated male Wistar albino rats (210-230 g)[5]
-
Dosage:30 mg/kg
-
Administration:Oral administration (p.o.); single dose
-
Result:Significantly reduced 8-OHdG levels and delayed the oxidative damage in diethylnitrosamine -induced liver cancer rats.
Significantly reduced liver tissue injury biomarkers (ALT, AST, GGT, ALP and LDH) levels and tumor markers (AFP and CEA).
Reduced cellular enlargement, nodules, and hyperplasiaenlargement in diethylnitrosamine-induced liver tissue.
-
Animal Model:Male Balb/C mice aged 6-8 weeks old (18-22 g) [6]
-
Dosage:20 mg/kg, 40 mg/kg, and 100 mg/kg
-
Administration:Oral administration (p.o.); once a day; 14 days
-
Result:Dose-dependently inhibited CD11b/CD18 adhesion, the engulfment of E.coli by peritoneal macrophages molecules, NO and MPO release.
Dose-dependently inhibited T and B lymphocytes proliferation and down-regulated Th1 (IL-2 and IFN-γ) and Th2 (IL-4) cytokines.
Dose-dependently inhibited the sheep red blood cell (sRBC)-induced swelling rate of mice paw in delayed type hypersensitivity.
Significantly inhibited the serum levels of ceruloplasmin and lysozyme at higher doses (40 and 100 mg/kg).
Dose-dependently down-regulated anti-sRBC immunoglobulins (IgM and IgG) antibody titer.
Chemical Information
-
CAS No. 10351-88-9
-
Appearance Solid
-
Molecular Weight 418.52
-
Formula C24H34O6
-
Color White to off-white
-
SMILES
COC[C@@H](CC1=CC=C(OC)C(OC)=C1)[C@@H](COC)CC2=CC=C(OC)C(OC)=C2
-
Structure Classification
-
Initial Source
-
Shipping
Room temperature in continental US; may vary elsewhere.
-
Storage
4°C, protect from light
* In solvent : -80°C, 6 months; -20°C, 1 month (protect from light)
Publications (1)
-
Journal Impact Factor
-
Most Recent
Solvent & Solubility
In Vitro:
DMSO : 62.5 mg/mL (149.34 mM; ultrasonic and warming and heat to 60°C; Hygroscopic DMSO has a significant impact on the solubility of product, please use newly opened DMSO)
Please refer to the solubility information to select the appropriate solvent. Once prepared, please aliquot and store the solution to prevent product inactivation from repeated freeze-thaw cycles.
Storage method and period of stock solution: -80°C, 6 months; -20°C, 1 month (protect from light). When stored at -80°C, please use it within 6 months. When stored at -20°C, please use it within 1 month.
Please refer to the solubility information to select the appropriate solvent. Once prepared, please aliquot and store the solution to prevent product inactivation from repeated freeze-thaw cycles.
Storage method and period of stock solution: -80°C, 6 months; -20°C, 1 month (protect from light). When stored at -80°C, please use it within 6 months. When stored at -20°C, please use it within 1 month.
Concentration (start) × Volume (start) = Concentration (final) × Volume (final)
In Vivo:
Select the appropriate dissolution method based on your experimental animal and administration route.
- For the following dissolution methods, please ensure to first prepare a clear stock solution using an In Vitro approach and then sequentially add co-solvents:
- To ensure reliable experimental results, the clarified stock solution can be appropriately stored based on storage conditions. As for the working solution for In Vivo experiments, it is recommended to prepare freshly and use it on the same day.
- The percentages shown for the solvents indicate their volumetric ratio in the final prepared solution. If precipitation or phase separation occurs during preparation, heat and/or sonication can be used to aid dissolution.
Add each solvent one by one: 10% DMSO 40% PEG300 5% Tween-80 45% Saline
Solubility: ≥ 2.5 mg/mL (5.97 mM); Clear solution
This protocol yields a clear solution of ≥ 2.5 mg/mL (saturation unknown).
Taking 1 mL working solution as an example, add 100 μL DMSO stock solution (25.0 mg/mL) to 400 μL PEG300, and mix evenly; then add 50 μL Tween-80 and mix evenly; then add 450 μL Saline to adjust the volume to 1 mL.
Preparation of Saline: Dissolve 0.9 g sodium chloride in ddH₂O and dilute to 100 mL to obtain a clear Saline solution.
In Vivo Dissolution Calculator
Please enter the basic information of animal experiments:
-
-
-
-
Recommended: Prepare an additional quantity of animals to account for potential losses during experiments.
Please enter your animal formula composition:
-
%DMSO +
Recommended: Keep the proportion of DMSO in working solution below 2% if your animal is weak.
-
%+
-
+%Tween-80 + +
-
%Saline +
The co-solvents required include: DMSO, . All of co-solvents are available by MedChemExpress (MCE). , Tween 80. All of co-solvents are available by MedChemExpress (MCE).
Working solution concentration: 0.22 mg/mL
Method for preparing stock solution: mg drug dissolved in μL DMSO. Stock solution concentration: mg/mL. * In solvent : -80°C, 6 months; -20°C, 1 month (protect from light)

1. Take μL DMSO stock solution;
2. Add μL .
μL , mix evenly;
3. Then add μL Tween 80, mix evenly;
4. Then add μL
Please ensure that the stock solution in the first step is dissolved to a clear state, and add co-solvents in sequence. You can use ultrasonic heating (ultrasonic cleaner, recommended frequency 20-40 kHz), vortexing, etc. to assist dissolution.
Protocols
-
Scratch/Wound-Healing Migration Assay
The scratch/wound-healing migration assay measures collective migration of adherent cells into an experimentally created cell-free gap in a confluent monolayer. The readout is generated by imaging the gap immediately after scratching and at later time points, then quantifying reduction in wound area, wound width, or percentage closure as cells move into the denuded region. Gap closure reflects cell migration but may also include cell proliferation, so interpretation should distinguish migration-focused conditions from proliferation-driven closure when possible, such as by using short assay windows, serum-controlled conditions, cell counting, or proliferation controls reported in published protocols.
-
Research Protocol for Infectious Diseases
Infectious-disease experiments test how pathogens interact with host barriers, innate immune receptors, inflammatory signaling, pathogen replication, and tissue injury; pattern-recognition receptors such as TLRs, RIG-I-like receptors, NOD-like receptors, and inflammasomes detect microbial molecules and activate NF-κB, interferon, and cytokine responses. The central hypothesis is that infection severity reflects the balance between pathogen burden and host response: protective inflammation restricts pathogen growth, whereas excessive or mislocalized inflammation contributes to tissue damage and disease phenotype. Unresolved questions include which host pathways are protective versus pathogenic, why some infection models fail to translate to human disease, and which combined readouts best predict clinically relevant infection outcomes.
-
Mammalian live/dead viability and cytotoxicity staining
Live/dead viability and cytotoxicity staining assays are based on the simultaneous detection of intracellular esterase activity in metabolically active (viable) cells and membrane integrity loss in non-viable cells. In commonly used dual-staining approaches, membrane-permeant fluorogenic substrates are converted by intracellular esterases into fluorescent products in live cells, while impermeant DNA-binding dyes selectively enter cells with compromised plasma membranes and label nucleic acids in dead or dying cells, enabling discrimination between viable and non-viable populations by fluorescence microscopy or flow cytometry.
-
Annexin V plus membrane-impermeant dye apoptosis staining
Annexin V-based apoptosis assays rely on the detection of phosphatidylserine (PS) externalization from the inner leaflet of the plasma membrane to the outer leaflet, an early biochemical hallmark of apoptosis. Fluorescently labeled Annexin V binds PS in a calcium-dependent manner, enabling identification of early apoptotic cells by flow cytometry or fluorescence microscopy. When combined with a membrane-impermeant DNA-binding dye (e. g. , propidium iodide), this approach allows discrimination between viable (Annexin V−/dye−), early apoptotic (Annexin V+/dye−), and late apoptotic or necrotic (Annexin V+/dye+) cell populations by assessing membrane integrity and PS exposure.
-
Cell migration
Cell migration is a method that plays an important role in wound healing, cell differentiation, embryonic development, etc.
-
Neural Crest/Neuronal Cell Migration Explant Assay
Neural crest (NC) and neuronal cell migration explant assays are in vitro systems in which neural tube-derived tissues are cultured to allow premigratory or newly emigrated neural crest cells to undergo epithelial-to-mesenchymal transition (EMT), migrate away from the explant, and form a measurable radial outgrowth that reflects migratory capacity and environmental responsiveness. These assays typically quantify migration by measuring the expansion of cell outgrowth from neural tube or neural plate border explants over time, often comparing early and later timepoints to derive a migration index such as a radius ratio, which reflects net cell dispersal from the explant core. Neural tube explant cultures preserve key aspects of neural crest behavior, including EMT, migration, and early differentiation, making them suitable for assessing intrinsic migratory ability and extrinsic cue dependence. However, studies emphasize that migratory outgrowth from neural tube explants may include non-n
-
CCK-8/WST-8 Cell Proliferation Assay
The CCK-8/WST-8 assay is based on the reduction of the water-soluble tetrazolium salt WST-8 to a water-soluble formazan product by cellular dehydrogenases in metabolically active cells, where the generated formazan amount is proportional to the number of living cells and is quantified by measuring absorbance in the visible range, providing a colorimetric readout for cell viability and proliferation assessment. This class of tetrazolium-based assays improves upon earlier MTT-based systems by producing a water-soluble formazan, eliminating the need for organic solubilization steps and enabling direct spectrophotometric measurement in culture medium.
-
Research Protocol for Inflammation-related Diseases
The NLRP3 inflammasome is a cytosolic innate immune signaling platform that integrates priming signals and danger-signal activation to promote caspase-1 activation, maturation of IL-1β and IL-18, and gasdermin D-mediated pyroptotic cell death. The core experimental logic is to determine whether inflammatory disease phenotypes are driven by increased NLRP3 expression, ASC-containing inflammasome assembly, caspase-1 cleavage, GSDMD cleavage, and extracellular release of IL-1β/IL-18 rather than by nonspecific cell injury alone. The pathway is strongly linked to inflammation-related disease phenotypes because monosodium urate crystals activate NALP3/NLRP3 inflammasome signaling in gout-like crystal inflammation, cholesterol crystals activate NLRP3 inflammasomes in atherogenesis models, and DSS-induced intestinal inflammation has been reported to involve NLRP3 inflammasome activity. However, experimental colitis studies also show context-dependent protective effects of NLRP3 inflammasome co
-
Cell Viability Determination by MTT Colorimetric Assay
The following protocol uses the MTT colorimetric assay as a classic literature-established method for assessing cell viability/metabolic activity in cultured mammalian cells. MTT[3-(4,5-dimethylthiazol-2-yl)-2,5-diphenyltetrazolium bromide] is reduced by metabolically active cells to a colored formazan product; the amount of formazan is quantified spectrophotometrically and provides an indirect measure of metabolically active viable cells. Importantly, MTT reduction reflects cellular oxidoreductase/metabolic activity rather than an absolute direct count of living cells, so changes in cellular metabolism can alter the signal independently of cell number.
-
Apoptosis
Apoptosis, also called programmed cell death, is generally characterized by distinct morphological characteristics.
-
TUNEL staining for apoptotic DNA fragmentation
TUNEL staining detects DNA strand breaks by using terminal deoxynucleotidyl transferase to add labeled nucleotides to exposed 3′-OH DNA termini, generating either microscopic staining in fixed cells or tissue sections, or fluorescence/cytometric signal in cell suspensions. TUNEL positivity reflects DNA fragmentation but should not be interpreted alone as definitive apoptosis, because TUNEL can also label necrotic, autolytic, mechanically damaged, or DNA-repair-associated DNA breaks.
-
Cell Cytotoxicity Assay
Cytotoxicity assays are usually based on the assessment of cell membrane damage, which can also be indirectly detected by measuring cell viability. Detection methods include MTT assay, CKK-8 assay, LDH assay and ATP assay, etc.
-
Chemotaxis Gradient Chamber Assay 1
The chemotaxis gradient chamber assay is based on the principle of observing directional cell migration in response to a stable, linear or quasi-linear concentration gradient of a chemoattractant formed between two fluid reservoirs separated by a narrow observation chamber. Cells placed within the chamber respond to the gradient by polarized movement toward higher chemoattractant concentrations, allowing quantification of chemotactic behavior in real time under microscopy. The classic Zigmond chamber design enables simultaneous visualization of gradient formation and individual cell trajectories, making it suitable for studying leukocyte chemotaxis and other motile cell types in vitro.
-
Under-Agarose Cell Migration Assay
The under-agarose cell migration assay is a classical in vitro chemotaxis method designed to evaluate directed cell movement through a semi-solid agarose matrix toward soluble chemoattractant gradients, enabling visualization and quantification of leukocyte or motile cell migration in a confined 2D-like environment. In this system, cells and chemoattractants are placed in separate wells cut into an agarose gel, allowing diffusion-driven gradient formation that guides directional migration, which is typically assessed by measuring migration distance, cell morphology changes, and accumulation toward the chemoattractant source. This assay has been widely used to study neutrophil and leukocyte chemotaxis as a simple alternative to filter-based migration systems and allows direct microscopic observation of migrating cells under near-physiological confinement conditions.
-
Transwell/Boyden Chamber Migration Assay
The Transwell/Boyden chamber migration assay measures cell movement through a porous membrane separating an upper and lower chamber, usually after a chemoattractant gradient is established by placing cells in the upper chamber and chemoattractant-containing medium in the lower chamber. The readout is generated by quantifying cells that traverse the membrane and appear on the lower membrane surface or in the lower chamber, depending on whether the cell type is adherent or non-adherent. This assay reflects chemotactic or haptotactic migration rather than matrix invasion unless an extracellular-matrix barrier is added to the membrane.
-
Apoptosis Solutions
Apoptosis is a regulated, generally non-lytic cell-death pathway that removes unwanted, damaged, infected, or abnormal cells through coordinated morphological changes, caspase activation, DNA fragmentation, and membrane remodeling. The intrinsic apoptosis pathway is controlled mainly by mitochondrial outer membrane permeabilization, BCL-2 family proteins, cytochrome c release, apoptosome formation, caspase-9 activation, and downstream executioner caspase-3/7 activation. The extrinsic apoptosis pathway is initiated by death receptors such as Fas, TNFR, and TRAIL receptors, which recruit adaptor proteins and activate caspase-8 before engaging executioner caspases or mitochondrial amplification through BID cleavage. Apoptosis is linked to many phenotypes, including cancer cell killing, tissue homeostasis, immune regulation, neurodegeneration, infection response, and treatment-induced cytotoxicity; unresolved questions include how apoptosis interacts with necroptosis, pyroptosis, ferroptos
-
3D Collagen/Hydrogel Matrix Migration Assay
The 3D collagen/hydrogel matrix migration assay is based on embedding cells within or on top of a fibrillar collagen type I-rich three-dimensional matrix to model in vivo-like extracellular matrix (ECM) architecture, enabling analysis of cell migration through a physically and biochemically relevant scaffold. In contrast to 2D migration systems, cells in 3D matrices interact with fibrillar collagen networks, requiring coordinated adhesion remodeling and proteolytic or non-proteolytic deformation mechanisms to move through confined spaces, thereby providing a more physiologically relevant readout of invasive and migratory behavior in tissue-like environments. Cell movement in 3D collagen matrices is typically quantified by tracking single-cell trajectories, invasion depth, or matrix penetration over time, reflecting combined effects of cytoskeletal dynamics, cell-ECM adhesion turnover, and ECM remodeling. These systems are widely used to study tumor cell invasion and stromal cell motili
-
Cell invasion
Cell invasion is the ability of cells to migrate from one area to another via the extracellular matrix. Cell invasion is the response of normal and cancer cells to chemical and mechanical stimuli. Before migrating to a new region, the extracellular matrix is degraded by proteases within the cell. Cell invasion often occurs during wound repair, vascularization and inflammation, abnormal tissue invasion, and tumor cell metastasis.
-
MTT Cell Proliferation Assay
The MTT assay is a colorimetric endpoint assay for estimating viable cell number, cell growth, cytotoxicity, or cell activation in cultured mammalian cells. Living cells reduce the yellow tetrazolium salt MTT into purple/blue formazan, while dead cells do not generate the same signal; the resulting color can be quantified with a multiwell spectrophotometer. MTT reduction is commonly interpreted as a readout of metabolic activity that often correlates with viable cell number, but it should not be treated as a direct cell-counting method unless the assay is optimized for the cell type and experimental condition. Studies show that MTT reduction can involve mitochondrial and non-mitochondrial reducing systems, and formazan may accumulate in intracellular lipid droplets rather than simply marking mitochondria.
-
Cell-Exclusion Zone Migration Assay
The Cell-Exclusion Zone (CEZ) migration assay is an in vitro 2D cell migration method in which a defined cell-free area is created using removable physical barriers such as silicone stoppers, allowing cells to be seeded around the barrier and subsequently migrate into the cleared zone after barrier removal. This approach enables quantification of collective cell migration by monitoring repopulation of the initially cell-free region over time using microscopy-based imaging. Compared with scratch-based wound healing assays, barrier-based exclusion methods are designed to avoid mechanical damage to the extracellular matrix and reduce injury-induced effects on boundary cells, thereby improving interpretability of migration behavior in vitro. The assay readout is typically the progressive reduction in the cell-free area or the number of cells invading the exclusion zone, reflecting coordinated cell motility relevant to physiological processes such as wound healing, epithelial repair, and ca
-
Chemotaxis Gradient Chamber Assay 2
Chemotaxis gradient chamber assays measure directional cell migration in response to a soluble chemical gradient by imaging cells as they move across a defined observation region; the readout is generated from time-lapse cell trajectories, displacement toward the gradient, forward migration index, trajectory plots, rose/polar plots, and statistical tests of non-random directionality. The Dunn chamber is a direct-viewing glass chamber in which cells migrate across a bridge between control and chemoattractant wells, allowing observation of cells in a linear concentration gradient; related direct-viewing formats include the Insall chamber, which supports defined unidirectional gradients and high numerical-aperture microscopy, and the μ-Slide Chemotaxis chamber, which supports long-term live-cell imaging and gradient characterization with fluorescent dye.
Purity & Documentation
-
Data Sheet (299 KB)
-
SDS (252 KB)
- English - EN (252 KB)
- Français - FR (252 KB)
- Deutsch - DE (252 KB)
- Norwegian - NO (252 KB)
- Español - ES (252 KB)
- Swedish - SV (252 KB)
- Italian - IT (252 KB)
- Korean - KR (252 KB)
- Portuguese - PT (252 KB)
-
Handling Instructions (2659 KB)
References
[1]. Hassanein EHM, et al. The promising antioxidant effects of lignans: Nrf2 activation comes into view. Naunyn Schmiedebergs Arch Pharmacol. 2024 Sep;397(9):6439-6458. [Content Brief]
[2]. Krithika R, et al. Mechanism of protective effect of phyllanthin against carbon tetrachloride-induced hepatotoxicity and experimental liver fibrosis in mice. Toxicol Mech Methods. 2015;25(9):708-17. [Content Brief]
[3]. Wang H, et al. Phyllanthin inhibits MOLT-4 leukemic cancer cell growth and induces apoptosis through the inhibition of AKT and JNK signaling pathway. J Biochem Mol Toxicol. 2021 Jun;35(6):1-10. [Content Brief]
[4]. Harikrishnan H, et al. Phyllanthin from Phyllanthus amarus inhibits LPS-induced proinflammatory responses in U937 macrophages via downregulation of NF-κB/MAPK/PI3K-Akt signaling pathways. Phytother Res. 2018 Dec;32(12):2510-2519. [Content Brief]
[5]. You Y, et al. Phyllanthin prevents diethylnitrosamine (DEN) induced liver carcinogenesis in rats and induces apoptotic cell death in HepG2 cells. Biomed Pharmacother. 2021 May;137:111335. [Content Brief]
[6]. Ilangkovan M, et al. Phyllanthin from Phyllanthus amarus inhibits cellular and humoral immune responses in Balb/C mice. Phytomedicine. 2016 Nov 15;23(12):1441-1450. [Content Brief]
[7]. Marhaeny HD, et al. Phyllanthin and hypophyllanthin, the isolated compounds of Phyllanthus niruri inhibit protein receptor of corona virus (COVID-19) through in silico approach. J Basic Clin Physiol Pharmacol. 2021 Jun 25;32(4):809-815. [Content Brief]
Complete Stock Solution Preparation Table
Please refer to the solubility information to select the appropriate solvent. Once prepared, please aliquot and store the solution to prevent product inactivation from repeated freeze-thaw cycles.
Storage method and period of stock solution: -80°C, 6 months; -20°C, 1 month (protect from light). When stored at -80°C, please use it within 6 months. When stored at -20°C, please use it within 1 month.
| Optional Solvent | Concentration Solvent Mass | 1 mg | 5 mg | 10 mg | 25 mg |
|---|---|---|---|---|---|
| DMSO | 1 mM | 2.3894 mL | 11.9469 mL | 23.8937 mL | 59.7343 mL |
| 5 mM | 0.4779 mL | 2.3894 mL | 4.7787 mL | 11.9469 mL | |
| 10 mM | 0.2389 mL | 1.1947 mL | 2.3894 mL | 5.9734 mL | |
| 15 mM | 0.1593 mL | 0.7965 mL | 1.5929 mL | 3.9823 mL | |
| 20 mM | 0.1195 mL | 0.5973 mL | 1.1947 mL | 2.9867 mL | |
| 25 mM | 0.0956 mL | 0.4779 mL | 0.9557 mL | 2.3894 mL | |
| 30 mM | 0.0796 mL | 0.3982 mL | 0.7965 mL | 1.9911 mL | |
| 40 mM | 0.0597 mL | 0.2987 mL | 0.5973 mL | 1.4934 mL | |
| 50 mM | 0.0478 mL | 0.2389 mL | 0.4779 mL | 1.1947 mL | |
| 60 mM | 0.0398 mL | 0.1991 mL | 0.3982 mL | 0.9956 mL | |
| 80 mM | 0.0299 mL | 0.1493 mL | 0.2987 mL | 0.7467 mL | |
| 100 mM | 0.0239 mL | 0.1195 mL | 0.2389 mL | 0.5973 mL |