



dBRD 9-A

Based on 1 Customer Validation
dBRD 9-A is a selective BRD9 PROTAC degrader. dBRD 9-A induces near complete BRD9 degradation dependent on E3 ubiquitin ligase CRBN and BRD9 bromodomain engagement, and drives loss of BRD9 chromatin binding genome-wide. dBRD 9-A downregulates oncogenic SS18-SSX-driven transcriptional programs, super enhancer-associated gene expression, and SS18-SSX1 super enhancer binding, and depletes GBAF complex members GLTSCR1/1L from SS18-SSX complexes. dBRD 9-A induces cell cycle arrest and increases apoptosis in synovial sarcoma cells. dBRD 9-A can be used for the research of synovial sarcoma.
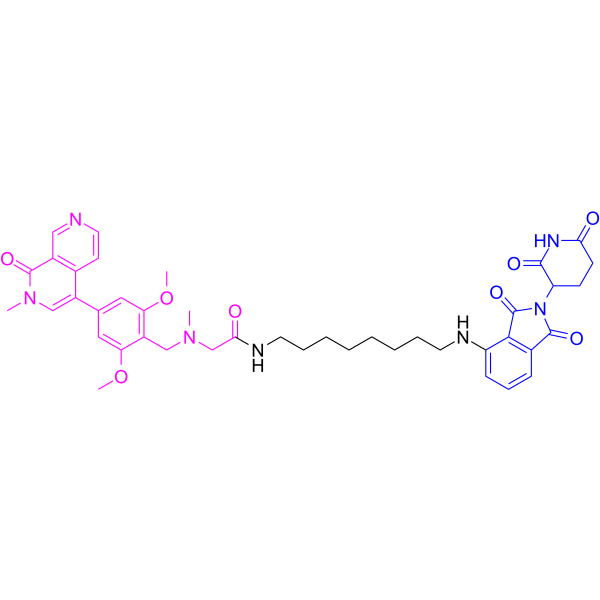
(Pink: BRD9 ligand (HY-107446); Blue: Cereblon ligand (HY-14658); Black: linker).
Nur für Forschungszwecke. Wir verkaufen nicht an Patienten.
- Reinheit : 99.07%
- CAS. Nr.: 2170679-42-0
- Formel: C42H49N7O8
- Molecular Weight:779.88
-
Speicherung:Powder -20°C, 3 years ; In solvent -80°C, 6 months , -20°C, 1 month

To place orders, for customer services and technical support, please contact: MedChemExpress USA
Tel: 609-228-6898 E-mail: [email protected] [email protected]


-
 Biologische Aktivität
-
Chemical Information
-
Lösungsmittel & Löslichkeit
- Protokoll
- Reinheit & Dokumentation
- Verweise
-
 Help & FAQs


Alle PROTACs Isoform-spezifische Produkte anzeigen
More

Biologische Aktivität
Beschreibung
IC50 & Target
[1]|
BRD9 |
In Vitro
dBRD9-A (100 nM; 6-72 h) induces near complete degradation of BRD9 in HSSYII and SYO1 synovial sarcoma cells[1].
dBRD9-A (100 nM; 24 h) leads to a near-complete loss of BRD9 chromatin binding genome-wide in HSSYII synovial sarcoma cells[1].
dBRD9-A (100 nM; 3-9 days) induces a progressive cell cycle arrest characterized by accumulation of G1/G0 phase cells and reduction of S phase cells in HSSYII and SYO1 synovial sarcoma cells[1].
dBRD9-A (100 nM; 3-9 days) induces a progressive increase in apoptotic cells in HSSYII and SYO1 synovial sarcoma cells[1].
dBRD9-A (100 nM; 6 h) primarily induces downregulation of gene expression, with preferential downregulation of genes associated with super enhancers in HSSYII synovial sarcoma cells[1].
MedChemExpress (MCE) has not independently confirmed the accuracy of these methods. They are for reference only.
-
Cell Line:HSSYII, SYO1
-
Concentration:100 nM
-
Incubation Time:6 h, 12 h, 24 h, 48 h, 72 h
-
Result:Elicited near complete BRD9 degradation across all tested time points in both HSSYII and SYO1 cell lines.
-
Cell Line:HSSYII, SYO1
-
Concentration:100 nM
-
Incubation Time:3 days,6 days,9 days
-
Result:Induced a progressive cell cycle arrest, with increases in G1/G0 phase cells and decreases in S phase cells over time in both cell lines.
-
Cell Line:HSSYII, SYO1
-
Concentration:100 nM
-
Incubation Time:3 days,6 days,9 days
-
Result:Resulted in a progressive increase in Annexin-V positive (apoptotic) cells over time in both cell lines.
In Vivo
MedChemExpress (MCE) has not independently confirmed the accuracy of these methods. They are for reference only.
-
Animal Model:BALB/c (Foxn1nu) (female, 4-6 weeks old, subcutaneous xenograft model) injected with synovial sarcoma cells[1]
-
Dosage:50 mg/kg
-
Administration:i.p.; once daily; 24 days
-
Result:Inhibited tumor progression over 24 days, with a significant difference in tumor volume compared to vehicle control.
Confirmed near-complete degradation of BRD9 in tumor tissue via western blotting.
Retained normal body weight and blood counts, with no overt treatment-related side effects.
- RT-PCR
- RNA extraction experimental
- Detection of Apoptosis
- TUNEL staining for apoptotic DNA fragmentation
- Flow cytometric DNA-content cell-cycle staining
- Annexin V plus membrane-impermeant dye apoptosis staining
- BrdU Incorporation Assay
- Apoptosis Solutions
- Protocol for Cell Cycle
- Real Time qPCR (Q-PCR)


Chemical Information
-
CAS. Nr. 2170679-42-0
-
Appearance Solid
-
Molecular Weight 779.88
-
Formel C42H49N7O8
-
Color Light yellow to yellow
-
SMILES
O=C1C2=C(C(C3=CC(OC)=C(CN(CC(NCCCCCCCCNC4=CC=CC(C(N5C6C(NC(CC6)=O)=O)=O)=C4C5=O)=O)C)C(OC)=C3)=CN1C)C=CN=C2
-
Versand
Room temperature in continental US; may vary elsewhere.
-
Speicherung
Powder -20°C 3 years In solvent -80°C 6 months -20°C 1 month


Lösungsmittel & Löslichkeit
In Vitro:
DMSO : 100 mg/mL (128.22 mM; Need ultrasonic; Hygroscopic DMSO has a significant impact on the solubility of product, please use newly opened DMSO)
Please refer to the solubility information to select the appropriate solvent. Once prepared, please aliquot and store the solution to prevent product inactivation from repeated freeze-thaw cycles.
Storage method and period of stock solution: -80°C, 6 months; -20°C, 1 month. When stored at -80°C, please use it within 6 months. When stored at -20°C, please use it within 1 month.
Please refer to the solubility information to select the appropriate solvent. Once prepared, please aliquot and store the solution to prevent product inactivation from repeated freeze-thaw cycles.
Storage method and period of stock solution: -80°C, 6 months; -20°C, 1 month. When stored at -80°C, please use it within 6 months. When stored at -20°C, please use it within 1 month.
Konzentration (Stammlösung) × Volumen (Stammlösung) = Konzentration (Ziellösung) × Volumen (Ziellösung)


Reinheit & Dokumentation
-
Data Sheet (273 KB)
-
SDS (252 KB)
- English - EN (252 KB)
- Français - FR (252 KB)
- Deutsch - DE (252 KB)
- Norwegian - NO (252 KB)
- Español - ES (252 KB)
- Swedish - SV (252 KB)
- Italian - IT (252 KB)
- Korean - KR (252 KB)
- Portuguese - PT (252 KB)
-
Handling Instructions (2659 KB)
Verweise


Complete Stock Solution Preparation Table
Please refer to the solubility information to select the appropriate solvent. Once prepared, please aliquot and store the solution to prevent product inactivation from repeated freeze-thaw cycles.
Storage method and period of stock solution: -80°C, 6 months; -20°C, 1 month. When stored at -80°C, please use it within 6 months. When stored at -20°C, please use it within 1 month.
| Optional Solvent | Concentration Solvent Mass | 1 mg | 5 mg | 10 mg | 25 mg |
|---|---|---|---|---|---|
| DMSO | 1 mM | 1.2822 mL | 6.4112 mL | 12.8225 mL | 32.0562 mL |
| 5 mM | 0.2564 mL | 1.2822 mL | 2.5645 mL | 6.4112 mL | |
| 10 mM | 0.1282 mL | 0.6411 mL | 1.2822 mL | 3.2056 mL | |
| 15 mM | 0.0855 mL | 0.4274 mL | 0.8548 mL | 2.1371 mL | |
| 20 mM | 0.0641 mL | 0.3206 mL | 0.6411 mL | 1.6028 mL | |
| 25 mM | 0.0513 mL | 0.2564 mL | 0.5129 mL | 1.2822 mL | |
| 30 mM | 0.0427 mL | 0.2137 mL | 0.4274 mL | 1.0685 mL | |
| 40 mM | 0.0321 mL | 0.1603 mL | 0.3206 mL | 0.8014 mL | |
| 50 mM | 0.0256 mL | 0.1282 mL | 0.2564 mL | 0.6411 mL | |
| 60 mM | 0.0214 mL | 0.1069 mL | 0.2137 mL | 0.5343 mL | |
| 80 mM | 0.0160 mL | 0.0801 mL | 0.1603 mL | 0.4007 mL | |
| 100 mM | 0.0128 mL | 0.0641 mL | 0.1282 mL | 0.3206 mL |


dBRD 9-A Related Classifications
HY-148739 Related Classifications
 Powered by Bioz