



PROTAC MDM2 Degrader-8
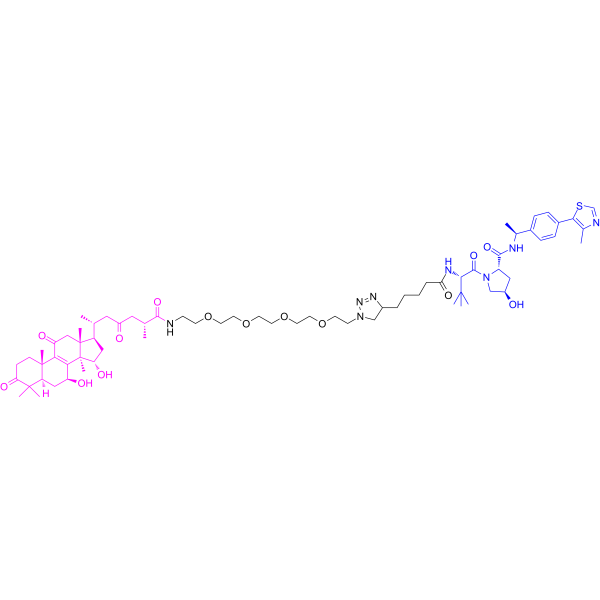
PROTAC MDM2 Degrader-8 is a PROTAC degrader that induces the degradation of the MDM2 protein by recruiting VHL. PROTAC MDM2 Degrader-8 directly binds to MDM2 with a KD of 38.2 μM; the proteasome inhibitor MG-132 (HY-13259) reverses this degradation effect, supporting that it induces MDM2 degradation via the ubiquitin-proteasome system. PROTAC MDM2 Degrader-8 also upregulates p21, induces apoptosis and cell cycle arrest, and inhibits the migration of MDA-MB-231 cells. PROTAC MDM2 Degrader-8 can be used in studies related to MDM2-targeted protein degradation and triple-negative breast cancer.
(Pink: MDM-2/p53 and MDM-2 ligand (HY-N1447); Blue: VHL ligand (HY-112078); Black: linker).
Nur für Forschungszwecke. Wir verkaufen nicht an Patienten.
- Formel: C70H106N8O14S
- Molecular Weight:1315.70
-
Speicherung:
Please store the product under the recommended conditions in the Certificate of Analysis.

To place orders, for customer services and technical support, please contact: MedChemExpress USA
Tel: 609-228-6898 E-mail: [email protected] [email protected]


-
 Biologische Aktivität
-
Chemical Information
- Protokoll
- Reinheit & Dokumentation
- Verweise
-
 Help & FAQs


Alle PROTACs Isoform-spezifische Produkte anzeigen
More

Biologische Aktivität
Beschreibung
IC50 & Target
[1]|
MDM2 38.2 μM (Kd) |
In Vitro
The cell viability of PROTAC MDM2 Degrader-8 (compound V10) (100 μM) in MCF-7, MDA-MB-231, SJSA-1, HepG2, and HT-22 cells is 30.6%, 16.9%, 61.3%, 92.9%, and 91.3% of that in the control group, respectively; among these, the proliferation inhibition rate in MDA-MB-231 cells is 83.1%[1].
PROTAC MDM2 Degrader-8 (20-80 μM; 48 h) reduces MDM2 protein levels in a concentration-dependent manner in p53-mutant MDA-MB-231 cells, with a maximum MDM2 degradation rate of 51% at 80 μM[1].
PROTAC MDM2 Degrader-8 (20-80 μM; 48 h) reduces the BCL-2/BAX ratio in MDA-MB-231 cells[1].
PROTAC MDM2 Degrader-8 (20-80 μM; 48 h) inhibits the migration of MDA-MB-231 cells; at 80 μM, the migration inhibition rates at 24 h and 48 h are 55% and 69%, respectively[1].
PROTAC MDM2 Degrader-8 (20-80 μM; 48 h) upregulates p21 protein levels concomitant with the reduction of MDM2 in MDA-MB-231 cells[1].
PROTAC MDM2 Degrader-8 (20-80 μM; 48 h) upregulates p21 mRNA and reduces Cyclin B1 protein expression in MDA-MB-231 cells[1].
PROTAC MDM2 Degrader-8 (80 μM; 48 h) increases the proportion of cells in the G1 and G2 phases while decreasing the proportion of cells in the S phase in MDA-MB-231 cells, which manifests as G1-S and G2-M cell cycle arrest[1].
PROTAC MDM2 Degrader-8 (20-80 μM; 48 h) increases p21 signaling in MDA-MB-231 cells in immunofluorescence assays[1].
MDM2 degradation induced by PROTAC MDM2 Degrader-8 (80 μM; 48 h) is reversed by MG-132 (30 μM; 2 h pre-exposure), while equivalent concentrations of GAA or VHL ligand alone fail to reduce MDM2 protein levels, supporting the necessity of intact PROTAC structure and the proteasome for MDM2 degradation[1].
PROTAC MDM2 Degrader-8 (3.13-100 μM; MDM2 protein 50 μg/mL; binding 400 s; dissociation 60 s) directly binds to MDM2 in SPR assays, with a KD of 38.2 μM[1].
PROTAC MDM2 Degrader-8 (30 min) enhances the thermal stability of MDM2 in CETSA, further supporting target engagement of MDM2 in cell-derived systems[1].
PROTAC MDM2 Degrader-8 (20-80 μM; 48 h) reduces MDM2 signaling in MDA-MB-231 cells in immunofluorescence assays[1].
PROTAC MDM2 Degrader-8 (20-80 μM; 48 h) induces apoptosis in MDA-MB-231 cells, with the apoptosis rate reaching 48.39% at 80 μM[1].
MedChemExpress (MCE) has not independently confirmed the accuracy of these methods. They are for reference only. Further protocols information, click here.
-
Cell Line:MDA-MB-231 human triple-negative breast cancer cells
-
Concentration:V10: 80 μM; GAA: 80 μM; VHL ligand: 80 μM; MG-132: 30 μM
-
Incubation Time:48 h; 2 h (MG-132 pre-treatment)
-
Result:Decreased MDM2 protein levels.
GAA alone did not decrease MDM2 protein levels.
The VHL ligand alone did not decrease MDM2 protein levels.
MG-132 reversed MDM2 degradation.
-
Cell Line:MDA-MB-231 human triple-negative breast cancer cells
-
Concentration:20, 40, 80 μM
-
Incubation Time:48 h
-
Result:Decreased MDM2 protein levels in a concentration-dependent manner.
Reached 51% MDM2 degradation at 80 μM.
Increased p21 protein levels.
Decreased the BCL-2/BAX ratio.
Decreased Cyclin B1 protein expression.
-
Cell Line:MDA-MB-231 human triple-negative breast cancer cells
-
Concentration:20, 40, 80 μM
-
Incubation Time:48 h
-
Result:Increased apoptosis.
Produced an apoptotic rate of 48.39% at 80 μM.
-
Cell Line:MDA-MB-231 human triple-negative breast cancer cells
-
Concentration:20, 40, 80 μM
-
Incubation Time:24 h, 48 h
-
Result:Inhibited migration by 55% at 24 h at 80 μM.
Inhibited migration by 69% at 48 h at 80 μM.
-
Cell Line:MDA-MB-231 human triple-negative breast cancer cells
-
Concentration:20, 40, 80 μM
-
Incubation Time:48 h
-
Result:Increased the G1-phase population at 80 μM.
Decreased the S-phase population at 80 μM.
Increased the G2-phase population at 80 μM.
Produced G1-S and G2-M cell-cycle arrest.
-
Cell Line:MDA-MB-231 human triple-negative breast cancer cells
-
Concentration:20, 40, 80 μM
-
Incubation Time:48 h
-
Result:Increased p21 mRNA expression.
In Vivo
PROTAC MDM2 Degrader-8 (12.5-50 μg/mL; aqueous solution exposure; 2 days) produces tumor growth inhibition rates of 16.8%, 23.4%, and 27.2%, respectively, in the MDA-MB-231 TNBC xenograft zebrafish model; the inhibition rate of the 15 μg/mL Cisplatin (HY-17394) positive control group is 33.2%[1].
MedChemExpress (MCE) has not independently confirmed the accuracy of these methods. They are for reference only.
-
Animal Model:3-dpf zebrafish[1]
-
Dosage:6.25 μg/mL, 12.5 μg/mL, 25 μg/mL, 50 μg/mL, 100 μg/mL
-
Administration:waterborne; continuous; 2 day exposure
-
Result:Caused no mortality at 6.25, 12.5, 25, or 50 μg/mL.
Produced no apparent toxic phenotype at 6.25-50 μg/mL.
Caused 4 deaths among 30 zebrafish at 100 μg/mL.
Produced a mortality rate of 13% at 100 μg/mL.
Established an MTC of 50 μg/mL.
-
Animal Model:2-dpf zebrafish; approximately 200 CM-DiI-labeled MDA-MB-231 cells microinjected into the yolk sac; model selected at 3 dpf[1]
-
Dosage:12.5, 25, 50 μg/mL
-
Administration:waterborne; continuous; 2 day exposure
-
Result:Inhibited xenograft tumor growth by 16.8% at 12.5 μg/mL.
Inhibited xenograft tumor growth by 23.4% at 25 μg/mL.
Inhibited xenograft tumor growth by 27.2% at 50 μg/mL.
The 15 μg/mL cisplatin positive-control group produced 33.2% inhibition.


Chemical Information
-
Molecular Weight 1315.70
-
Formel C70H106N8O14S
-
SMILES
O=C1C[C@@]2(C)[C@]([C@@H](O)C[C@@H]2[C@H](C)CC(C[C@@H](C)C(NCCOCCOCCOCCOCCN3CC(CCCCC(N[C@@H](C(C)(C)C)C(N4C[C@H](O)C[C@H]4C(N[C@@H](C)C5=CC=C(C6=C(C)N=CS6)C=C5)=O)=O)=O)N=N3)=O)=O)(C)C7=C1[C@]8(C)[C@](C[C@@H]7O)([H])C(C)(C)C(CC8)=O
-
Versand
Room temperature in continental US; may vary elsewhere.
-
Speicherung
Please store the product under the recommended conditions in the Certificate of Analysis.

Protokoll
-
Apoptosis
Apoptosis, also called programmed cell death, is generally characterized by distinct morphological characteristics.
-
TUNEL staining for apoptotic DNA fragmentation
TUNEL staining detects DNA strand breaks by using terminal deoxynucleotidyl transferase to add labeled nucleotides to exposed 3′-OH DNA termini, generating either microscopic staining in fixed cells or tissue sections, or fluorescence/cytometric signal in cell suspensions. TUNEL positivity reflects DNA fragmentation but should not be interpreted alone as definitive apoptosis, because TUNEL can also label necrotic, autolytic, mechanically damaged, or DNA-repair-associated DNA breaks.
-
Flow cytometric DNA-content cell-cycle staining
Flow cytometric DNA-content cell-cycle staining measures the fluorescence intensity of DNA-bound fluorochromes in single cells or nuclei to estimate DNA content distributions, allowing assignment of populations to G0/G1, S, and G2/M phases by DNA histogram deconvolution. Propidium iodide (PI) intercalates into DNA, and PI fluorescence is proportional to cellular DNA content when staining is performed under conditions that make DNA accessible and minimize non-DNA signal. Cells with G2/M DNA content are expected to show approximately twice the fluorescence intensity of G0/G1 cells, while S-phase cells occupy intermediate fluorescence values. PI-based DNA-content analysis can also detect cells with fractional DNA content, often reported as sub-G1, when DNA fragmentation and extraction during staining reduce retained DNA signal in apoptotic cells. DAPI is an alternative DNA fluorochrome for univariate DNA-content analysis, while bivariate approaches combining DNA content with proliferation
-
Annexin V plus membrane-impermeant dye apoptosis staining
Annexin V-based apoptosis assays rely on the detection of phosphatidylserine (PS) externalization from the inner leaflet of the plasma membrane to the outer leaflet, an early biochemical hallmark of apoptosis. Fluorescently labeled Annexin V binds PS in a calcium-dependent manner, enabling identification of early apoptotic cells by flow cytometry or fluorescence microscopy. When combined with a membrane-impermeant DNA-binding dye (e. g. , propidium iodide), this approach allows discrimination between viable (Annexin V−/dye−), early apoptotic (Annexin V+/dye−), and late apoptotic or necrotic (Annexin V+/dye+) cell populations by assessing membrane integrity and PS exposure.
-
BrdU Incorporation Assay
Bromodeoxyuridine (BrdU) incorporation assay is based on the principle that BrdU, a thymidine analog, is incorporated into newly synthesized DNA during the S phase of the cell cycle, thereby serving as a marker of DNA replication and cellular proliferation. Incorporated BrdU can be detected using anti-BrdU antibodies following DNA denaturation, enabling visualization or quantification of proliferating cells through immunochemical detection methods such as immunofluorescence or immunohistochemistry.
-
Cell migration
Cell migration is a method that plays an important role in wound healing, cell differentiation, embryonic development, etc.
-
Apoptosis Solutions
Apoptosis is a regulated, generally non-lytic cell-death pathway that removes unwanted, damaged, infected, or abnormal cells through coordinated morphological changes, caspase activation, DNA fragmentation, and membrane remodeling. The intrinsic apoptosis pathway is controlled mainly by mitochondrial outer membrane permeabilization, BCL-2 family proteins, cytochrome c release, apoptosome formation, caspase-9 activation, and downstream executioner caspase-3/7 activation. The extrinsic apoptosis pathway is initiated by death receptors such as Fas, TNFR, and TRAIL receptors, which recruit adaptor proteins and activate caspase-8 before engaging executioner caspases or mitochondrial amplification through BID cleavage. Apoptosis is linked to many phenotypes, including cancer cell killing, tissue homeostasis, immune regulation, neurodegeneration, infection response, and treatment-induced cytotoxicity; unresolved questions include how apoptosis interacts with necroptosis, pyroptosis, ferroptos
-
Protocol for Cell Cycle
Cell-cycle analysis by flow cytometry measures DNA content in single cells to estimate the fraction of cells in G0/G1, S, and G2/M phases. Propidium iodide intercalates into DNA, and after RNA removal with RNase, fluorescence intensity reflects cellular DNA content: 2N cells are assigned to G0/G1, cells between 2N and 4N to S phase, and 4N cells to G2/M. DNA-content analysis alone cannot reliably separate G0 from G1 or G2 from M. Ki-67 can distinguish quiescent G0 cells from cycling cells, EdU or BrdU incorporation marks active DNA synthesis in S phase, and phospho-histone H3 staining identifies mitotic cells within the 4N population.
-
Breast Cancer Modeling
Breast cancer is a heterogeneous cancer, and it has been distinguished into four subtypes: luminal A, luminal B, HER2-positive and basal-like. Molecular mutations, epigenetic alterations, hormone exposure and immune microenvironment are related to the progression of breast cancer.


Reinheit & Dokumentation
Verweise

Calculators
Konzentration (Stammlösung) × Volumen (Stammlösung) = Konzentration (Ziellösung) × Volumen (Ziellösung)


PROTAC MDM2 Degrader-8 Related Classifications
HY-162450 Related Classifications
 Powered by Bioz