



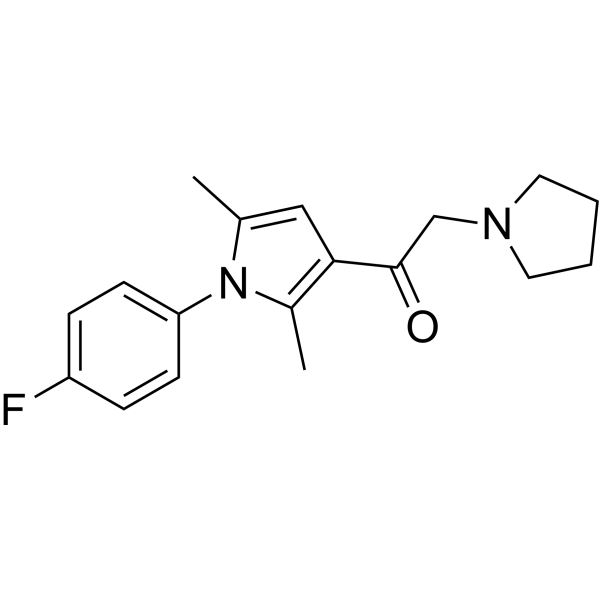
IU1
Based on 26 publication(s) in Google Scholar
IU1 is a selective, reversible USP14 inhibitor with an IC50 of 4-5 μM. IU1 binds USP14’s catalytic cleft to block deubiquitinase activity. IU1 induces calpain-dependent Tau cleavage, causes ATP deficits, reduces E1~Ub thioester levels and 26S proteasome assembly. IU1 enhances 26S proteasome chymotrypsin-like activity, modulates LC3B-dependent autophagy flux, reduces cancer cell proliferation and migration, and blocks G0/G1 to S phase cell cycle transition in follicular thyroid cancer cells. IU1 activates autophagy-lysosomal and ubiquitin-proteasome pathways, triggers apoptosis, and reduces cervical cancer cell growth. IU1 enhances degradation of proteasome substrates linked to neurodegenerative disease, accelerates oxidized protein degradation, and increases oxidative stress resistance. IU1 can be used for the research of Alzheimer’s disease, follicular thyroid cancer, ischemic stroke, cervical cancer, and neurodegenerative disease.
Para uso exclusivo en investigación. No vendemos a pacientes.
- Pureza : 99.30%
- No. CAS: 314245-33-5
- Fòrmula: C18H21FN2O
- Peso molecular:300.37
-
Almacenamiento:Powder -20°C, 3 years , 4°C, 2 years ; In solvent -80°C, 6 months , -20°C, 1 month

To place orders, for customer services and technical support, please contact: MedChemExpress USA
Tel: 609-228-6898 E-mail: [email protected] [email protected]


-
 Actividad biológica
-
Chemical Information
-
Solvente y solubilidad
- Protocolo
- Pureza y Documentación
- Referencias
-
 Help & FAQs


-
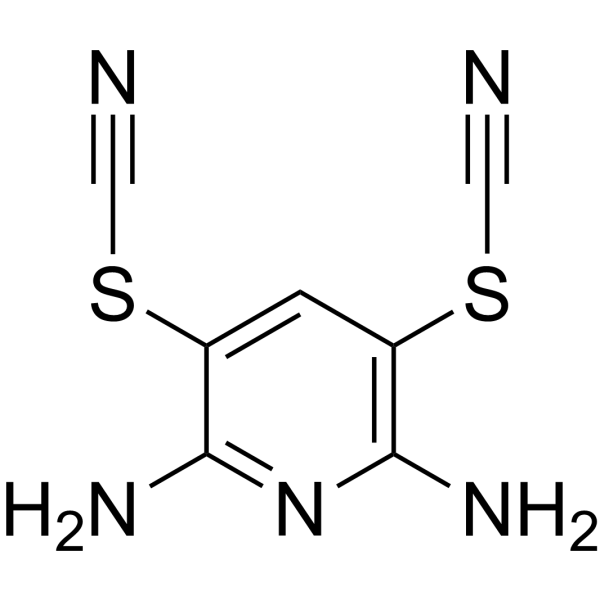
HY-13814
PR-619DUB Inhibitor -
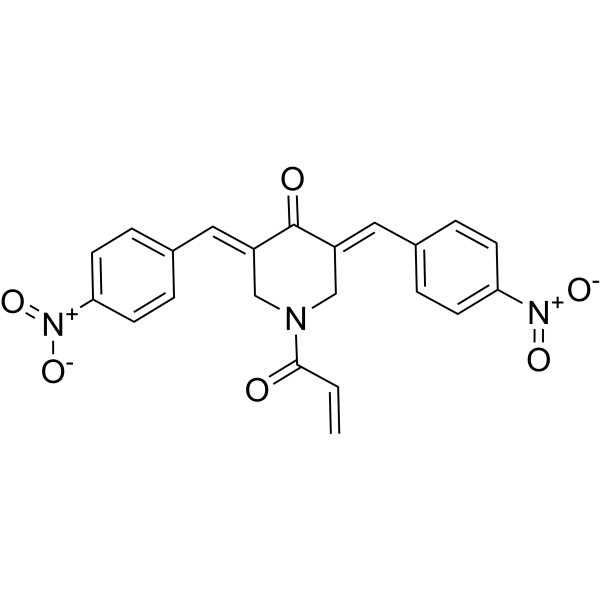
HY-13989
b-AP15UCHL5/Usp14 Inhibitor -
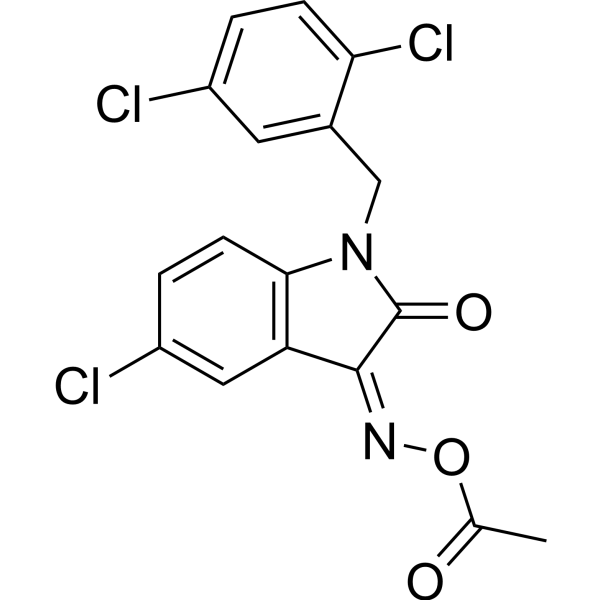
HY-18637
LDN-57444Deubiquitinase Inhibitor -
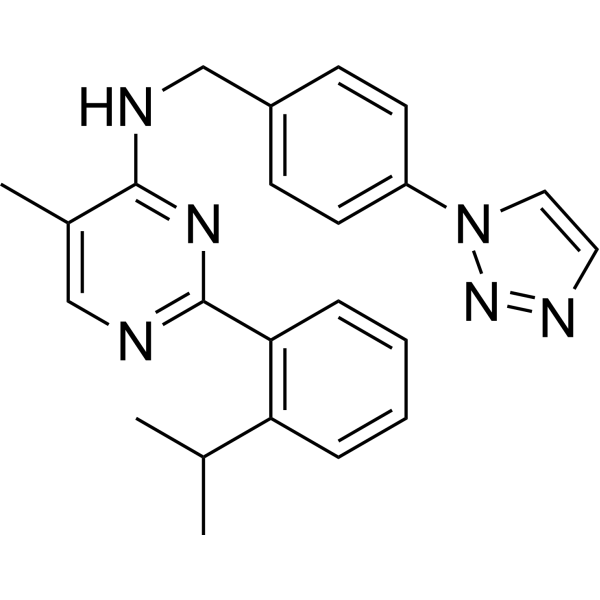
HY-17543
ML-323USP1-UAF1 Inhibitor -
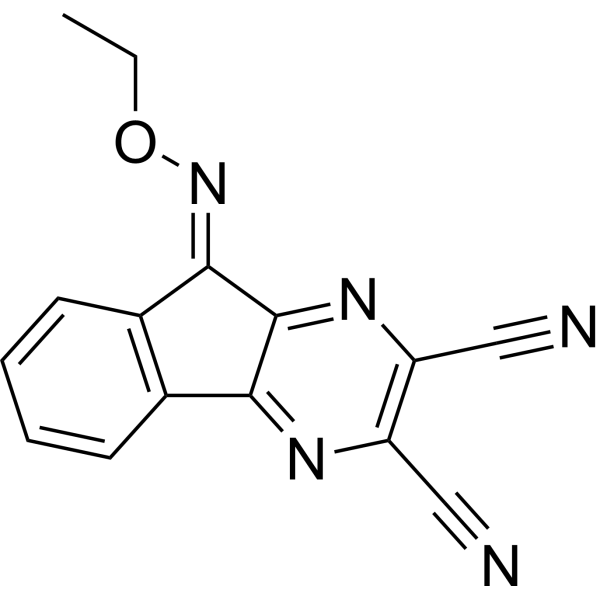
HY-50737A
DUB-IN-2Deubiquitinase Inhibitor -
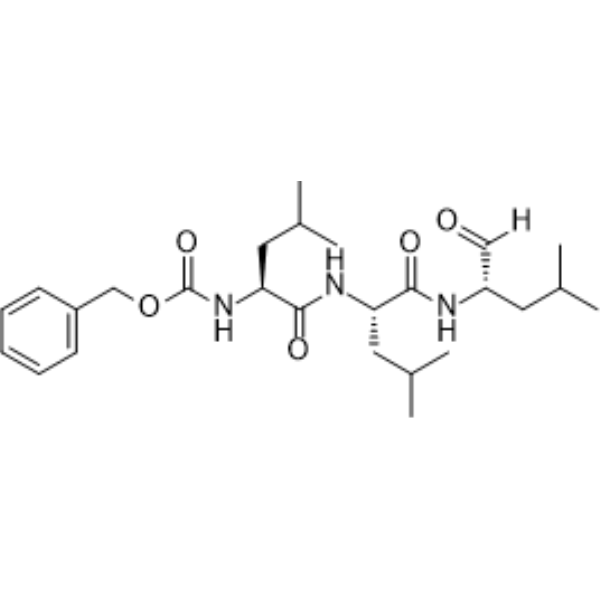
HY-13259
MG-132Proteasome Inhibitor -
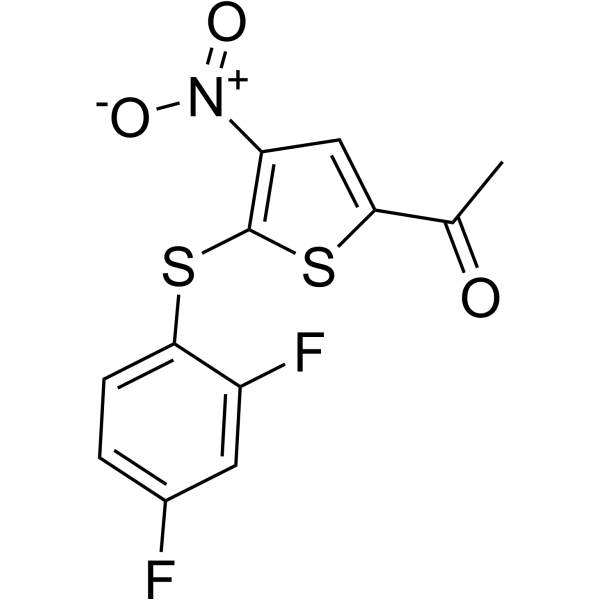
HY-13865
P 22077USP7/47 Inhibitor -
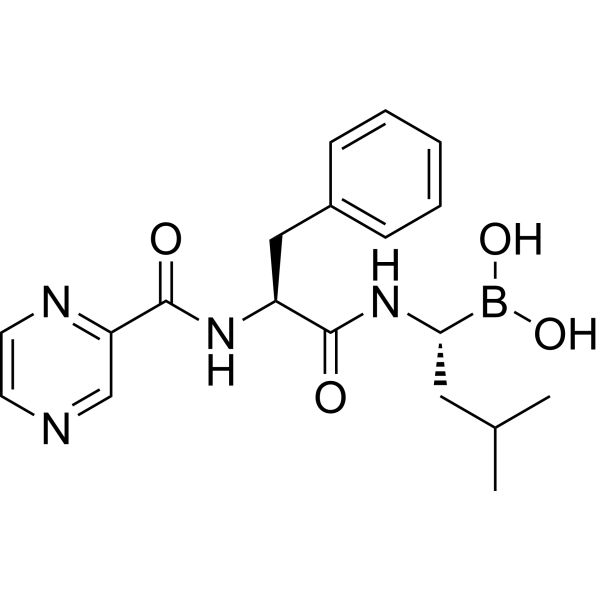
HY-10227
BortezomibProteasome Inhibitor -
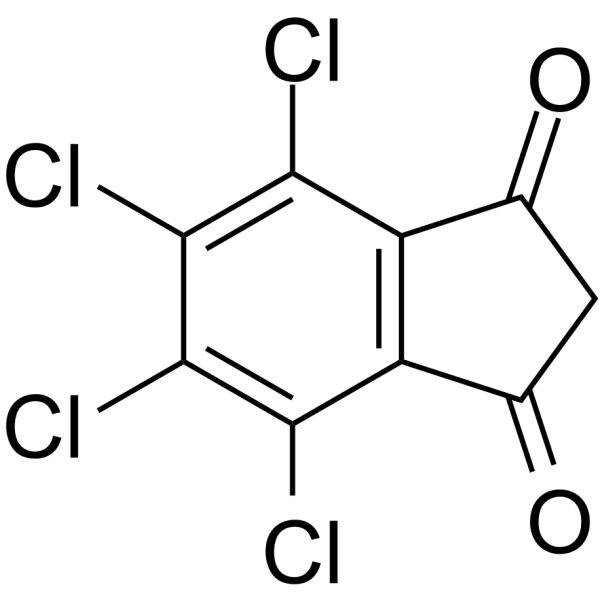
HY-18638
TCIDUCH-L3 Inhibitor -
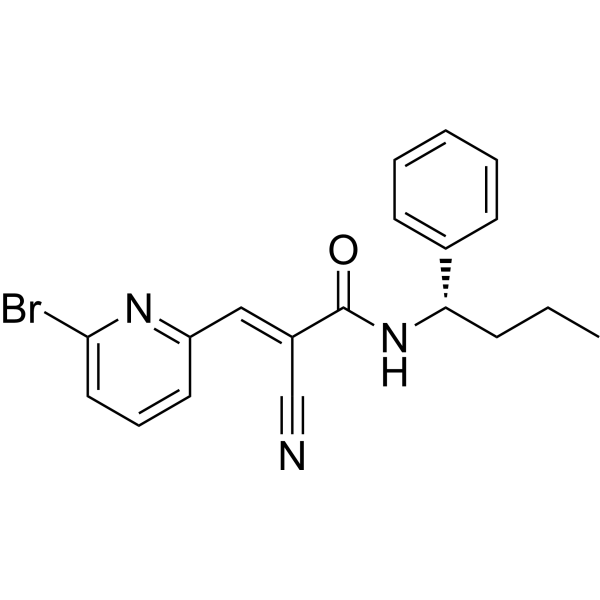
HY-13264
DegrasynDeubiquitinase Inhibitor -
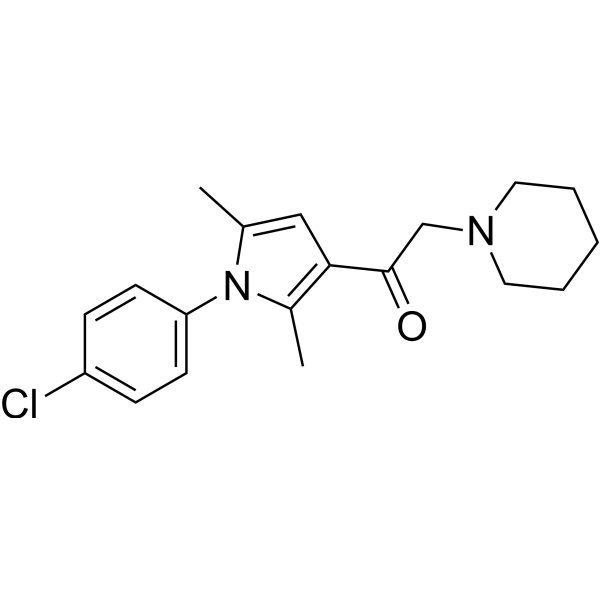
HY-122243
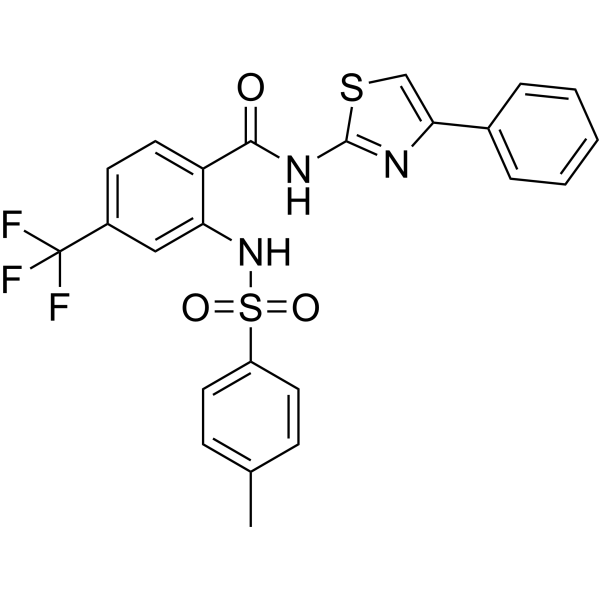
IU1-47USP14 Inhibitor -
HY-100900
ML364USP2 Inhibitor
Publications Citing Use of MedChemExpress (MCE) IU1
More- Cancer Cell. 2026 Feb 9;44(2):306-320.e7. [Abstract]
- Nat Commun. 2025 May 16;16(1):4564. [Abstract]
- Nat Commun. 2022 Mar 31;13(1):1700. [Abstract]
- Redox Biol. 2026 May:92:104086. [Abstract]
- Adv Sci (Weinh). 2026 Jan 4:e16588. [Abstract]
- Sci Adv. 2025 Apr 11;11(15):eadt6159. [Abstract]
- Cell Death Differ. 2023 Jan;30(1):1-15. [Abstract]
- Cell Death Dis. 2025 Oct 21;16(1):737. [Abstract]
- Pharmacol Res. 2021 Dec:174:105933. [Abstract]
- J Immunother Cancer. 2026 Jan 14;14(1):e013498. [Abstract]
- J Transl Med. 2024 Sep 11;22(1):834. [Abstract]
- Int J Biol Macromol. 2024 Apr 15;267(Pt 2):131645. [Abstract]
- EMBO J. 2022 Aug 16;41(16):e108791. [Abstract]
- Respir Res. 2025 Jul 2;26(1):229. [Abstract]
- Sci Rep. 2025 Dec 9;15(1):43741. [Abstract]
- iScience. 2026 Mar 13;29(5):115362. [Abstract]
- Microbiol Spectr. 2025 Aug 5;13(8):e0018825. [Abstract]
- Neurotoxicology. 2025 Jul:109:1-10. [Abstract]
- Anim Cells Syst. 2023 Nov 27.
- Front Oncol. 2021 Feb 23;11:615568. [Abstract]
- Food Chem Toxicol. 2025 Mar:197:115281. [Abstract]
- Clin Transl Oncol. 2025 Aug;27(8):3485-3500. [Abstract]
- Eur J Histochem. 2024 Sep 9;68(3):4101. [Abstract]
- J Biosciences. 46, 19 (2021).
- Cell Press Blue. 2026 Jul 3.
- Res Sq. 2025 May 06.
 Customer Validation & Images

-
WB
-
Cell Proliferation/Viability Assay
-
Cell Migration/Invasion Assay
-
In Vivo Efficacy Study
-
Histological Imaging/Staining


Actividad biológica
Descripciòn
IC50 & Target
[1]|
USP14 4-5 μM (IC50) |
In Vitro
IU1 (75 μM; 6-22 h) reduces Prostaglandin J2 (PGJ2) (HY-113366)-induced ubiquitinated protein accumulation, induces calpain-dependent cleavage of Tau, α-spectrin, and pro-caspase 3, and does not alter basal ubiquitinated protein levels in rat embryonic (E18) cerebral cortical neuronal cultures[1].
IU1 (5-50 μM; 4-24 h) is neurotoxic in a concentration-dependent and time-dependent manner, with 5 μM IU1 causing significant viability loss after 24 h, and 25 μM IU1 inducing toxicity as early as 4 h[1].
IU1 (5-80 μM; 4-24 h) reduces intracellular ATP levels in a concentration-dependent manner (significant at ≥25 μM after 24 h) and time-dependent manner (significant at 25 μM after 24 h)[1].
IU1 directly inhibits mitochondrial Complex I activity with an IC50 of ~40 μM for NADH:Q1 reductase activity, has minimal effects on Complex II, and increases Complex IV activity at high concentrations, without altering ATP synthase function in permeabilized rat brain mitochondrial membranes[1].
IU1 (5-50 μM; 16 h) abolishes basal E1-Ub thioester levels, reduces PGJ2-induced ubiquitinated protein accumulation, and significantly reduces total E1 protein levels when co-treated with PGJ2; IU1 concentrations ≤25 μM have minimal effects on E1-Ub thioester, E1 protein, and ubiquitinated protein levels in rat embryonic (E18) cerebral cortical neuronal cultures[1].
IU1 (5-50 μM; 24 h) induces a concentration-dependent decline in 26S proteasome assembly and activity, with a concomitant increase in 20S proteasome activity and levels, with 50 μM IU1 causing the most pronounced effects in rat embryonic (E18) cerebral cortical neuronal cultures[1].
IU1 (1-100 μM; 24 h) dose-dependently reduces the viability of ML1 follicular thyroid cancer cells, with significant effects observed at 30, 50, and 100 μM, while having minimal impact on primary human thyroid cell viability[2].
IU1 (20 μM; 6 h) significantly reduces basal migration of both ML1 follicular thyroid cancer cells and primary human thyroid cells, and abolishes S1P-stimulated migration in ML1 cells[2].
IU1 (20-50 μM; 24 h) increases the chymotrypsin-like activity of 26S proteasomes in ML1 follicular thyroid cancer cells, with 20 μM inducing a stronger significant effect[2].
IU1 (50 μM; 24 h) significantly inhibits the catalytic activity of USP14 in ML1 follicular thyroid cancer cells, while 20 μM IU1 has no significant effect on USP14 catalytic activity[2].
IU1 (20 μM; 24 h) enhances LC3B-dependent autophagy flux in ML1 follicular thyroid cancer cells while reducing LC3B-dependent autophagy flux in primary human thyroid cells when co-treated with 100 μM CQ for 4 h[2].
IU1 (20 μM; 24 h) does not alter SQSTM1/p62 protein expression in ML1 follicular thyroid cancer cells or primary human thyroid cells, either alone or in combination with 100 μM CQ[2].
IU1 (20 μM; 6 h) significantly reduces basal migration of FTC-133 follicular thyroid cancer cells[2].
IU1 (25 μM; 4 h reoxygenation after 8 h OGD) increases ZO-1 protein expression in OGD-treated cultured Bend.3 brain endothelial cells, preventing OGD-induced ZO-1 reduction[3].
IU1 (0.1-100 μM; 24 h; 100 μM; 12, 24, 48 h) suppresses the proliferation of HeLa and SiHa human cervical cancer cells in a dose- and time-dependent manner[4].
IU1 (2, 50, 100 μM for HeLa; 20, 50, 100 μM for SiHa; 1 week) reduces long-term colony formation of HeLa and SiHa human cervical cancer cells after 1 week of culture[4].
IU1 (100 μM; 24, 48 h) impairs 2D migration of HeLa and SiHa human cervical cancer cells, as measured by reduced wound closure at 24 and 48 h[4].
IU1 (2, 50, 100 μM for HeLa; 20, 50, 100 μM for SiHa; 12 h) induces G0/G1 cell cycle arrest and reduces S/G2/M phase populations after 12 h of treatment[4].
IU1 (2-100 μM; 12 h) induces dose-dependent apoptosis in HeLa human cervical cancer cells after 12 h of treatment[4].
IU1 (100 μM; 12 h) reduces MDM2 protein expression and increases p53 protein expression in HeLa human cervical cancer cells after 12 h of treatment; IU1 (2-100 μM; 12 h) increases levels of cleaved caspase-3, cleaved caspase-9, and cleaved caspase-8 to promote apoptosis[4].
IU1 (0.1-100 μM; 12 h) enhances UPS function in HeLa human cervical cancer cells by increasing total protein ubiquitination in a dose-dependent manner after 12 h of treatment[4].
IU1 (0.1-2 μM; 12 h) increases p62 and LC3-II protein levels, while IU1 (5-100 μM; 12 h) decreases p62 and increases LC3-II protein levels, in HeLa human cervical cancer cells after 12 h of treatment, indicating autophagy activation[4].
IU1 (100 μM; 12 h post 48 h transfection) increases LC3 puncta formation and the number of autophagosomes and autolysosomes in HeLa human cervical cancer cells transfected with pBabe-EGFP-mRFP-LC3, confirming autophagy activation[4].
IU1 (4.7-100 μM; ~30 min-2 hr) potently and selectively inhibits the deubiquitinating activity of proteasome-bound human Usp14, with an IC50 of 4.7 μM, and this inhibition is fully reversible[5].
IU1 (34 μM; 0, 4, 8 min) enhances proteasomal degradation of polyubiquitinated cyclin B in vitro by inhibiting Usp14[5].
IU1 (25-100 μM; 6 hr) reduces Tau protein levels in wild-type MEFs by enhancing proteasomal degradation via Usp14 inhibition[5].
IU1 (10-100 μM; 6 hr) reduces protein levels of both expanded (Q80) and wild-type (Q22) ataxin-3 in wild-type MEFs by enhancing proteasomal degradation via Usp14 inhibition[5].
IU1 (75 μM; 0, 2, 4, 6, 8 hr) reduces TDP-43 protein levels and enhances its ubiquitination in wild-type MEFs by enhancing proteasomal degradation via Usp14 inhibition[5].
IU1 (50 μM; 6 hr) does not affect the levels of the ubiquitin-independent proteasome substrate cODC-EGFP in wild-type MEFs, demonstrating its effect is specific to ubiquitin-dependent proteasomal substrates via Usp14 inhibition[5].
MedChemExpress (MCE) has not independently confirmed the accuracy of these methods. They are for reference only.
-
Cell Line:ML1 follicular thyroid cancer cells, primary human thyroid cells
-
Concentration:1 μM, 3 μM, 5 μM, 10 μM, 20 μM, 30 μM, 50 μM, and 100 μM
-
Incubation Time:24 h
-
Result:Significantly reduced ML1 cell proliferation at 100 μM.
Caused dose-dependent reductions in ML1 cell proliferation at 20, 30, 50, and 100 μM, with 100 μM inducing the strongest effect.
Significantly reduced primary thyroid cell proliferation only at 100 μM.
-
Cell Line:ML1 follicular thyroid cancer cells
-
Concentration:20-50 μM
-
Incubation Time:24 h
-
Result:Decreased the total amount of mature 26S proteasome complexes at 20 and 50 μM, with 50 μM inducing a significant reduction.
Reduced the amount of USP14-containing 26S proteasome complexes, though this decrease did not reach statistical significance.
-
Cell Line:ML1 follicular thyroid cancer cells, primary human thyroid cells
-
Concentration:20 μM (IU1); 100 μM (Chloroquine
, co-treatment) -
Incubation Time:24 h (IU1); 4 h (CQ, final incubation)
-
Result:Significantly increased LC3B-II levels in ML1 cells when co-treated with 100 μM Chloroquine, indicating enhanced LC3B-dependent autophagy flux.
Significantly reduced LC3B-II levels in primary thyroid cells when co-treated with 100 μM Chloroquine, indicating reduced LC3B-dependent autophagy flux.\nDid not cause significant changes in GABARAP-II levels in either ML1 cells or primary thyroid cells when co-treated with 100 μM Chloroquine, indicating no effect on GABARAP-dependent autophagy flux.
-
Cell Line:HeLa, SiHa human cervical cancer cells
-
Concentration:0.1-100 μM (24 h); 100 μM (12, 24, 48 h)
-
Incubation Time:12 h, 24 h, 48 h (100 μM); 24 h (0.1-100 μM)
-
Result:Significantly decreased cell proliferation in a dose-dependent and time-dependent manner in both HeLa and SiHa cells.
-
Cell Line:HeLa, SiHa human cervical cancer cells
-
Concentration:100 μM
-
Incubation Time:24 h, 48 h
-
Result:Markedly suppressed wound closure in both HeLa and SiHa cells at 24 and 48 h compared to controls.
-
Cell Line:HeLa, SiHa human cervical cancer cells
-
Concentration:2, 50, 100 μM (HeLa); 20, 50, 100 μM (SiHa)
-
Incubation Time:12 h
-
Result:Dramatically induced G0/G1 cell cycle arrest, associated with a decreased population in S/G2/M phases.
-
Cell Line:HeLa human cervical cancer cells
-
Concentration:2, 50, 100 μM
-
Incubation Time:12 h
-
Result:Significantly increased the relative apoptosis ratio in HeLa cells, with dose-dependent increases in early (Q4), late (Q2), and total apoptotic cells.
-
Cell Line:HeLa human cervical cancer cells
-
Concentration:100 μM (MDM2/p53 analysis); 2, 20, 50, 100 μM (caspase analysis)
-
Incubation Time:12 h
-
Result:Decreased MDM2 protein expression and increased p53 protein expression at 100 μM compared to controls.
Increased protein levels of cleaved caspase-3, cleaved caspase-9, and cleaved caspase-8 at 2, 20, 50, and 100 μM.
-
Cell Line:HeLa human cervical cancer cells
-
Concentration:0.1-2 μM; 5-100 μM
-
Incubation Time:12 h
-
Result:Increased p62 and LC3-II protein levels in a dose-dependent manner at 0.1-2 μM.
Decreased p62 protein levels and increased LC3-II protein levels in a dose-dependent manner at 5-100 μM.
-
Cell Line:HeLa human cervical cancer cells (transfected with pBabe-EGFP-mRFP-LC3)
-
Concentration:100 μM
-
Incubation Time:12 h (after 48 h vector transfection)
-
Result:Significantly increased the number of EGFP and mRFP LC3 puncta per cell, as well as the number of autophagosomes and autolysosomes per cell.
In Vivo
MedChemExpress (MCE) has not independently confirmed the accuracy of these methods. They are for reference only.
-
Animal Model:ICR mice (male, adult, 8-10 weeks old, 25-28 g, middle cerebral artery occlusion surgery with 60 minutes of occlusion followed by reperfusion)[3]
-
Dosage:400 μg/kg
-
Administration:intraperitoneally; immediately after reperfusion, then 24 hours and 48 hours post-ischemic stroke
-
Result:Reduced USP14 protein expression in brain tissue and reduced USP14-positive vascular cells per field.
Increased Zonula occludens 1 (ZO-1) protein expression in brain tissue.
Reduced myeloperoxidase (MPO) protein expression in brain tissue compared to MCAO controls and reduced MPO-positive leukocytes in ischemic brain tissue.
Reduced ionized calcium-binding adapter molecule 1 (IBA1)-positive microglial cells per field compared to MCAO controls.
Reduced glial fibrillary acidic protein (GFAP) protein expression in brain tissue compared to MCAO controls and reduced activated GFAP-positive astrocytes.
Reduced brain tissue levels of proinflammatory cytokines TNF-α, IL-1β, and IL-6 compared to MCAO controls.
Reduced infarct volume compared to MCAO controls.
Increased NeuN-positive neuron count per field compared to MCAO controls and reduced TUNEL-positive apoptotic neurons per field compared to MCAO controls.
- Cell migration
- Somatic Cell Culture
- Detection of Apoptosis
- TUNEL staining for apoptotic DNA fragmentation
- Flow cytometric DNA-content cell-cycle staining
- Research Protocol for Endocrine Diseases
- Autophagy
- Apoptosis Solutions
- Lysosome and acidic-vesicle live-cell staining
- MTT Cell Proliferation Assay
- Macroautophagy Solutions
- Annexin V plus membrane-impermeant dye apoptosis staining
- BrdU Incorporation Assay
- ROS/oxidative-stress fluorescent staining
- CFSE Dye Dilution Proliferation Assay
- Dye-dilution cell tracking and proliferation staining
- CCK-8/WST-8 Cell Proliferation Assay
- Protocol for Cell Cycle
- Cell Counting-Based Growth Curve Assay
- Colony Formation (Clonogenic) Assay
- Research Protocol for Neurological Diseases
- Cell Viability Determination by MTT Colorimetric Assay
- EdU Incorporation Assay (Click Chemistry-Based DNA Synthesis Measurement)
- Ki-67 Immunostaining Proliferation Assay
- PCNA Immunodetection Proliferation Assay
- Protocol for Cell Counting and Cell Density Analysis


Chemical Information
-
No. CAS 314245-33-5
-
Appearance Solid
-
Peso molecular 300.37
-
Fòrmula C18H21FN2O
-
Color Light yellow to yellow
-
SMILES
CC1=CC(C(CN2CCCC2)=O)=C(C)N1C3=CC=C(F)C=C3
-
Envío
Room temperature in continental US; may vary elsewhere.
-
Almacenamiento
Powder -20°C 3 years 4°C 2 years In solvent -80°C 6 months -20°C 1 month


Publications (26)
-
Journal Impact Factor
-
Most Recent
-
Cancer Cell
Ubiquitination-directed cytosolic DNA degradation governs cGAS-STING-mediated immune response to DNA damage. [Abstract]2026 Feb 9;44(2):306-320.e7. PMID: 41512867 -
Nat Commun
2025 May 16;16(1):4564. PMID: 40379682 -
Nat Commun
USP8 inhibition reshapes an inflamed tumor microenvironment that potentiates the immunotherapy. [Abstract]2022 Mar 31;13(1):1700. PMID: 35361799 -
Redox Biol
USP20 governs tyrosine kinase inhibitors resistance through ferroptosis evasion by targeting GPX4 in cancers. [Abstract]2026 May:92:104086. PMID: 41844497 -
Adv Sci (Weinh)
USP35 Acts as a Deubiquitinating Enzyme for ID3 to Promote Immune Escape in Colorectal Cancer. [Abstract]2026 Jan 4:e16588. PMID: 41486422
IU1 purchased from MedChemExpress. Usage Cited in: Adv Sci (Weinh). 2026 Jan 4:e16588. [Abstract]
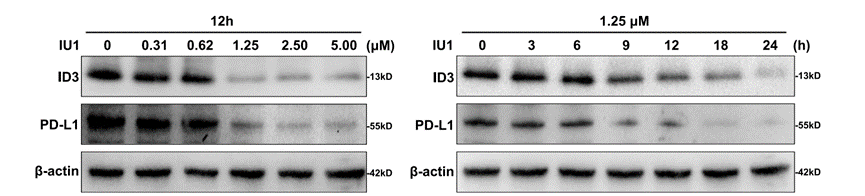
Western blot analysis of ID3 and PD‐L1 levels under different IU1 (0.31, 0.62, 1.25, 2.50, 5.00 μM, or 1.25 μM, 2, 6, 9, 12, 18, 24 h) concentrations.
-
Sci Adv
The cohesin-associated protein Pds5A governs the meiotic spindle assembly via deubiquitination of Kif5B in oocytes. [Abstract]2025 Apr 11;11(15):eadt6159. PMID: 40215310 -
Cell Death Differ
A self-amplifying USP14-TAZ loop drives the progression and liver metastasis of pancreatic ductal adenocarcinoma. [Abstract]2023 Jan;30(1):1-15. PMID: 35906484
IU1 purchased from MedChemExpress. Usage Cited in: Cell Death Differ. 2023 Jan;30(1):1-15. [Abstract]
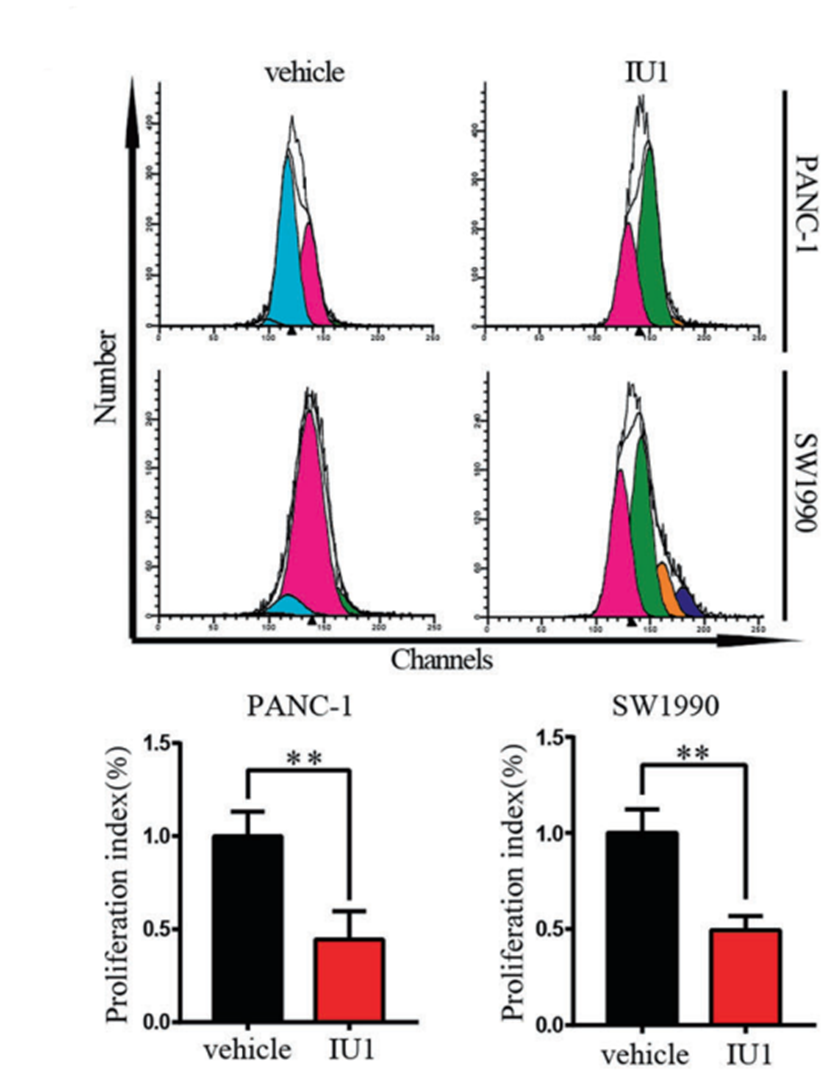
PANC-1 and SW1990 cells were stained with CFSE and plated into 6-well plates for 12 h of incubation. After 48 h IU1 treatment, flow cytometry was used to examine the cell proliferation.
IU1 purchased from MedChemExpress. Usage Cited in: Cell Death Differ. 2023 Jan;30(1):1-15. [Abstract]
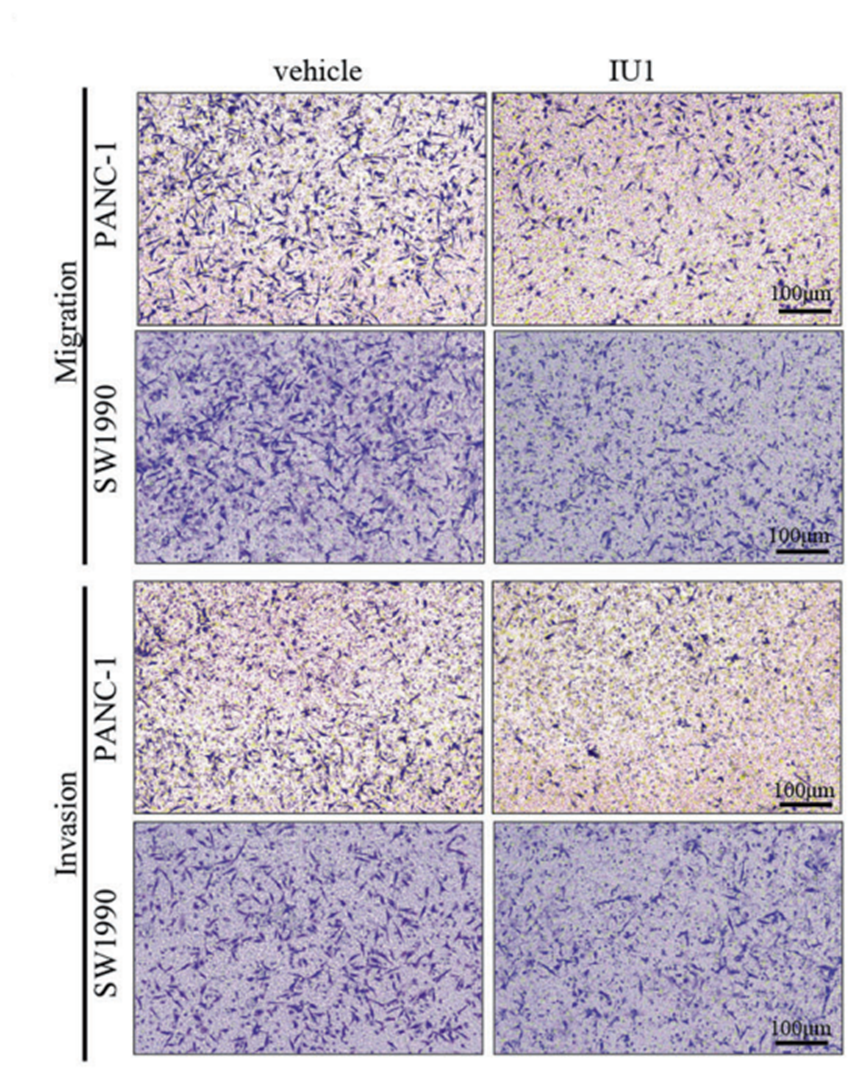
Transwell assay was used to measure the migration and invasion of the PANC-1 and SW-1990 cells treated with IU1.
IU1 purchased from MedChemExpress. Usage Cited in: Cell Death Differ. 2023 Jan;30(1):1-15. [Abstract]
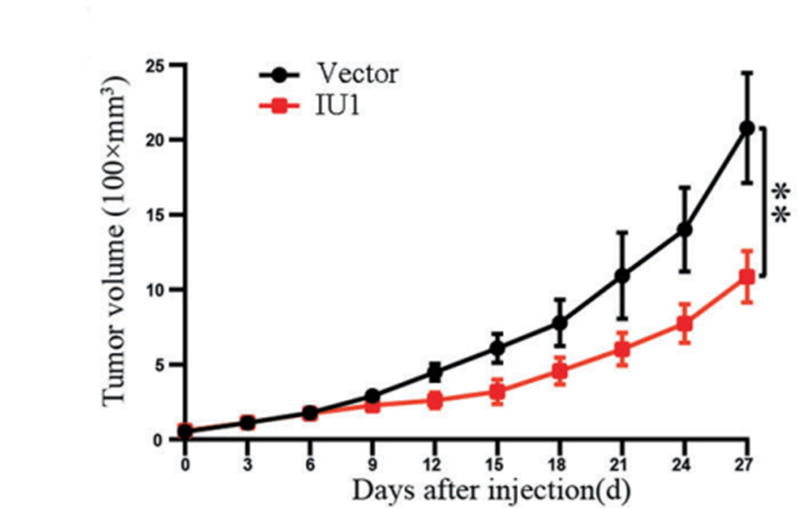
Tumour volumes were measured with the vehicle-treated group and the IU1 (40 mg/kg, i.g.)-treated group.
IU1 purchased from MedChemExpress. Usage Cited in: Cell Death Differ. 2023 Jan;30(1):1-15. [Abstract]
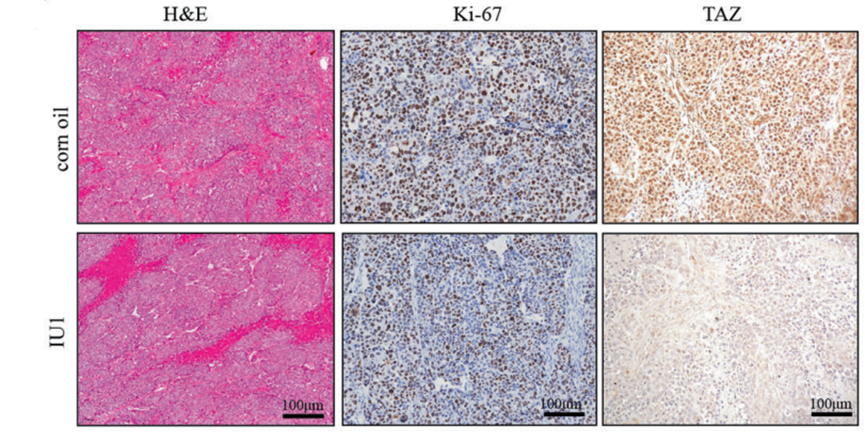
H&E staining and IHC staining of Ki67 and TAZ from the corn oil-treated group and the IU1 (40 mg/kg, i.g.)-treated group.
-
Cell Death Dis
The deubiquitination enzyme USP14 promotes the tumourigenesis of gastric cancer by enhancing c-MYC nuclear translocation through deubiquitination of KPNA2. [Abstract]2025 Oct 21;16(1):737. PMID: 41120255 -
Pharmacol Res
Nuclear receptor coactivator 4-mediated ferritinophagy contributes to cerebral ischemia-induced ferroptosis in ischemic stroke. [Abstract]2021 Dec:174:105933. PMID: 34634471 -
J Immunother Cancer
CD47 destabilization via manipulating the SPOP-USP2 axis augments macrophage phagocytosis and cancer immunotherapy. [Abstract]2026 Jan 14;14(1):e013498. PMID: 41534899 -
J Transl Med
USP14 inhibition promotes DNA damage repair and represses ovarian granulosa cell senescence in premature ovarian insufficiency. [Abstract]2024 Sep 11;22(1):834. PMID: 39261935 -
Int J Biol Macromol
Mechanistic insights into the role of USP14 in adipose tissue macrophage recruitment and insulin resistance in obesity. [Abstract]2024 Apr 15;267(Pt 2):131645. PMID: 38631582 -
EMBO J
USP8 promotes cancer progression and extracellular vesicle-mediated CD8+ T cell exhaustion by deubiquitinating the TGF-β receptor TβRII. [Abstract]2022 Aug 16;41(16):e108791. PMID: 35811497 -
Respir Res
The MFGE8/integrin β3 axis mitigates experimental neutrophilic asthma by suppressing NLRP3-Caspase-1 pathway-mediated NETosis. [Abstract]2025 Jul 2;26(1):229. PMID: 40605028 -
Sci Rep
Ubiquitin-specific protease 14 inhibition promotes mitophagy and attenuates neural apoptosis after spinal cord injury. [Abstract]2025 Dec 9;15(1):43741. PMID: 41366047 -
iScience
Targeting USP14 enhances immunotherapy response by reprogramming tumor-associated macrophages in colon cancer. [Abstract]2026 Mar 13;29(5):115362. PMID: 42058892 -
Microbiol Spectr
2025 Aug 5;13(8):e0018825. PMID: 40662581 -
Neurotoxicology
Inhibition of P2X7R by hypericin improves diabetic cardiac autonomic neuropathy through the proteasome- Nrf2 - GPX4 signaling axis. [Abstract]2025 Jul:109:1-10. PMID: 40412558 -
-
Front Oncol
2021 Feb 23;11:615568. PMID: 33708629 -
Food Chem Toxicol
Piceatannol upregulates USP14-mediated GPX4 deubiquitination to inhibit neuronal ferroptosis caused by cerebral ischemia-reperfusion in mice. [Abstract]2025 Mar:197:115281. PMID: 39880152 -
Clin Transl Oncol
USP14 targets FABP5-mediated ferroptosis to promote proliferation and cisplatin resistance of HNSCC. [Abstract]2025 Aug;27(8):3485-3500. PMID: 39928282 -
Eur J Histochem
Deubiquitinase USP14 is upregulated in Crohn's disease and inhibits the NOD2 pathway mediated inflammatory response in vitro. [Abstract]2024 Sep 9;68(3):4101. PMID: 39252535 -
-
-


Solvente y solubilidad
In Vitro:
DMSO : 41.67 mg/mL (138.73 mM; Need ultrasonic; Hygroscopic DMSO has a significant impact on the solubility of product, please use newly opened DMSO)
Please refer to the solubility information to select the appropriate solvent. Once prepared, please aliquot and store the solution to prevent product inactivation from repeated freeze-thaw cycles.
Storage method and period of stock solution: -80°C, 6 months; -20°C, 1 month. When stored at -80°C, please use it within 6 months. When stored at -20°C, please use it within 1 month.
Please refer to the solubility information to select the appropriate solvent. Once prepared, please aliquot and store the solution to prevent product inactivation from repeated freeze-thaw cycles.
Storage method and period of stock solution: -80°C, 6 months; -20°C, 1 month. When stored at -80°C, please use it within 6 months. When stored at -20°C, please use it within 1 month.
Concentration (start) × Volume (start) = Concentration (final) × Volume (final)
In Vivo:
Select the appropriate dissolution method based on your experimental animal and administration route.
- For the following dissolution methods, please ensure to first prepare a clear stock solution using an In Vitro approach and then sequentially add co-solvents:
- To ensure reliable experimental results, the clarified stock solution can be appropriately stored based on storage conditions. As for the working solution for In Vivo experiments, it is recommended to prepare freshly and use it on the same day.
- The percentages shown for the solvents indicate their volumetric ratio in the final prepared solution. If precipitation or phase separation occurs during preparation, heat and/or sonication can be used to aid dissolution.
Add each solvent one by one: 10% DMSO 40% PEG300 5% Tween-80 45% Saline
Solubility: ≥ 1.67 mg/mL (5.56 mM); Clear solution
This protocol yields a clear solution of ≥ 1.67 mg/mL (saturation unknown).
Taking 1 mL working solution as an example, add 100 μL DMSO stock solution (16.7 mg/mL) to 400 μL PEG300, and mix evenly; then add 50 μL Tween-80 and mix evenly; then add 450 μL Saline to adjust the volume to 1 mL.
Preparation of Saline: Dissolve 0.9 g sodium chloride in ddH₂O and dilute to 100 mL to obtain a clear Saline solution.
Add each solvent one by one: 10% DMSO 90% (20% SBE-β-CD in Saline)
Solubility: ≥ 1.67 mg/mL (5.56 mM); Clear solution
This protocol yields a clear solution of ≥ 1.67 mg/mL (saturation unknown).
Taking 1 mL working solution as an example, add 100 μL DMSO stock solution (16.7 mg/mL) to 900 μL 20% SBE-β-CD in Saline, and mix evenly.
Preparation of 20% SBE-β-CD in Saline (4°C, storage for one week): 2 g SBE-β-CD powder is dissolved in 10 mL Saline, completely dissolve until clear.
In Vivo Dissolution Calculator
Please enter the basic information of animal experiments:
-
-
-
-
Recommended: Prepare an additional quantity of animals to account for potential losses during experiments.
Please enter your animal formula composition:
-
%DMSO +
Recommended: Keep the proportion of DMSO in working solution below 2% if your animal is weak.
-
%+
-
+%Tween-80 + +
-
%Saline +
The co-solvents required include: DMSO, . All of co-solvents are available by MedChemExpress (MCE). , Tween 80. All of co-solvents are available by MedChemExpress (MCE).
Working solution concentration: 0.22 mg/mL
Method for preparing stock solution: mg drug dissolved in μL DMSO. Stock solution concentration: mg/mL.
1. Take μL DMSO stock solution;
2. Add μL .
μL , mix evenly;
3. Then add μL Tween 80, mix evenly;
4. Then add μL
Please ensure that the stock solution in the first step is dissolved to a clear state, and add co-solvents in sequence. You can use ultrasonic heating (ultrasonic cleaner, recommended frequency 20-40 kHz), vortexing, etc. to assist dissolution.


Pureza y Documentación
-
Ficha de datos (295 KB)
-
SDS (476 KB)
- English - EN (476 KB)
- Français - FR (476 KB)
- Deutsch - DE (476 KB)
- Norwegian - NO (476 KB)
- Español - ES (476 KB)
- Swedish - SV (476 KB)
- Italian - IT (476 KB)
- Korean - KR (476 KB)
- Portuguese - PT (476 KB)
-
Instrucciones de manejo (2659 KB)
Referencias
[1]. Kiprowska MJ, et al. Neurotoxic mechanisms by which the USP14 inhibitor IU1 depletes ubiquitinated proteins and Tau in rat cerebral cortical neurons: Relevance to Alzheimer's disease. Biochim Biophys Acta Mol Basis Dis. 2017;1863(6):1157-1170. [Content Brief]
[2]. Srinivasan V, et al. Proliferation and migration of ML1 follicular thyroid cancer cells are inhibited by IU1 targeting USP14: role of proteasome and autophagy flux. Front Cell Dev Biol. 2023;11:1234204. Published 2023 Aug 30. [Content Brief]
[3]. Hou W, et al. USP14 inhibition promotes recovery by protecting BBB integrity and attenuating neuroinflammation in MCAO mice. CNS Neurosci Ther. 2023;29(11):3612-3623. [Content Brief]
[4]. Xu L, et al. IU1 suppresses proliferation of cervical cancer cells through MDM2 degradation. Int J Biol Sci. 2020;16(15):2951-2963. Published 2020 Sep 16. [Content Brief]
[5]. Lee BH, et al. Enhancement of proteasome activity by a small-molecule inhibitor of USP14. Nature. 2010;467(7312):179-184. [Content Brief]


Complete Stock Solution Preparation Table
Please refer to the solubility information to select the appropriate solvent. Once prepared, please aliquot and store the solution to prevent product inactivation from repeated freeze-thaw cycles.
Storage method and period of stock solution: -80°C, 6 months; -20°C, 1 month. When stored at -80°C, please use it within 6 months. When stored at -20°C, please use it within 1 month.
| Optional Solvent | Concentration Solvent Mass | 1 mg | 5 mg | 10 mg | 25 mg |
|---|---|---|---|---|---|
| DMSO | 1 mM | 3.3292 mL | 16.6461 mL | 33.2923 mL | 83.2307 mL |
| 5 mM | 0.6658 mL | 3.3292 mL | 6.6585 mL | 16.6461 mL | |
| 10 mM | 0.3329 mL | 1.6646 mL | 3.3292 mL | 8.3231 mL | |
| 15 mM | 0.2219 mL | 1.1097 mL | 2.2195 mL | 5.5487 mL | |
| 20 mM | 0.1665 mL | 0.8323 mL | 1.6646 mL | 4.1615 mL | |
| 25 mM | 0.1332 mL | 0.6658 mL | 1.3317 mL | 3.3292 mL | |
| 30 mM | 0.1110 mL | 0.5549 mL | 1.1097 mL | 2.7744 mL | |
| 40 mM | 0.0832 mL | 0.4162 mL | 0.8323 mL | 2.0808 mL | |
| 50 mM | 0.0666 mL | 0.3329 mL | 0.6658 mL | 1.6646 mL | |
| 60 mM | 0.0555 mL | 0.2774 mL | 0.5549 mL | 1.3872 mL | |
| 80 mM | 0.0416 mL | 0.2081 mL | 0.4162 mL | 1.0404 mL | |
| 100 mM | 0.0333 mL | 0.1665 mL | 0.3329 mL | 0.8323 mL |


IU1 Related Classifications
HY-13817 Related Classifications
 Powered by Bioz