



MR24
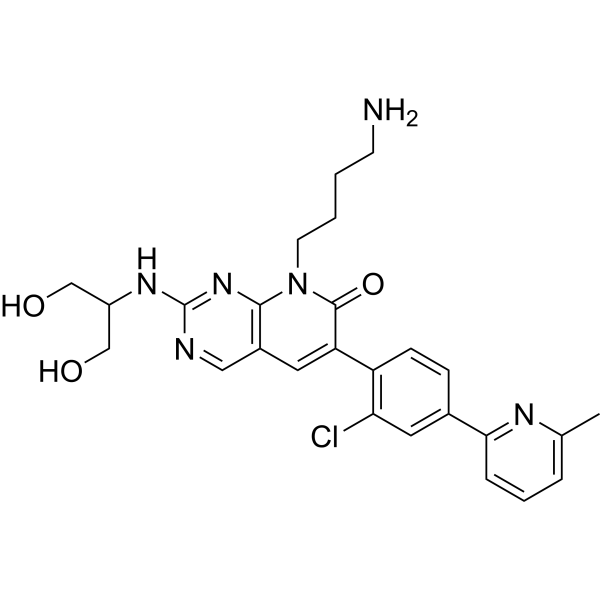
MR24, a G-5555 (HY-19635) derivative, is a mammalian STE20-like (MST) kinase inhibitor. MR24 shows selectively to MST3/4 over MST1/2, with EC50 values of 57 and 583 nM, respectively. MR24 induces G1 phase cell cycle arrest. MR24 can be used for cancer research, such as breast, liver and lung cancers.
Para uso exclusivo en investigación. No vendemos a pacientes.
- No. CAS: 3056814-89-9
- Fòrmula: C26H29ClN6O3
- Peso molecular:509.00
-
Almacenamiento:
Please store the product under the recommended conditions in the Certificate of Analysis.

To place orders, for customer services and technical support, please contact: MedChemExpress USA
Tel: 609-228-6898 E-mail: [email protected] [email protected]


-
 Actividad biológica
-
Chemical Information
- Protocolo
- Pureza y Documentación
- Referencias
-
 Help & FAQs




Actividad biológica
Descripciòn
IC50 & Target
[1]|
MST3 57 nM (EC50) |
MST4 583 nM (EC50) |
In Vitro
MR24 (compound 24) (1-10 μM, 6-72 h) shows no significant effect on cell healthy nuclei in HCT116 cells, and only results in a slight reduction in cell viability by about 30% at a concentration of 10 μM[1].
MR24 (1-10 μM, 24-72 h) induces G1 phase cell cycle arrest in HCT116 cells[1].
MedChemExpress (MCE) has not independently confirmed the accuracy of these methods. They are for reference only.
-
Cell Line:HCT116 cells
-
Concentration:1, 5, and 10 μM
-
Incubation Time:24, 48 and 72 h
-
Result:Increased the fraction of cells in the G1 phase at 10 μM.
-
Cell Line:HCT116 cells
-
Concentration:1 and 10 μM
-
Incubation Time:6, 12, 24, 48 and 72 h
-
Result:Showed no significant effect on the normalized cell count at a concentration of 1 μM.
Resulted in a slight reduction in cell viability by about 30% at a concentration of 10 μM.
Resulted in over 90% healthy nuclei after 24 h at both concentrations used (1 and 10 μM).


Chemical Information
-
No. CAS 3056814-89-9
-
Peso molecular 509.00
-
Fòrmula C26H29ClN6O3
-
SMILES
CC1=CC=CC(C2=CC(Cl)=C(C=C2)C3=CC4=C(N(C3=O)CCCCN)N=C(N=C4)NC(CO)CO)=N1
-
Envío
Room temperature in continental US; may vary elsewhere.
-
Almacenamiento
Please store the product under the recommended conditions in the Certificate of Analysis.


Pureza y Documentación
Referencias

Calculators
Concentration (start) × Volume (start) = Concentration (final) × Volume (final)


MR24 Related Classifications
HY-157932 Related Classifications
 Powered by Bioz