



MRK 003
MRK 003 is an orally active γ-secretase inhibitor. MRK 003 targets the Notch signaling pathway by blocking the proteolytic cleavage of Notch receptors. MRK 003 inhibits tumor cell proliferation, induces apoptosis, downregulates anti-apoptotic proteins, upregulates phosphorylated Akt, suppresses angiogenesis, and overcomes microenvironment-mediated proliferative protection. MRK 003 can be used in research related to lung cancer, multiple myeloma, non-Hodgkin's lymphoma, pancreatic ductal adenocarcinoma, glioblastoma, and breast cancer.
Nur für Forschungszwecke. Wir verkaufen nicht an Patienten.
- CAS. Nr.: 623165-93-5
- Formel: C25H31F6N3O2S
- Molecular Weight:551.59
-
Speicherung:
Please store the product under the recommended conditions in the Certificate of Analysis.


To place orders, for customer services and technical support, please contact: MedChemExpress USA
Tel: 609-228-6898 E-mail: [email protected] [email protected]


-
 Biologische Aktivität
-
Chemical Information
- Protokoll
- Reinheit & Dokumentation
- Verweise
-
 Help & FAQs


-
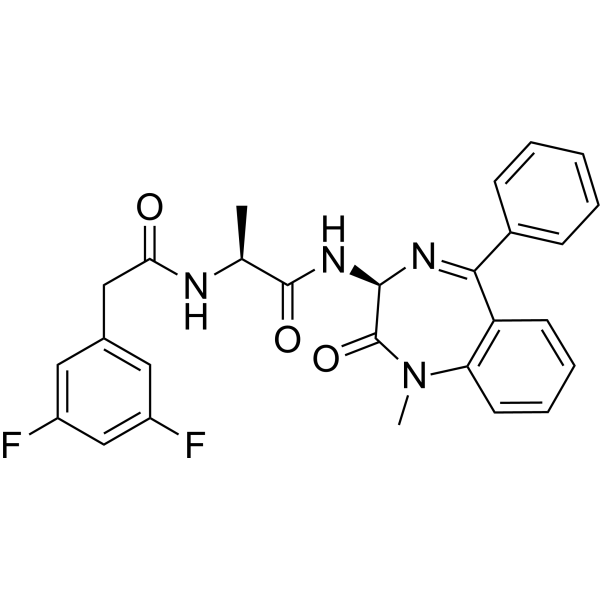
HY-14176
Compound Eγ-secretase Inhibitor -
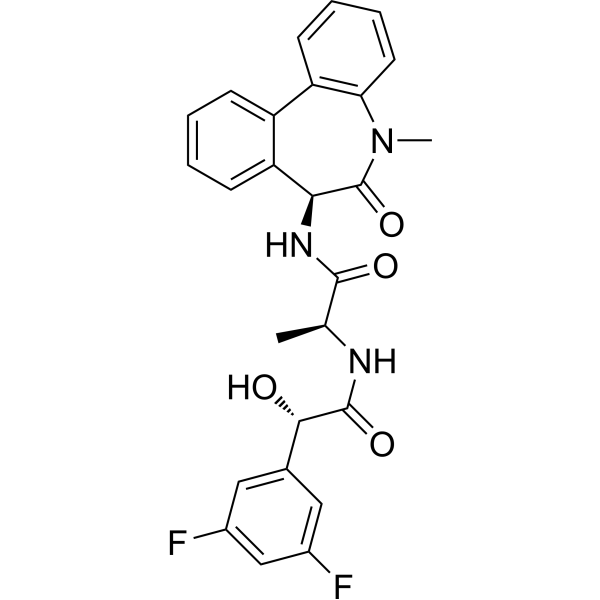
HY-50752
LY-411575γ-secretase Inhibitor -
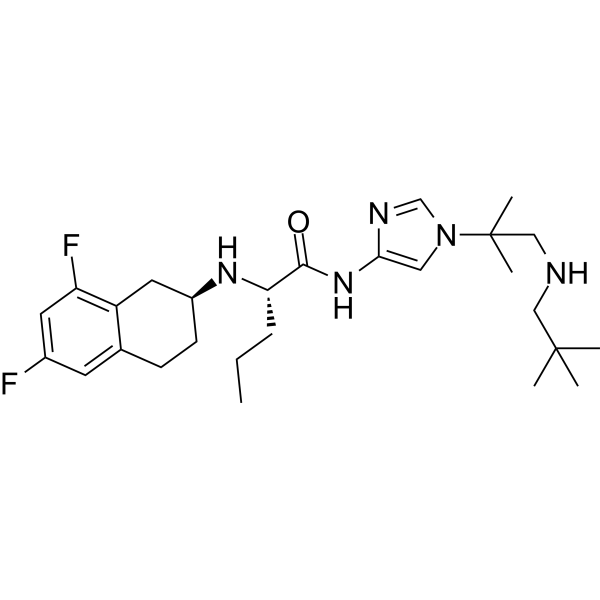
HY-15185
Nirogacestatγ-Secretase Inhibitor -
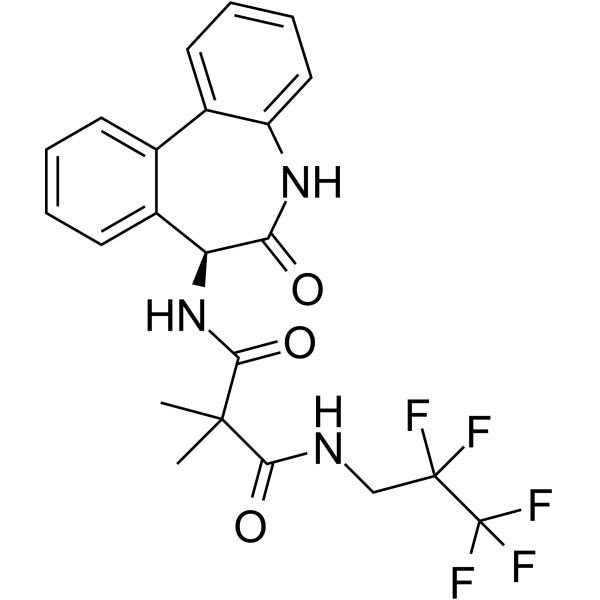
HY-11102
RO4929097γ-secretase Inhibitor -
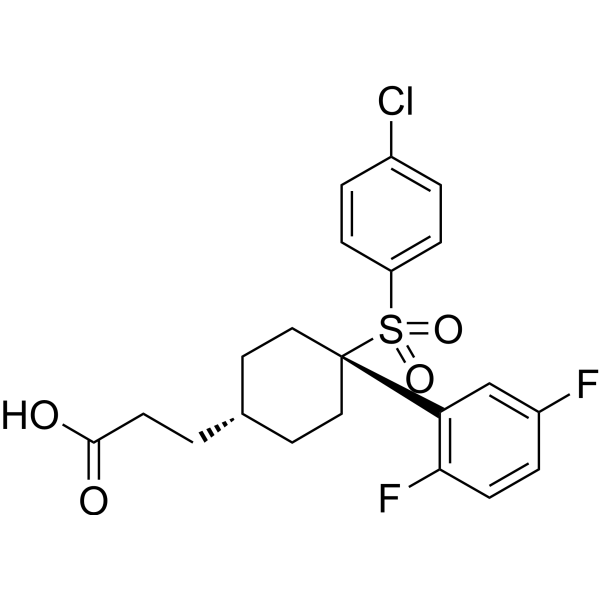
HY-10974
MK-0752 -
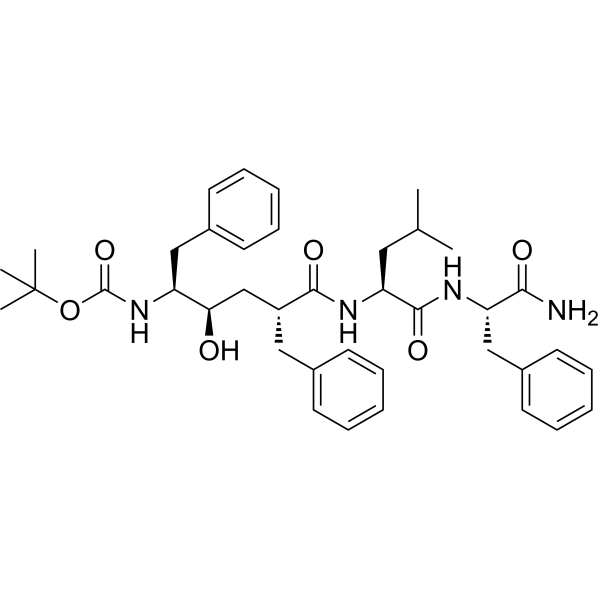
HY-19369
L-685458γ-Secretase Inhibitor -
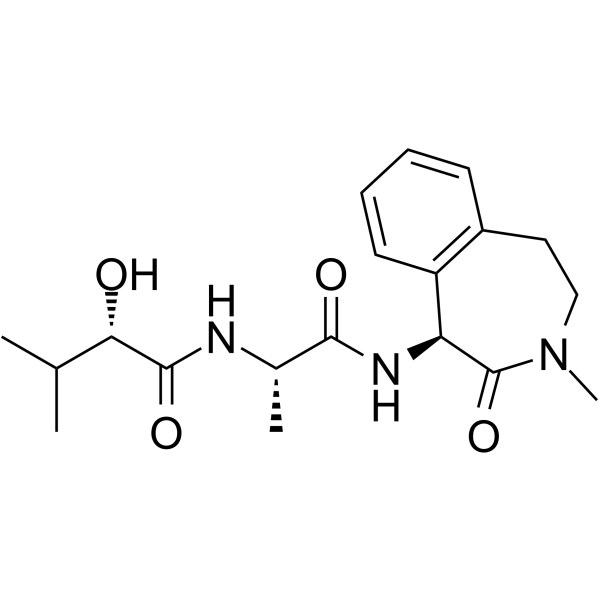
HY-10009
Semagacestatγ-secretase Inhibitor -

HY-15185R
Nirogacestat (Standard)γ-Secretase Inhibitor -
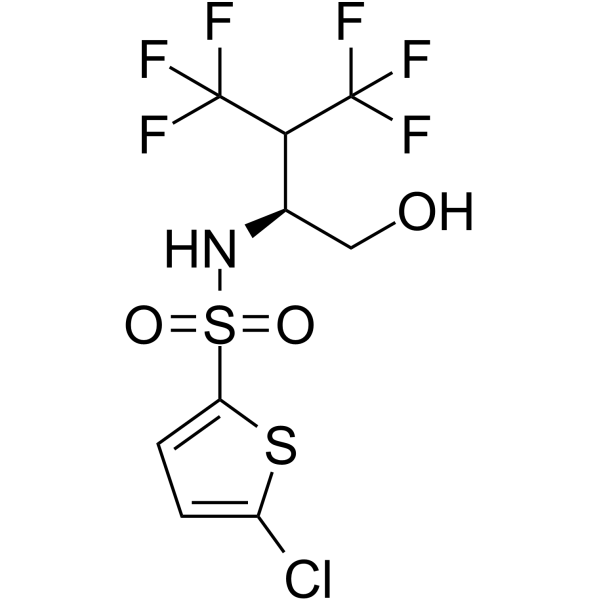
HY-14175
Begacestatγ-secretase Inhibitor -
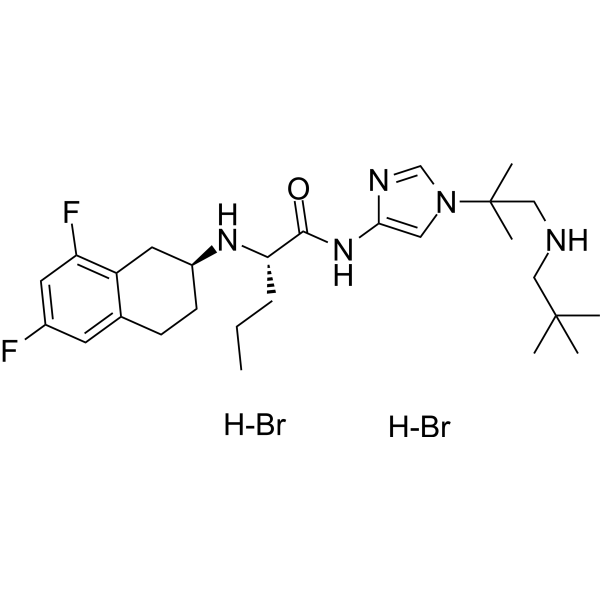
HY-15185B
Nirogacestat dihydrobromideγ-secretase Inhibitor -
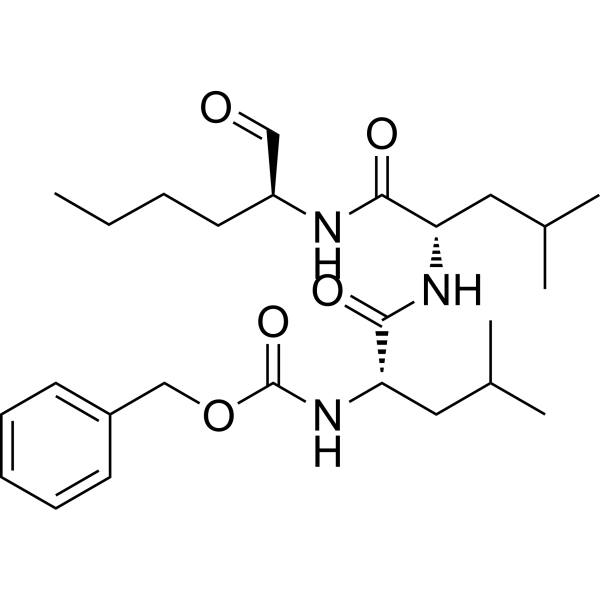
HY-120234
Z-LLNle-CHOγ-Secretase Inhibitor I -

HY-16632
ELND 006


Biologische Aktivität
Beschreibung
In Vitro
MRK 003 inhibits the canonical Notch signaling pathway in HCC2429 non-small cell lung cancer cells, reducing the transcriptional levels of HES1 and Hey1 by 4-fold and 2-fold, respectively, and increasing the transcriptional level of hASH1 by 4-fold[1].
MRK 003 (pre-incubated for 24 h prior to serum stimulation at concentrations of 5-10 μmol/L) reduces serum-induced pERK activation in HCC2429 non-small cell lung cancer cells, with a significant reduction observed after 30 minutes of stimulation with 10% FCS[1].
MRK 003 (10 μmol/L) reduces soft agar colony formation in HCC2429 non-small cell lung cancer cells, and this effect is significantly enhanced when combined with the EGFR tyrosine kinase inhibitor AG1478 (HY-13524)[1].
MRK 003 (5-30 μM; 48 h) induces dose-dependent cytotoxicity in human multiple myeloma (MM1.S, MM1.R, RPMI 8226, DOX 40, LR5, U266, OPM-2, NCI-H929) and non-Hodgkin's lymphoma (Ramos, Dohh2, Karpas 422) cell lines, with IC50 values of 15-30 μM and 15-25 μM, respectively, whereas the Granta 519 non-Hodgkin's lymphoma cell line exhibits drug resistance[4].
MRK 003 (5-35 μM; 48 h) inhibits the proliferation of human multiple myeloma (MM1.S, MM1.R, RPMI 8226, DOX 40, LR5, U266, NCI-H929) and non-Hodgkin's lymphoma (Ramos, Dohh2, Karpas 422, Granta 519) cell lines, among which MM1.S, MM1.R, H929 and U266 cells exhibit higher sensitivity at lower concentrations[4].
MRK 003 (5-30 μM; 48 h) reverses the pro-proliferative effect of patient-derived bone marrow mesenchymal stem cells (BMSCs), thereby inhibiting the proliferation of human MM1.S multiple myeloma cells after 48 h of incubation[4].
MRK 003 (5-30 μM; 48 h) inhibits cytokine-induced proliferation of human MM1.S multiple myeloma (MM) cells and Dohh2 non-Hodgkin's lymphoma (NHL) cells following 48 h of incubation[4].
MRK 003 (20 μM; 12, 24 h) regulates the Notch, PI3K/Akt, Ras/Mek/Erk, NF-κB pathways as well as anti-apoptotic pathways in a cell type-specific manner in human RPMI 8226 multiple myeloma (MM) cells and Dohh2 non-Hodgkin's lymphoma (NHL) cells, with incubation durations of 12 h and 24 h[4].
MRK 003 (0.01-10 μmol/L; 1 week) irreversibly reduces the sphere-forming cell frequency of primary mouse ERBB2 transgenic breast cancer cells and established mouse tumor spheres, while reversibly decreasing the sphere-forming cell frequency of primary mouse mammary epithelial cells and established mouse mammospheres, with complete inhibition achieved at a concentration of 10 μmol/L[5].
MRK 003 (0.1-10 μmol/L) promotes the differentiation of primary mouse mammary epithelial bipotent progenitor cells and primary mouse ERBB2-transgenic mammary tumor-like progenitor cells toward the myoepithelial lineage, without altering the frequency of overall colony-forming cells[5].
MRK 003 (2-5 μmol/L; 48 h) reduces the proportion of CD44+CD24+ and ALDH+ tumor-initiating cell populations in sensitive pancreatic ductal adenocarcinoma (PDAC) cell lines (Capan-1, Pa03C), while increasing the proportion of these cell populations in drug-resistant cell lines (Pa16C, Pa29C)[6].
MRK 003 (2-5 μmol/L; 48 h) downregulates the mRNA expression of Hes-1 in Capan-1, Pa03C, Pa14C, Pa16C and Pa29C pancreatic ductal adenocarcinoma (PDAC) cell lines[6].
MRK 003 (2-5 μmol/L; 48 h pre-incubation) inhibits the anchorage-independent growth of sensitive pancreatic ductal adenocarcinoma (PDAC) cell lines (Capan-1, Pa03C, Pa14C); stable overexpression of N1ICD in Pa03C cells reverses this effect, while drug-resistant cell lines (Pa16C, Pa29C) show no response to any of the above concentrations[6].
MRK 003 (1-10 μmol/L; 96 h) potently inhibits the proliferation of HSR-GBM1 and 040821 glioblastoma neurospheres in vitro, including vehicle-treated intracranial xenograft-derived neurospheres, with maximal growth inhibition observed at concentrations ≥4 μmol/L[7].
MRK 003 (under serum starvation for 48 h) significantly enhances apoptosis of HCC2429, H1793 and A549 non-small cell lung cancer (NSCLC) cells under serum starvation conditions, but exerts no effect on apoptosis of cells cultured in 10% FCS[1].
The pro-apoptotic potency of MRK 003 (24 h, 48 h) decreases in transient Notch3-knockdown HCC2429 non-small cell lung cancer cells, which further confirms that the pro-apoptotic activity of MRK-003 depends on Notch3[1].
MRK 003 (20 μM; 6-48 h) induces time-dependent apoptosis in human MM1.S, RPMI 8226 multiple myeloma (MM) cells and Dohh2 non-Hodgkin's lymphoma (NHL) cells, with the survival rates of these cells decreasing to 43%, 3.3% and 36% respectively after 48 h[4].
MRK 003 (20 μM; 48 h) induces activation of caspase-3, -8, and -9, and mediates caspase-dependent apoptosis in human MM1.S multiple myeloma (MM) cells and Dohh2 non-Hodgkin's lymphoma (NHL) cells[4].
MedChemExpress (MCE) has not independently confirmed the accuracy of these methods. They are for reference only.
-
Cell Line:HCC2429 (human NSCLC cell line)
-
Concentration:5-10 μmol/L
-
Incubation Time:24 h (pre-incubation before serum stimulation)
-
Result:Detected no pERK at baseline (0 minutes) for any condition.
Induced pERK 15 minutes after serum stimulation in all conditions.
Significantly reduced pERK levels by 30 minutes post-stimulation compared to controls.
-
Cell Line:human MM cell lines (MM1.S, MM1.R, RPMI 8226, DOX 40, LR5, U266, NCI-H929), NHL cell lines (Ramos, Dohh2, Karpas 422, Granta 519)
-
Concentration:5-35 μM
-
Incubation Time:48 h
-
Result:Inhibited proliferation of all tested MM and NHL cell lines.
Showed greater proliferation inhibition sensitivity at lower concentrations in MM1.S, MM1.R, H929, and U266 MM cells compared to RPMI 8226, Dox40, and LR5 MM cells.
-
Cell Line:human MM1.S MM cell line co-cultured with patient-derived bone marrow stromal cells (BMSCs)
-
Concentration:5-30 μM
-
Incubation Time:48 h
-
Result:Overcame the proliferation-promoting effect of BMSC co-culture, and inhibited proliferation of MM1.S cells at slightly higher concentrations compared to cells cultured without BMSCs.
-
Cell Line:human MM1.S MM cell line and Dohh2 NHL cell line cultured with pro-angiogenic cytokines (IL-6, IGF, VEGF)
-
Concentration:5, 10, 15, 20, 25, 30 μM
-
Incubation Time:48 h
-
Result:Inhibited the cytokine-induced proliferation of both MM1.S and Dohh2 cells, despite IL-6, IGF, and VEGF increasing their proliferation.
-
Cell Line:human MM1.S, RPMI 8226 MM cell lines and Dohh2 NHL cell line
-
Concentration:20 μM
-
Incubation Time:6, 24, 48 h
-
Result:Induced time-dependent increases in apoptosis in all tested cell lines.
Reduced viable MM1.S cells from 92% (control) to 43% after 48 h.
Reduced viable RPMI 8226 cells to 3.3% after 48 h.
Reduced viable Dohh2 cells from 92% (control) to 36% after 48 h.
-
Cell Line:human MM1.S MM cell line and Dohh2 NHL cell line
-
Concentration:20 μM
-
Incubation Time:48 h
-
Result:Induced time-dependent increases in activated caspase 3, 8, and 9 levels in both MM1.S and Dohh2 cells, confirming caspase involvement in MRK 003-induced apoptosis.
-
Cell Line:human RPMI 8226 MM cell line and Dohh2 NHL cell line
-
Concentration:20 μM
-
Incubation Time:12, 24 h
-
Result:Downregulated Notch intracellular domain (NICD), Hes1, c-Myc, p21, pErk, Bcl-2, and Bcl-Xl; upregulated pAkt and RelB; and had no effect on cyclin D1, Mcl1, Xiap, p65, p50, p52, or c-Rel in RPMI 8226 cells.
Downregulated NICD, Hes1, c-Myc, cyclin D1, p65, Bcl-Xl, and Xiap; upregulated pAkt and pErk; and had no effect on p21, Mcl1, or Bcl-2, p50, p52, RelB, or c-Rel in Dohh2 cells.
-
Cell Line:Capan-1, Pa03C, Pa14C, Pa16C, Pa29C
-
Concentration:2 μmol/L, 5 μmol/L
-
Incubation Time:48 h
-
Result:Downregulate Hes-1 mRNA transcripts in all 5 tested PDAC cell lines.
-
Cell Line:HSR-GBM1-Luc glioblastoma neurospheres, 040821-Luc glioblastoma neurospheres, neurospheres derived from vehicle-treated HSR-GBM1 intracranial xenografts, neurospheres derived from vehicle-treated 040821 intracranial xenografts
-
Concentration:1-10 μmol/L
-
Incubation Time:96 h
-
Result:Dose-dependently reduced viable cell biomass in all tested glioblastoma neurosphere lines.
Declined normalized OD490 values to near 0 at concentrations ≥4 μmol/L.
In Vivo
MRK 003 (5 μmol/L; 48 hours) significantly delays tumor xenograft growth of MRK-003-sensitive PDAC cell lines (Capan-1, Pa03C) in athymic nude mice, but exerts no effect on drug-resistant cell lines (Pa16C, Pa29C)[6].
MRK 003 (300 mg/kg; p.o.; once weekly; for 5 consecutive weeks) slows tumor growth by 49% and 62% in HSR-GBM1 and 040821 human glioblastoma neurosphere intracranial xenograft models, respectively, and extends the median survival from 29 days to 35 days and from 28 days to 40 days, respectively. In addition, MRK-003 reduces Hes1, Hes5, Hey1 and neural stem/progenitor cell markers, decreases mitosis and clonogenic capacity, and promotes glial differentiation[7].
Combination treatment with MRK 003 (100 mg/kg; p.o.; administered for 3 days followed by a 4-day withdrawal) and Lapatinib (HY-50898) significantly reduces tumor growth of Lapatinib-sensitive ErbB-2-positive breast cancer xenografts by inducing apoptosis, inhibiting proliferation, and blocking the ERK1/2 and AKT1 signaling pathways[3].
MRK-003 (150 mg/kg; p.o.; administered consecutively for 3 days followed by a 4-day drug holiday, repeated once) induces rapid and durable regression of breast tumors in mice by inhibiting tumor cell proliferation, inducing apoptosis, promoting differentiation, and eliminating tumor-initiating cells, resulting in 100% relapse-free survival for up to 1 year in treated mice[5].
MedChemExpress (MCE) has not independently confirmed the accuracy of these methods. They are for reference only.
-
Animal Model:athymic nude mice (male, 6-week-old)[6]
-
Dosage:5 μmol/L
-
Administration:ex vivo; 48 hours
-
Result:Delayed tumor engraftment significantly at day 14 and day 21 postimplantation in Capan-1 and Pa03C cells compared with vehicle-pretreated cells.
Showed no difference in engraftment rates for Pa16C or Pa29C cells between MRK-003 and vehicle pretreatment arms.
-
Animal Model:athymic nude mice[6]
-
Dosage:150 mg/kg
-
Administration:p.o.; once weekly; 3 weeks
-
Result:Reduced tumor volume significantly in 5 of 9 (56%) PDAC xenografts compared with vehicle control: Panc374, Panc219, Panc265, Panc420, and JH033.
Downregulated nuclear Notch1 intracellular domain (N1ICD) and Hes-1 protein expression in xenograft tumor samples compared with vehicle-treated controls.
-
Animal Model:Athymic (nu/nu) (Harlan, orthotopic xenografts from luciferase-transduced temozolomide-resistant HSR-GBM1 glioblastoma neurospheres injected into right striatum)[7]
-
Dosage:300 mg/kg
-
Administration:p.o.; once weekly
-
Result:Slowed tumor growth rate by 49% compared to controls.
Prolonged median overall survival from treatment initiation to 35 days vs. 29 days in controls.
Reduced mRNA levels of Notch targets Hes1 (significantly), Hes5 (47% to 75%), and Hey1 (37%).
Reduced mRNA levels of stem cell markers Nanog (42% to 75%), nestin (36% to 43%), and CD133 (46%).
Increased mRNA levels of glial differentiation marker GFAP by 165% to 201%.
-
Animal Model:Athymic (nu/nu) (Harlan, orthotopic xenografts from luciferase-transduced temozolomide-sensitive 040821 glioblastoma neurospheres injected into right striatum)[7]
-
Dosage:300 mg/kg
-
Administration:p.o.; once weekly
-
Result:Slowed tumor growth rate by 62% compared to controls.
Prolonged median overall survival from treatment initiation to 40 days vs. 28 days in controls.
Reduced mRNA levels of Notch targets Hes1 (significantly), Hes5 (47% to 75%), and Hey1 (significantly).
Reduced mRNA levels of stem cell marker Nanog (42% to 75%).
Increased mRNA levels of neuronal differentiation marker MAP2 by 28%.
-
Animal Model:Athymic (nu/nu) (Harlan, orthotopic xenografts from luciferase-transduced HSR-GBM1 glioblastoma neurospheres injected into right striatum)[7]
-
Dosage:300 mg/kg
-
Administration:p.o.; once weekly; 5 weeks
-
Result:Slowed tumor growth significantly compared to controls.
Reduced mean cross-sectional tumor area at injection site by 76% compared to controls.
Reduced mean mitotic index by 56% compared to controls.
Reduced mRNA levels of Notch targets Hes1 (significantly), Hes5 (47% to 75%), and Hey1 (66%).
Reduced mRNA levels of stem cell markers Nanog (42% to 75%), nestin (36% to 43%), and CD133 (46%).
Increased mRNA levels of glial differentiation marker GFAP by 165% to 201%.
Reduced neurospheres over 100 μm in size by 98% compared to controls.
Reduced mean neurosphere size from 144 μm to 45 μm compared to controls.
Yielded propagable neurospheres from only 3 of 7 treated tumors vs. 4 of 5 control tumors.
-
Animal Model:Athymic (nu/nu) (Harlan, secondary orthotopic xenografts from passage 2 neurospheres isolated from MRK 003-treated primary HSR-GBM1 glioblastoma xenografts injected into right striatum)[7]
-
Dosage:300 mg/kg (prior in vivo treatment)
-
Administration:p.o.; once weekly; 5 weeks (prior in vivo treatment)
-
Result:Prolonged median overall survival to 78 days vs. 60 days in controls (P < 0.05).
Maintained suppressed mRNA levels of Notch targets Hes1, Hes5, and Hey1.
Reduced mRNA levels of stem cell markers CD133 and SOX2 significantly.
-
Animal Model:FoxN1nu/nu athymic nude mice (ovariectomised, estradiol supplemented, orthotopic xenograft model)[3]
-
Dosage:100 mg/kg (in combination with trastuzumab 10 mg/kg)
-
Administration:p.o.; 3 days on, 4 days off; i.p. (trastuzumab, once weekly)
-
Result:Showed no statistically significant effect on tumour growth compared to vehicle or trastuzumab alone during treatment phase.
Resulted in 0% tumour recurrence post-treatment, with all mice remaining tumour-free up to 40 weeks.
Significantly reduced transcript levels of Notch target genes HEY1 and Deltex1 compared to vehicle.
Abrogated the trastuzumab-induced 2-4-fold increase in HEY1 and 20-fold increase in Deltex1 transcripts.
Induced vast numbers of pyknotic nuclei, almost undetectable Ki67-positive proliferative cells, and a 40% increase in TUNEL-positive apoptotic cells compared to single-agent treatments.
Reduced phosphorylated ERK1/2 and AKT1 to almost undetectable levels, associated with increased PTEN protein levels; reduced phosphorylated ErbB-2 by 60% compared to vehicle.
-
Animal Model:FoxN1nu/nu athymic nude mice (ovariectomised, estradiol supplemented, orthotopic xenograft model)[3]
-
Dosage:100 mg/kg (in combination with lapatinib 100 mg/kg)
-
Administration:p.o.; 3 days on, 4 days off; p.o. (lapatinib, twice daily for 5 days)
-
Result:Showed no statistically significant effect on tumour growth compared to vehicle alone.
Produced a significant reduction in tumour growth at week 13 when combined with lapatinib compared to vehicle, lapatinib alone, or MRK-003 alone.
Reduced Ki67-positive proliferative cells by 75-90% compared to vehicle when combined with lapatinib.
Increased TUNEL-positive apoptotic cells 10-fold compared to vehicle when combined with lapatinib.
Reduced phosphorylated ErbB-2 by 40% compared to vehicle alone; the combination had little effect on phosphorylated ErbB-2 but reduced phosphorylated ERK1/2 and AKT1 compared to all other treatments.
-
Animal Model:BalbC nude mice[2]
-
Dosage:75 mg/kg; 150 mg/kg; 300 mg/kg; 450 mg/kg (three cycles)
-
Administration:p.o.; once weekly; three cycles; once weekly for 2 weeks
-
Result:Showed dose-dependent inhibition of BH450 tumor growth.
Reduced Ki67-positive cells from ~52% to ~13% with 300 mg/kg dosing.
Downregulated Hes1 protein levels with 300 mg/kg dosing.
Caused no significant effect on tumor cell apoptosis (TUNEL staining) with 300 mg/kg dosing.
Resulted in % treated versus control (T/C) values for tumor weight ranging from <40% to 100% across 99 BH tumor lines treated with 300 mg/kg once weekly for 2 weeks.
-
Animal Model:FoxN1nu/nu athymic nude mice (orthotopic xenograft model of trastuzumab-resistant cells)[3]
-
Dosage:100 mg/kg (in combination with trastuzumab 10 mg/kg)
-
Administration:p.o.; 3 days on, 4 days off; i.p. (trastuzumab, once weekly)
-
Result:Showed no effect on tumour growth compared to vehicle or trastuzumab alone.
Reduced the rate of tumour growth by almost 50% when combined with trastuzumab compared to single-agent treatments, though this effect did not reach statistical significance.
-
Animal Model:FVB/N (female, 6-8 weeks old, syngeneic subcutaneous tumor model)[5]
-
Dosage:150 mg/kg
-
Administration:p.o.; 3 consecutive days followed by 4 days rest, repeated once
-
Result:Shrank tumors in 6 mice and induced complete tumor regression in 10 mice during the 2-week dosing period.
Induced complete regression in 3 additional mice with small palpable tumors in the 2 weeks after the last dose.
Achieved 100% recurrence-free survival for up to 1 year post-treatment in all 13 treated mice.
Induced apoptosis in ~25% of tumor cells (compared to ~1% in vehicle-treated mice).
Reduced the frequency of Ki-67-positive proliferating tumor cells.
Skewed tumor cell differentiation toward the myoepithelial lineage.
Reduced transcript levels of the Notch target gene Hey1 by approximately sixfold in tumor tissue.
- Human pluripotent stem cell endothelial-cell differentiation
- Vascular/Branching Fractal Analysis
- Annexin V plus membrane-impermeant dye apoptosis staining
- BrdU Incorporation Assay
- Somatic Cell Culture
- CFSE Dye Dilution Proliferation Assay
- Dye-dilution cell tracking and proliferation staining
- CCK-8/WST-8 Cell Proliferation Assay
- Protocol for Cell Cycle
- Cell Counting-Based Growth Curve Assay
- Colony Formation (Clonogenic) Assay
- Breast Cancer Modeling
- Cell Viability Determination by MTT Colorimetric Assay
- EdU Incorporation Assay (Click Chemistry-Based DNA Synthesis Measurement)
- Ki-67 Immunostaining Proliferation Assay
- Detection of Apoptosis
- TUNEL staining for apoptotic DNA fragmentation
- PCNA Immunodetection Proliferation Assay
- Protocol for Cell Counting and Cell Density Analysis
- Endothelial Tube Formation Assay
- Apoptosis Solutions
- Notch Pathway Solutions
- MTT Cell Proliferation Assay
- Endothelial Cell Migration/Angiogenic Sprouting Assay


Chemical Information
-
CAS. Nr. 623165-93-5
-
Molecular Weight 551.59
-
Formel C25H31F6N3O2S
-
SMILES
FC(F)(F)CN(C[C@]1(N2)[C@H]3CC4=C(C=CC(/C=C/CN5CCC(C(F)(F)F)CC5)=C4)C[C@@H]1CC3)S2(=O)=O
-
Versand
Room temperature in continental US; may vary elsewhere.
-
Speicherung
Please store the product under the recommended conditions in the Certificate of Analysis.


Reinheit & Dokumentation
Verweise
[1]. Konishi J, et al. Gamma-secretase inhibitor prevents Notch3 activation and reduces proliferation in human lung cancers. Cancer research. 2007 Sep 01;67(17):8051-7. [Content Brief]
[2]. Watters JW et al. De novo discovery of a gamma-secretase inhibitor response signature using a novel in vivo breast tumor model. Cancer Res. 2009 Dec 1;69(23):8949-8957. [Content Brief]
[3]. Pandya K, et al. Targeting both Notch and ErbB-2 signalling pathways is required for prevention of ErbB-2-positive breast tumour recurrence. British journal of cancer. 2011 Sep 06;105(6):796-806. [Content Brief]
[4]. Ramakrishnan V, et al. MRK003, a γ-secretase inhibitor exhibits promising in vitro pre-clinical activity in multiple myeloma and non-Hodgkin's lymphoma. Leukemia. 2012 Feb;26(2):340-8. [Content Brief]
[5]. Kondratyev M, et al. Gamma-secretase inhibitors target tumor-initiating cells in a mouse model of ERBB2 breast cancer. Oncogene. 2012 Jan 05;31(1):93-103. [Content Brief]
[6]. Mizuma M, et al. The gamma secretase inhibitor MRK-003 attenuates pancreatic cancer growth in preclinical models. Molecular cancer therapeutics. 2012 Sep;11(9):1999-2009. [Content Brief]
[7]. Chu Q, et al. Prolonged inhibition of glioblastoma xenograft initiation and clonogenic growth following in vivo Notch blockade. Clinical cancer research : an official journal of the American Association for Cancer Research. 2013 Jun 15;19(12):3224-33. [Content Brief]

Calculators
Konzentration (Stammlösung) × Volumen (Stammlösung) = Konzentration (Ziellösung) × Volumen (Ziellösung)


MRK 003 Related Classifications
HY-15211 Related Classifications
 Powered by Bioz