YD23
Based on 1 Customer Validation
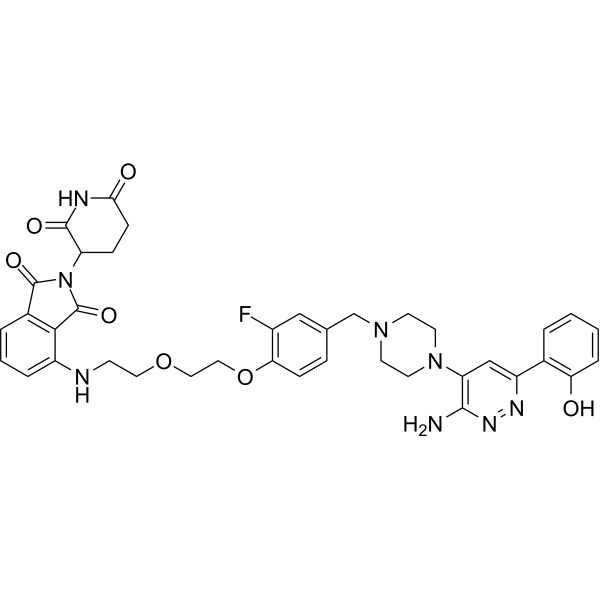
YD23 is a selective SMARCA2 PROTAC degrader with DC50 values of 64 nM and 297 nM in H1792 cells and H1975 cells. YD23 induces degradation of SMARCA2, which is synthetic lethal to SMARCA4. YD23 reduces chromatin accessibility only in SMARCA4 deficient cells, including cell cycle and cell growth regulatory genes. YD23 selectively inhibits growth of SMARCA4 mutant lung cancer cells. YD23 has potent tumor growth inhibitory activity in SMARCA4-mutant xenografts. YD23 can be used for the study of non-small cell lung cancer (NSCLC).
(Pink: SMARCA2 ligand (HY-44012); Blue: Cereblon ligand (HY-41547); Black: linker).
For research use only. We do not sell to patients.
- Purity : 98.80%
- CAS No.: 2951015-29-3
- Formula: C38H39FN8O7
- Molecular Weight:738.76
-
Storage:Powder -20°C, 3 years , 4°C, 2 years ; In solvent -80°C, 6 months , -20°C, 1 month
Biological Activity
Description
IC50 & Target
[2]|
Cereblon |
In Vitro
YD23 (0.0001-10 μM, 12 days) selectively inhibits growth of SMARCA4-mutant ung cancer cell lines compared to SMARCA4-WT cells (median IC50 of 0.11 μM and 6.0 μM, for each group, respectively)[2].
YD23 (1 μM, 96 h)-downregulated genes are significantly enriched in cell cycle-related pathways such as E2F target genes, G2/M checkpoint, and mitotic spindle[2].
MedChemExpress (MCE) has not independently confirmed the accuracy of these methods. They are for reference only. Further protocols information, click here.
In Vivo
MedChemExpress (MCE) has not independently confirmed the accuracy of these methods. They are for reference only.
-
Animal Model:Human tumor xenografts of three SMARCA4-mutated lung cancers (H1568, H322, H2126) established in NU/J nude female mice[1]
-
Dosage:12.5 mg/kg
-
Administration:Intraperitoneal injection (i.p.), once daily for 25-26 days
-
Result:Showed significant tumor growth inhibition (TGI) of 72% (H1568), 49% (H322), and 44% (H2126).
Effectively degraded SMARCA2 in vivo.
Showed a slight weight loss (<10%), indicating good tolerance.
Chemical Information
-
CAS No. 2951015-29-3
-
Appearance Solid
-
Molecular Weight 738.76
-
Formula C38H39FN8O7
-
Color Light yellow to yellow
-
SMILES
O=C1N(C2CCC(NC2=O)=O)C(C3=C1C=CC=C3NCCOCCOC4=C(F)C=C(CN5CCN(C6=C(N)N=NC(C7=C(O)C=CC=C7)=C6)CC5)C=C4)=O
-
Shipping
Room temperature in continental US; may vary elsewhere.
-
Storage
Powder -20°C 3 years 4°C 2 years In solvent -80°C 6 months -20°C 1 month
Solvent & Solubility
In Vitro:
DMSO : 100 mg/mL (135.36 mM; Need ultrasonic; Hygroscopic DMSO has a significant impact on the solubility of product, please use newly opened DMSO)
Please refer to the solubility information to select the appropriate solvent. Once prepared, please aliquot and store the solution to prevent product inactivation from repeated freeze-thaw cycles.
Storage method and period of stock solution: -80°C, 6 months; -20°C, 1 month. When stored at -80°C, please use it within 6 months. When stored at -20°C, please use it within 1 month.
Please refer to the solubility information to select the appropriate solvent. Once prepared, please aliquot and store the solution to prevent product inactivation from repeated freeze-thaw cycles.
Storage method and period of stock solution: -80°C, 6 months; -20°C, 1 month. When stored at -80°C, please use it within 6 months. When stored at -20°C, please use it within 1 month.
Concentration (start) × Volume (start) = Concentration (final) × Volume (final)
Protocols
-
Research Protocol for Epigenomic Data Analysis
Epigenomic data analysis identifies genome-wide regulatory features that influence gene expression, chromatin state, and phenotype without changing the underlying DNA sequence. In this strategy, the core regulatory layer includes chromatin accessibility, transcription-factor or histone-mark occupancy, DNA methylation, and chromatin-state patterns; these features are measured by sequencing-based assays and interpreted as regulatory elements, promoters, enhancers, repressive domains, methylated cytosines, or candidate phenotype-associated chromatin programs. The literature links epigenomic features to phenotype by showing that functional genomic elements can be mapped across human cell types and tissues, and that integrated epigenomic maps reveal cell-type-specific regulatory programs. ENCODE integrated transcription, chromatin accessibility, transcription-factor occupancy, and histone modification data to annotate functional elements in the human genome, while the Roadmap Epigenomics Co
-
BrdU Incorporation Assay
Bromodeoxyuridine (BrdU) incorporation assay is based on the principle that BrdU, a thymidine analog, is incorporated into newly synthesized DNA during the S phase of the cell cycle, thereby serving as a marker of DNA replication and cellular proliferation. Incorporated BrdU can be detected using anti-BrdU antibodies following DNA denaturation, enabling visualization or quantification of proliferating cells through immunochemical detection methods such as immunofluorescence or immunohistochemistry.
-
Somatic Cell Culture
A method of simulating the in vivo environment in vitro to maintain the cell growth, differentation and main functions.
-
Patient-Derived Orthotopic Xenograft (PDOX)
Patient-derived orthotopic xenograft (PDOX) modeling implants fresh patient tumor tissue or patient-derived tumor cells into the anatomically corresponding organ or tissue site of immunodeficient mice, usually by surgical orthotopic implantation, to preserve patient tumor histology, local microenvironmental context, invasion, metastatic behavior, and treatment-response features better than subcutaneous implantation. PDOX readouts include tumor engraftment, orthotopic tumor growth, local invasion, metastasis, recurrence after resection, histologic similarity to the donor tumor, biomarker retention, molecular concordance, survival, and response or resistance to therapy. PDOX models are used for preclinical drug testing and individualized therapy evaluation, but engraftment success varies by tumor type and specimen quality.
-
Protocol for Cell Cycle
Cell-cycle analysis by flow cytometry measures DNA content in single cells to estimate the fraction of cells in G0/G1, S, and G2/M phases. Propidium iodide intercalates into DNA, and after RNA removal with RNase, fluorescence intensity reflects cellular DNA content: 2N cells are assigned to G0/G1, cells between 2N and 4N to S phase, and 4N cells to G2/M. DNA-content analysis alone cannot reliably separate G0 from G1 or G2 from M. Ki-67 can distinguish quiescent G0 cells from cycling cells, EdU or BrdU incorporation marks active DNA synthesis in S phase, and phospho-histone H3 staining identifies mitotic cells within the 4N population.
-
CCK-8/WST-8 Cell Proliferation Assay
The CCK-8/WST-8 assay is based on the reduction of the water-soluble tetrazolium salt WST-8 to a water-soluble formazan product by cellular dehydrogenases in metabolically active cells, where the generated formazan amount is proportional to the number of living cells and is quantified by measuring absorbance in the visible range, providing a colorimetric readout for cell viability and proliferation assessment. This class of tetrazolium-based assays improves upon earlier MTT-based systems by producing a water-soluble formazan, eliminating the need for organic solubilization steps and enabling direct spectrophotometric measurement in culture medium.
-
Cell Counting-Based Growth Curve Assay
Cell counting-based growth curve assays quantify cell proliferation by directly measuring changes in viable cell number over time using manual or automated counting methods such as hemocytometer-based counting or instrument-assisted cell enumeration, enabling construction of growth curves that reflect population expansion dynamics in response to culture conditions. A widely used approach is trypan blue exclusion with hemocytometer counting, where membrane-compromised (non-viable) cells take up the dye, allowing discrimination between viable and non-viable cells while simultaneously enabling total cell number quantification. Repeated sampling across time points allows estimation of proliferation rate, growth phases, and comparative growth kinetics between experimental conditions.
-
Cell Viability Determination by MTT Colorimetric Assay
The following protocol uses the MTT colorimetric assay as a classic literature-established method for assessing cell viability/metabolic activity in cultured mammalian cells. MTT[3-(4,5-dimethylthiazol-2-yl)-2,5-diphenyltetrazolium bromide] is reduced by metabolically active cells to a colored formazan product; the amount of formazan is quantified spectrophotometrically and provides an indirect measure of metabolically active viable cells. Importantly, MTT reduction reflects cellular oxidoreductase/metabolic activity rather than an absolute direct count of living cells, so changes in cellular metabolism can alter the signal independently of cell number.
-
Flow cytometric DNA-content cell-cycle staining
Flow cytometric DNA-content cell-cycle staining measures the fluorescence intensity of DNA-bound fluorochromes in single cells or nuclei to estimate DNA content distributions, allowing assignment of populations to G0/G1, S, and G2/M phases by DNA histogram deconvolution. Propidium iodide (PI) intercalates into DNA, and PI fluorescence is proportional to cellular DNA content when staining is performed under conditions that make DNA accessible and minimize non-DNA signal. Cells with G2/M DNA content are expected to show approximately twice the fluorescence intensity of G0/G1 cells, while S-phase cells occupy intermediate fluorescence values. PI-based DNA-content analysis can also detect cells with fractional DNA content, often reported as sub-G1, when DNA fragmentation and extraction during staining reduce retained DNA signal in apoptotic cells. DAPI is an alternative DNA fluorochrome for univariate DNA-content analysis, while bivariate approaches combining DNA content with proliferation
-
Protocol for Cell Counting and Cell Density Analysis
Cell counting and cell-density analysis estimate the number of cells in a known volume or field area. Manual hemocytometer counting uses a chamber of defined geometry to convert counted cells into cells/mL, while automated counters and image-analysis workflows detect cell objects from optical, brightfield, fluorescence, impedance, or digital-image features. Trypan blue viability counting is based on dye exclusion: viable cells with intact membranes exclude dye, while non-viable cells with compromised membranes stain blue. The readout is total cell density, viable-cell density, dead-cell density, and percent viability. Cell density can also be estimated from microscopy images by counting objects per image area, from flow cytometry using calibrated volume or reference particles, or from in situ microscopy in bioreactors after calibration against reference methods such as hemocytometer or flow cytometry.
-
Patient-Derived Xenograft (PDX)
Patient-derived xenograft (PDX) models are generated by engrafting primary human tumor tissue directly into immunodeficient mice, allowing in vivo propagation of patient tumor biology without initial in vitro adaptation. These models are used to preserve key histopathological and molecular characteristics of the original tumor and enable assessment of tumor growth dynamics and therapeutic response in a living organism. The biological readout is tumor engraftment and subsequent growth in the murine host, which reflects the ability of human tumor cells to survive, vascularize, and expand in an immunocompromised microenvironment.
-
MTT Cell Proliferation Assay
The MTT assay is a colorimetric endpoint assay for estimating viable cell number, cell growth, cytotoxicity, or cell activation in cultured mammalian cells. Living cells reduce the yellow tetrazolium salt MTT into purple/blue formazan, while dead cells do not generate the same signal; the resulting color can be quantified with a multiwell spectrophotometer. MTT reduction is commonly interpreted as a readout of metabolic activity that often correlates with viable cell number, but it should not be treated as a direct cell-counting method unless the assay is optimized for the cell type and experimental condition. Studies show that MTT reduction can involve mitochondrial and non-mitochondrial reducing systems, and formazan may accumulate in intracellular lipid droplets rather than simply marking mitochondria.
-
Subcutaneous Cell-Line-Derived Xenograft
Subcutaneous cell-line-derived xenograft (CDX) models are established by implanting cultured human cancer cell lines into immunodeficient mice, where the injected cells form localized tumors that can be monitored in vivo as a measure of tumorigenic potential, growth kinetics, and treatment response. These models are widely used in oncology research because they allow reproducible tumor formation and enable comparative assessment of tumor growth between different cell lines or genetic manipulations in a controlled in vivo microenvironment. Subcutaneous implantation of cancer cells in immunodeficient mice is a standard approach for evaluating tumor growth behavior and therapeutic response across multiple cancer types, including prostate, esophageal, pancreatic, and colon cancer models.
-
Orthotopic Cell-Line Xenograft
Orthotopic cell-line xenograft models involve implantation of human cancer cell lines into the anatomically corresponding organ of immunodeficient mice to reproduce tumor growth within a native microenvironment, enabling more clinically relevant tumor behavior compared with subcutaneous models. These models are widely used because orthotopic placement better recapitulates tumor progression, including invasion and metastatic spread, which are often underrepresented in heterotopic implantation systems. Compared with conventional xenografts, orthotopic implantation is described as more technically complex but provides improved simulation of tumor-microenvironment interactions and metastatic behavior, making it particularly valuable for translational oncology research. Surgical orthotopic implantation approaches have been emphasized as enabling faithful reproduction of clinical cancer features, including metastasis and disease progression patterns that align with the tumor’s organ of origi
Purity & Documentation
-
Data Sheet (272 KB)
-
SDS (254 KB)
- English - EN (254 KB)
- Français - FR (254 KB)
- Deutsch - DE (254 KB)
- Norwegian - NO (254 KB)
- Español - ES (254 KB)
- Swedish - SV (254 KB)
- Italian - IT (254 KB)
- Korean - KR (254 KB)
- Portuguese - PT (254 KB)
-
Handling Instructions (2659 KB)
References
Complete Stock Solution Preparation Table
Please refer to the solubility information to select the appropriate solvent. Once prepared, please aliquot and store the solution to prevent product inactivation from repeated freeze-thaw cycles.
Storage method and period of stock solution: -80°C, 6 months; -20°C, 1 month. When stored at -80°C, please use it within 6 months. When stored at -20°C, please use it within 1 month.
| Optional Solvent | Concentration Solvent Mass | 1 mg | 5 mg | 10 mg | 25 mg |
|---|---|---|---|---|---|
| DMSO | 1 mM | 1.3536 mL | 6.7681 mL | 13.5362 mL | 33.8405 mL |
| 5 mM | 0.2707 mL | 1.3536 mL | 2.7072 mL | 6.7681 mL | |
| 10 mM | 0.1354 mL | 0.6768 mL | 1.3536 mL | 3.3840 mL | |
| 15 mM | 0.0902 mL | 0.4512 mL | 0.9024 mL | 2.2560 mL | |
| 20 mM | 0.0677 mL | 0.3384 mL | 0.6768 mL | 1.6920 mL | |
| 25 mM | 0.0541 mL | 0.2707 mL | 0.5414 mL | 1.3536 mL | |
| 30 mM | 0.0451 mL | 0.2256 mL | 0.4512 mL | 1.1280 mL | |
| 40 mM | 0.0338 mL | 0.1692 mL | 0.3384 mL | 0.8460 mL | |
| 50 mM | 0.0271 mL | 0.1354 mL | 0.2707 mL | 0.6768 mL | |
| 60 mM | 0.0226 mL | 0.1128 mL | 0.2256 mL | 0.5640 mL | |
| 80 mM | 0.0169 mL | 0.0846 mL | 0.1692 mL | 0.4230 mL | |
| 100 mM | 0.0135 mL | 0.0677 mL | 0.1354 mL | 0.3384 mL |