



Alpha-Naphthoflavone
Based on 10 publication(s) in Google Scholar
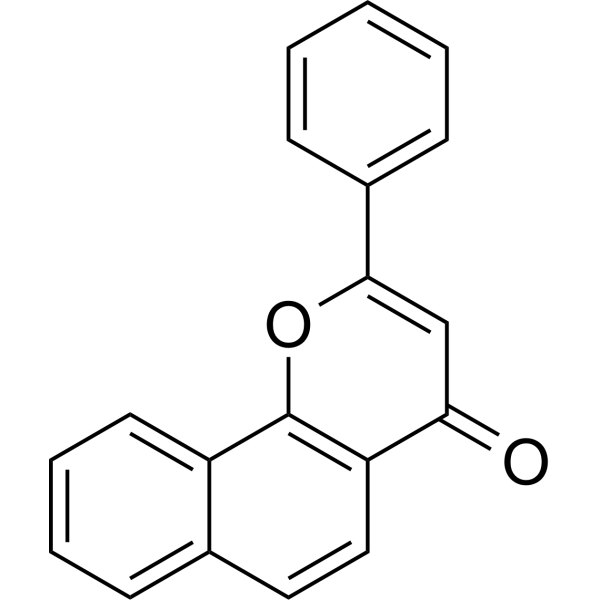
Alpha-Naphthoflavone is an orally active flavonoid that is a potent, competitive inhibitor of aromatase with the IC50 and Ki values are 0.5 and 0.2 μM. Alpha-Naphthoflavone can inhibit cell proliferation and induce apoptosis.
For research use only. We do not sell to patients.
- Purity : 99.76%
- CAS No.: 604-59-1
- Formula: C19H12O2
- Molecular Weight:272.30
-
Storage:
4°C, protect from light
* In solvent : -80°C, 6 months; -20°C, 1 month (protect from light)

To place orders, for customer services and technical support, please contact: MedChemExpress USA
Tel: 609-228-6898 E-mail: [email protected] [email protected]


-
 Biological Activity
-
Chemical Information
-
Solvent & Solubility
- Protocols
- Purity & Documentation
- References
-
 Help & FAQs


-
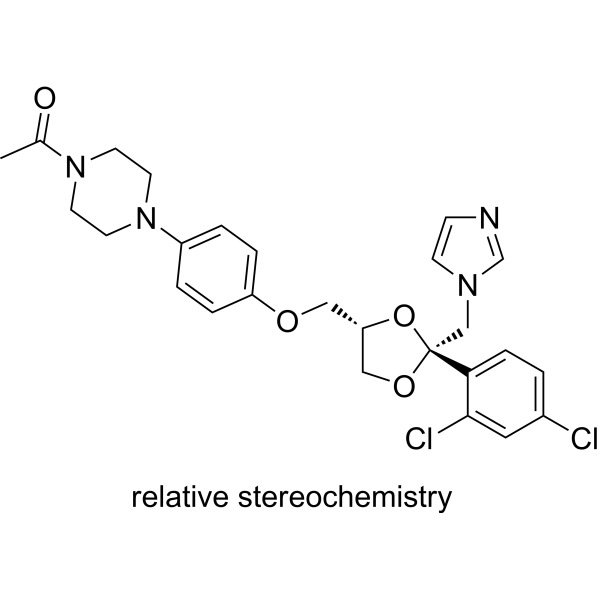
HY-B0105
KetoconazoleCYP3A4 Inhibitor -
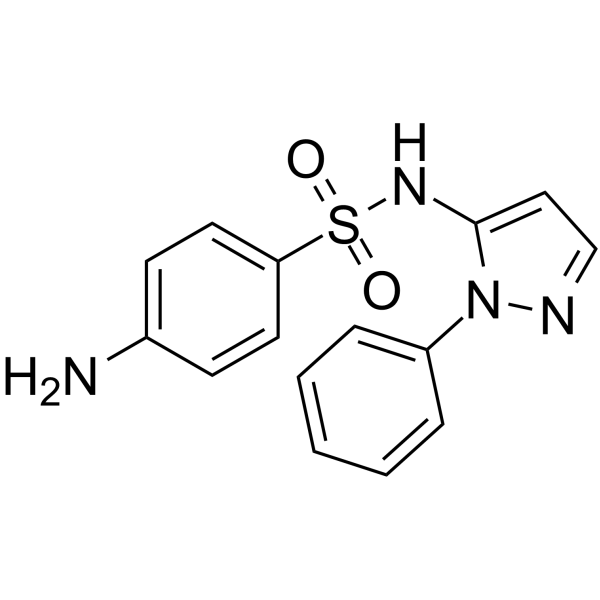
HY-B1218
SulfaphenazoleCYP2C9 Inhibitor -
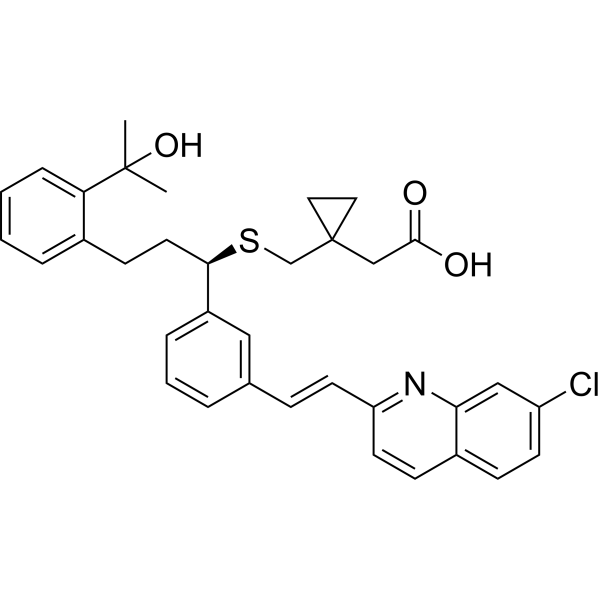
HY-13315A
MontelukastCysLT1 Antagonist -
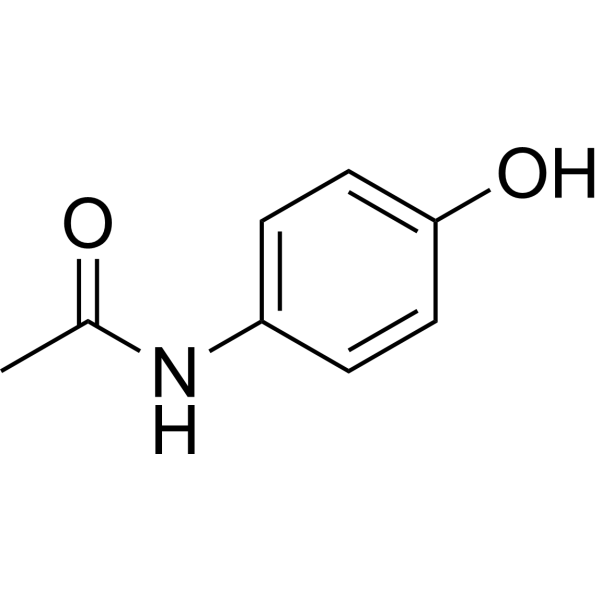
HY-66005
AcetaminophenCOX-2 Inhibitor -
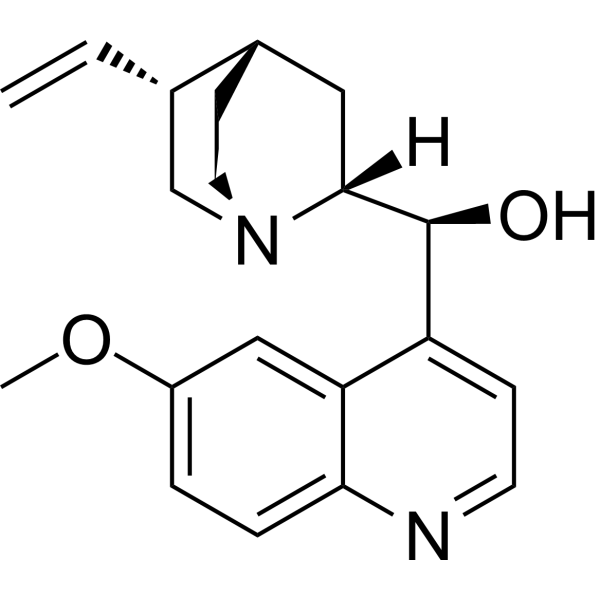
HY-B1751
Quinidine (15% dihydroquinidine)Anti-arrythmic Agent -
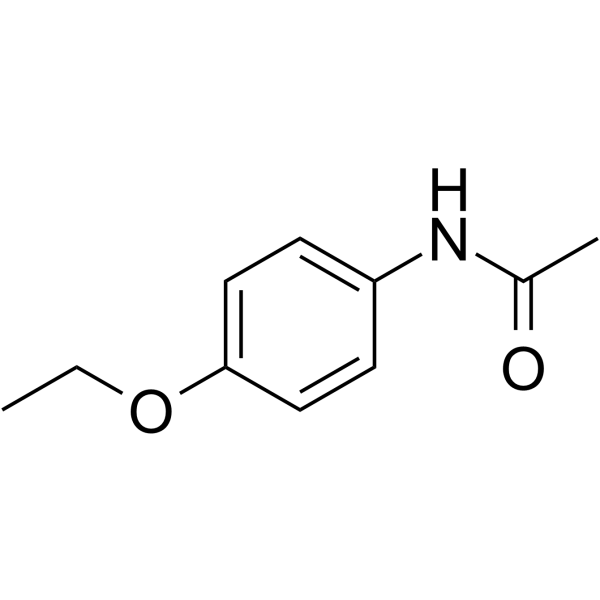
HY-B0476
PhenacetinCOX-3 Inhibitor -
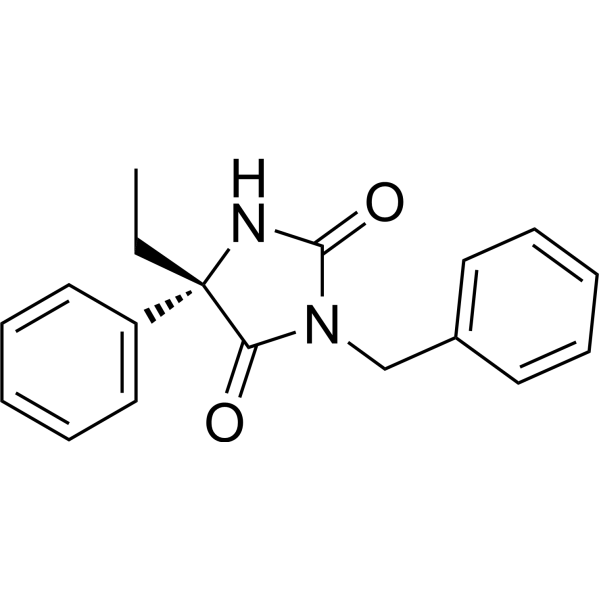
HY-W013268
(S)-(+)-N-3-BenzylnirvanolCYP2C19 Inhibitor -
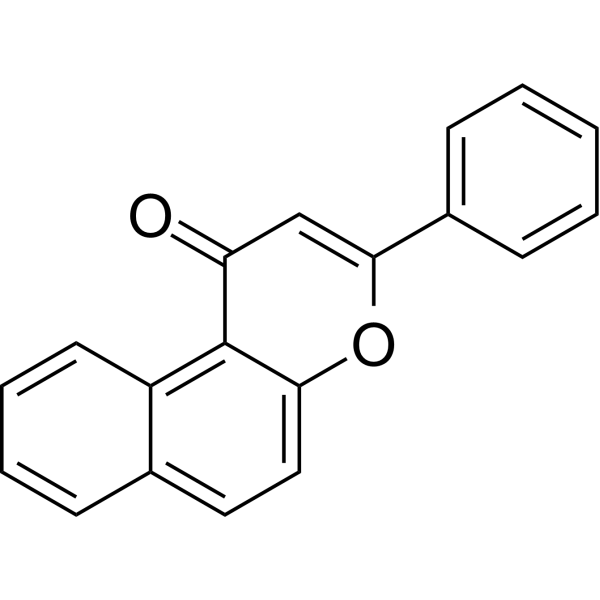
HY-114740
β-NaphthoflavoneAhR agonist -

HY-125833R
Alpha-Naphthoflavone (Standard)Aromatase Inhibitor -
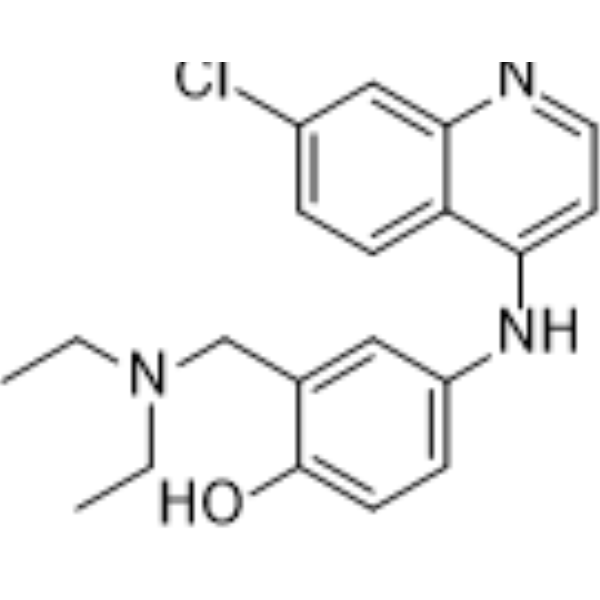
HY-B1322A
AmodiaquineAntimalarial Agent -
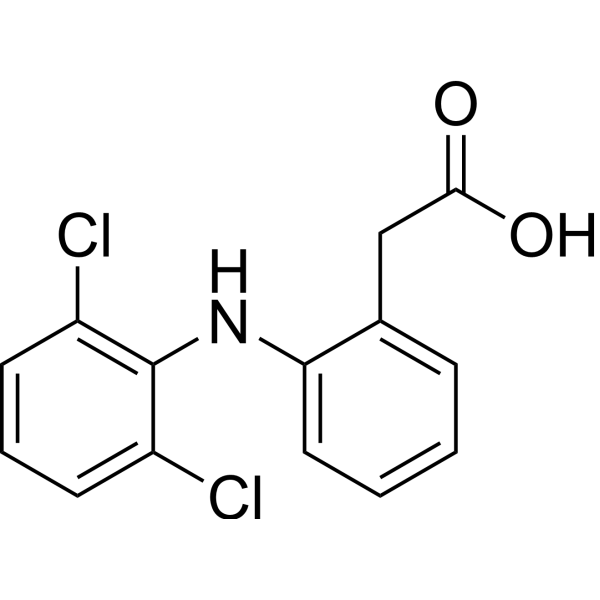
HY-15036
DiclofenacCOX Inhibitor -
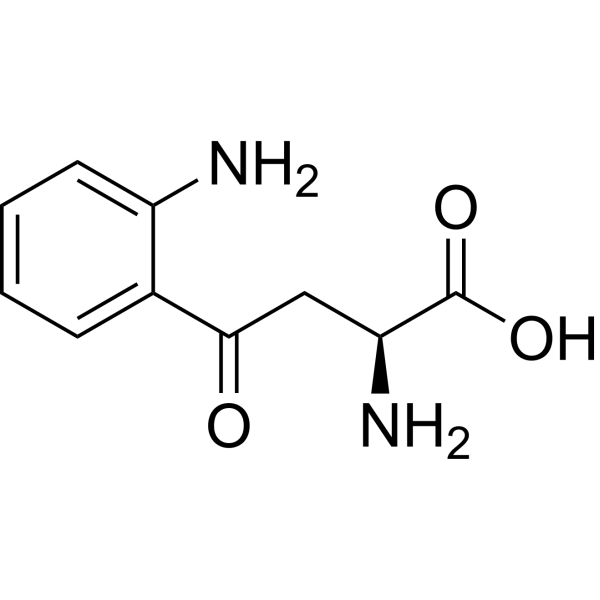
HY-104026
L-KynurenineAryl Hydrocarbon Receptor Agonist
Publications Citing Use of MedChemExpress (MCE) Alpha-Naphthoflavone
More- Phytomedicine. 2023 Jun:114:154774. [Abstract]
- J Hazard Mater. 2021 Aug 15:416:125764. [Abstract]
- Cell Rep. 2025 Dec 10;44(12):116673. [Abstract]
- Environ Pollut. 2026 May 1:396:127849. [Abstract]
- Environ Pollut. 2024 Aug 15:355:124214. [Abstract]
- Pharmaceutics. 2025 Mar 26;17(4):423. [Abstract]
- J Agric Food Chem. 2022 Mar 2;70(8):2520-2528. [Abstract]
- Ecotoxicol Environ Saf. 2024 Nov 15:287:117266. [Abstract]
- AAPS J. 2021 Jun 28;23(4):91. [Abstract]
- Research Square Preprint. 2023 Oct 28.


Biological Activity
Description
IC50 & Target
|
Aromatase |
Cellular Effect
|
Cell Line

|
Type | Value | Description | References |
|---|---|---|---|---|
| 2008 | IC50 |
11.3 μM
Compound: 14
|
Inhibition of MRP1 (unknown origin) expressed in human 2008 cells assessed as calcein-AM accumulation preincubated for 30 mins before calcein-AM addition measured up to 90 mins by fluorescence assay
Inhibition of MRP1 (unknown origin) expressed in human 2008 cells assessed as calcein-AM accumulation preincubated for 30 mins before calcein-AM addition measured up to 90 mins by fluorescence assay
|
[PMID: 23851114] |
| A2780 ADR | IC50 |
24.6 μM
Compound: 14
|
Inhibition of p-glycoprotein (unknown origin) expressed in human A2780Adr cells assessed as calcein-AM accumulation preincubated for 30 mins before calcein-AM addition measured up to 90 mins by fluorescence assay
Inhibition of p-glycoprotein (unknown origin) expressed in human A2780Adr cells assessed as calcein-AM accumulation preincubated for 30 mins before calcein-AM addition measured up to 90 mins by fluorescence assay
|
[PMID: 23851114] |
| A549 | IC50 |
32.83 nM
Compound: ANF
|
Reversal of DMBA-stimulated PTX resistance in human A549 cells assessed as PTX IC50 for inhibition of cell viability at 10 uM incubated for 36 hrs in presence of DMBA and PTX by MTT assay (Rvb = 119 +/-2.62 nM)
Reversal of DMBA-stimulated PTX resistance in human A549 cells assessed as PTX IC50 for inhibition of cell viability at 10 uM incubated for 36 hrs in presence of DMBA and PTX by MTT assay (Rvb = 119 +/-2.62 nM)
|
[PMID: 38509663] |
| HEK293 | EC50 |
40 μM
Compound: 4; ANF
|
Inhibition of human CYP1B1 expressed in HEK293 cells assessed as potentiation of cisplatin-induced cytotoxicity by measuring cisplatin EC50 at 0.016 uM by MTT assay (Rvb = 61 +/- 8 uM)
Inhibition of human CYP1B1 expressed in HEK293 cells assessed as potentiation of cisplatin-induced cytotoxicity by measuring cisplatin EC50 at 0.016 uM by MTT assay (Rvb = 61 +/- 8 uM)
|
[PMID: 28222316] |
| HEK293 | IC50 |
>50 μM
Compound: 4; ANF
|
Inhibition of human liver CYP1B1 expressed in HEK293 cells using 7-ethoxyresorufin as substrate preincubated for 30 mins followed by substrate addition measured after 60 mins by fluorescence assay
Inhibition of human liver CYP1B1 expressed in HEK293 cells using 7-ethoxyresorufin as substrate preincubated for 30 mins followed by substrate addition measured after 60 mins by fluorescence assay
|
[PMID: 28222316] |
| HEK293 | IC50 |
>50 μM
Compound: 4; ANF
|
Inhibition of human liver CYP1B1 expressed in HEK293 cells using CEC as substrate preincubated for 30 mins followed by substrate addition measured after 60 mins by fluorescence assay
Inhibition of human liver CYP1B1 expressed in HEK293 cells using CEC as substrate preincubated for 30 mins followed by substrate addition measured after 60 mins by fluorescence assay
|
[PMID: 28222316] |
| HEK293 | IC50 |
>10000 nM
Compound: 3; ANF
|
Inhibition of recombinant human liver CYP1B1 expressed in HEK293 cells using 7-ethoxyresorufin as substrate pretreated for 30 mins followed by substrate addition measured for 60 mins by EROD assay
Inhibition of recombinant human liver CYP1B1 expressed in HEK293 cells using 7-ethoxyresorufin as substrate pretreated for 30 mins followed by substrate addition measured for 60 mins by EROD assay
|
[PMID: 28259840] |
| HEK293 | IC50 |
>10000 nM
Compound: 3; ANF
|
Inhibition of recombinant human liver CYP1A1 expressed in HEK293 cells using 7-ethoxyresorufin as substrate pretreated for 30 mins followed by substrate addition measured for 60 mins by EROD assay
Inhibition of recombinant human liver CYP1A1 expressed in HEK293 cells using 7-ethoxyresorufin as substrate pretreated for 30 mins followed by substrate addition measured for 60 mins by EROD assay
|
[PMID: 28259840] |
| HEK293 | IC50 |
>10 μM
Compound: ANF
|
Inhibition of human CYP1A1 expressed in HEK293 cells using fluorogenic substrate 7-ethoxyresorufin as substrate preincubated for 30 mins followed by substrate addition measured for 60 mins by fluorescence assay
Inhibition of human CYP1A1 expressed in HEK293 cells using fluorogenic substrate 7-ethoxyresorufin as substrate preincubated for 30 mins followed by substrate addition measured for 60 mins by fluorescence assay
|
[PMID: 28711350] |
| HEK293 | IC50 |
>10 μM
Compound: ANF
|
Inhibition of human CYP1B1 expressed in HEK293 cells using fluorogenic 7-ethoxyresorufin as substrate preincubated for 30 mins followed by substrate addition measured for 60 mins by fluorescence assay
Inhibition of human CYP1B1 expressed in HEK293 cells using fluorogenic 7-ethoxyresorufin as substrate preincubated for 30 mins followed by substrate addition measured for 60 mins by fluorescence assay
|
[PMID: 28711350] |
| HeLa | IC50 |
4.98 μM
Compound: 69
|
Inhibition of DNA dependent protein kinase isolated from HeLa cells
Inhibition of DNA dependent protein kinase isolated from HeLa cells
|
[PMID: 15658870] |
| HepG2 | IC50 |
0.32 μM
Compound: alpha-naphthoflavone
|
Inhibition of TCDD-induced EROD activity in human HepG2 cells after 24 hrs
Inhibition of TCDD-induced EROD activity in human HepG2 cells after 24 hrs
|
[PMID: 15787451] |
| MCF7 | IC50 |
110.6 μM
Compound: ANF
|
Inhibition of CYP1B1 in TCDD-stimulated human MCF7 cells assessed as inhibition of anticancer drug resistance by measuring docetaxel cytotoxic IC50 at 5 uM after 48 hrs by MTT assay (Rvb = 139.8 +/- 11.5 microM)
Inhibition of CYP1B1 in TCDD-stimulated human MCF7 cells assessed as inhibition of anticancer drug resistance by measuring docetaxel cytotoxic IC50 at 5 uM after 48 hrs by MTT assay (Rvb = 139.8 +/- 11.5 microM)
|
[PMID: 25799264] |
| MCF7 | IC50 |
98.2 μM
Compound: ANF
|
Inhibition of CYP1B1 in TCDD-stimulated human MCF7 cells assessed as inhibition of anticancer drug resistance by measuring docetaxel cytotoxic IC50 at 10 uM after 48 hrs by MTT assay (Rvb = 139.8 +/- 11.5 microM)
Inhibition of CYP1B1 in TCDD-stimulated human MCF7 cells assessed as inhibition of anticancer drug resistance by measuring docetaxel cytotoxic IC50 at 10 uM after 48 hrs by MTT assay (Rvb = 139.8 +/- 11.5 microM)
|
[PMID: 25799264] |
| MCF7 | EC50 |
>20 μM
Compound: ANF
|
Antiproliferative activity against human MCF-7 cells overexpressing CYP1A1 assessed as reduction in cell viability
Antiproliferative activity against human MCF-7 cells overexpressing CYP1A1 assessed as reduction in cell viability
|
[PMID: 30448188] |
| MCF7 | IC50 |
>100 μM
Compound: ANF
|
Cytotoxicity against drug-resistant TCCD-induced human MCF7 cells overexpressing CYP1B1 assessed as reduction in cell viability after 48 hrs by MTT assay
Cytotoxicity against drug-resistant TCCD-induced human MCF7 cells overexpressing CYP1B1 assessed as reduction in cell viability after 48 hrs by MTT assay
|
[PMID: 31803401] |
| MCF7 | IC50 |
80.7 μM
Compound: ANF
|
Cytotoxicity against human MCF7 cells assessed as reduction in cell viability after 48 hrs by MTT assay
Cytotoxicity against human MCF7 cells assessed as reduction in cell viability after 48 hrs by MTT assay
|
[PMID: 31803401] |
| MDA-MB-231 | IC50 |
>100 μM
Compound: ANF
|
Cytotoxicity against human MDA-MB-231 cells assessed as reduction in cell viability after 48 hrs by MTT assay
Cytotoxicity against human MDA-MB-231 cells assessed as reduction in cell viability after 48 hrs by MTT assay
|
[PMID: 31803401] |
| MDCK-II | IC50 |
1.31 μM
Compound: 14
|
Inhibition of human BCRP expressed in MDCK2 cells assessed as accumulation of Hoechst 33342 preincubated for 30 mins before Hoechst 33342 addition measured after 120 mins by fluorescence assay
Inhibition of human BCRP expressed in MDCK2 cells assessed as accumulation of Hoechst 33342 preincubated for 30 mins before Hoechst 33342 addition measured after 120 mins by fluorescence assay
|
[PMID: 23851114] |
| MDCK-II | IC50 |
1.4 μM
Compound: 14
|
Inhibition of human BCRP expressed in MDCK2 cells assessed as accumulation of pheophorbide-A preincubated for 30 mins before pheophorbide-A addition measured after 120 mins by flow cytometry
Inhibition of human BCRP expressed in MDCK2 cells assessed as accumulation of pheophorbide-A preincubated for 30 mins before pheophorbide-A addition measured after 120 mins by flow cytometry
|
[PMID: 23851114] |
| NCI-H460 | IC50 |
481.4 nM
Compound: ANF
|
Synergistic anti-cancer activity of human PTX-resistant NCI-H460 cells assessed as PTX IC50 at 5 uM incubated for 48 hrs in presence of PTX by CCK8 assay
Synergistic anti-cancer activity of human PTX-resistant NCI-H460 cells assessed as PTX IC50 at 5 uM incubated for 48 hrs in presence of PTX by CCK8 assay
|
[PMID: 38692523] |
In Vitro
Alpha-Naphthoflavone (0.01-100 μM, 5 min) induces vascular relaxation by inducing extracellular calcium inflow and NO formation[2].
Alpha-Naphthoflavone (0.01-100 μM, 48 h) can inhibit HeLa cell proliferation, block the G1/S phase, and increase p53 level and apoptosis[3].
Alpha-Naphthoflavone (5, 10, 20, 40 μM, 24 h) can protect HepG2 hepatocytes treated with oleic acid (OA)[4].
MedChemExpress (MCE) has not independently confirmed the accuracy of these methods. They are for reference only.
-
Cell Line:HeLa
-
Concentration:0.01, 1, 10, 100 μM
-
Incubation Time:6 days
-
Result:Decreased cell proliferation in a dose-dependent manner with IC50 value of 36.81 μM.
-
Cell Line:HeLa
-
Concentration:50 μM
-
Incubation Time:12, 24, 36 h
-
Result:Induced a mild but significant apoptosis rate.
-
Cell Line:HeLa
-
Concentration:50 μM
-
Incubation Time:12, 24, 36 h
-
Result:Increased the level of p53 at 12 h.
In Vivo
MedChemExpress (MCE) has not independently confirmed the accuracy of these methods. They are for reference only.
-
Animal Model:HFD-induced mice model[4]
-
Dosage:80, 160 mg/kg
-
Administration:i.g.
-
Result:Decreased the levels of AST, TG and TC.
- Annexin V plus membrane-impermeant dye apoptosis staining
- BrdU Incorporation Assay
- Somatic Cell Culture
- CFSE Dye Dilution Proliferation Assay
- Dye-dilution cell tracking and proliferation staining
- CCK-8/WST-8 Cell Proliferation Assay
- Protocol for Cell Cycle
- Cell Counting-Based Growth Curve Assay
- Colony Formation (Clonogenic) Assay
- Cell Viability Determination by MTT Colorimetric Assay
- EdU Incorporation Assay (Click Chemistry-Based DNA Synthesis Measurement)
- Ki-67 Immunostaining Proliferation Assay
- Detection of Apoptosis
- TUNEL staining for apoptotic DNA fragmentation
- PCNA Immunodetection Proliferation Assay
- Protocol for Cell Counting and Cell Density Analysis
- Apoptosis Solutions
- MTT Cell Proliferation Assay


Chemical Information
-
CAS No. 604-59-1
-
Appearance Solid
-
Molecular Weight 272.30
-
Formula C19H12O2
-
Color White to light yellow
-
SMILES
O=C1C=C(C2=CC=CC=C2)OC3=C1C=CC4=CC=CC=C43
-
Structure Classification
-
Shipping
Room temperature in continental US; may vary elsewhere.
-
Storage
4°C, protect from light
* In solvent : -80°C, 6 months; -20°C, 1 month (protect from light)


Publications (10)
-
Journal Impact Factor
-
Most Recent
-
Phytomedicine
Effect of allyl isothiocyanate on oxidative stress in COPD via the AhR / CYP1A1 and Nrf2 / NQO1 pathways and the underlying mechanism. [Abstract]2023 Jun:114:154774. PMID: 36996530 -
J Hazard Mater
Stereostructure-activity mechanism of cyproconazole by cytochrome P450 in rat liver microsomes: A combined experimental and computational study. [Abstract]2021 Aug 15:416:125764. PMID: 33827004 -
Cell Rep
Aryl hydrocarbon receptor-induced activation of AIM2 inflammasome is mediated by MOMP and MPT: A vital therapeutic pathway for inflammation. [Abstract]2025 Dec 10;44(12):116673. PMID: 41385364 -
Environ Pollut
Enantioselective metabolic mechanism and metabolism pathway of tetraconazole in human liver microsomes: In vitro and in silico study. [Abstract]2026 May 1:396:127849. PMID: 41720237 -
Environ Pollut
Assessing environmental and human health risks: Insight from the enantioselective metabolism and degradation of fenpropidin. [Abstract]2024 Aug 15:355:124214. PMID: 38801883 -
Pharmaceutics
Plasma Protein Binding, Biostability, Metabolite Profiling, and CYP450 Phenotype of TPB15 Across Different Species: A Novel Smoothened Inhibitor for TNBC Therapy. [Abstract]2025 Mar 26;17(4):423. PMID: 40284418 -
J Agric Food Chem
Enantioselective Metabolic Mechanism and Metabolism Pathway of Pydiflumetofen in Rat Liver Microsomes: In Vitro and In Silico Study. [Abstract]2022 Mar 2;70(8):2520-2528. PMID: 35184556 -
Ecotoxicol Environ Saf
Aristolochic acid-induced dyslipidemia and hepatotoxicity: The potential role of FXR and AHR receptors. [Abstract]2024 Nov 15:287:117266. PMID: 39509784 -
AAPS J
Cannabinoid Interactions with Cytochrome P450 Drug Metabolism: a Full-Spectrum Characterization. [Abstract]2021 Jun 28;23(4):91. PMID: 34181150 -


Solvent & Solubility
In Vitro:
DMSO : 25 mg/mL (91.81 mM; Need ultrasonic; Hygroscopic DMSO has a significant impact on the solubility of product, please use newly opened DMSO)
Please refer to the solubility information to select the appropriate solvent. Once prepared, please aliquot and store the solution to prevent product inactivation from repeated freeze-thaw cycles.
Storage method and period of stock solution: -80°C, 6 months; -20°C, 1 month (protect from light). When stored at -80°C, please use it within 6 months. When stored at -20°C, please use it within 1 month.
Please refer to the solubility information to select the appropriate solvent. Once prepared, please aliquot and store the solution to prevent product inactivation from repeated freeze-thaw cycles.
Storage method and period of stock solution: -80°C, 6 months; -20°C, 1 month (protect from light). When stored at -80°C, please use it within 6 months. When stored at -20°C, please use it within 1 month.
Concentration (start) × Volume (start) = Concentration (final) × Volume (final)


Purity & Documentation
-
Data Sheet (283 KB)
-
SDS (254 KB)
- English - EN (254 KB)
- Français - FR (254 KB)
- Deutsch - DE (254 KB)
- Norwegian - NO (254 KB)
- Español - ES (254 KB)
- Swedish - SV (254 KB)
- Italian - IT (254 KB)
- Korean - KR (254 KB)
- Portuguese - PT (254 KB)
-
Handling Instructions (2659 KB)
References
[1]. Campbell DR, et al. Flavonoid inhibition of aromatase enzyme activity in human preadipocytes. J Steroid Biochem Mol Biol. 1993 Sep;46(3):381-8. [Content Brief]
[2]. Cheng YW, et al. Alpha-naphthoflavone induces vasorelaxation through the induction of extracellular calcium influx and NO formation in endothelium. Naunyn Schmiedebergs Arch Pharmacol. 2003 Nov;368(5):377-85. [Content Brief]
[3]. Flores-Pérez A, et al. Apoptosis induction and inhibition of HeLa cell proliferation by alpha-naphthoflavone and resveratrol are aryl hydrocarbon receptor-independent. Chem Biol Interact. 2018 Feb 1;281:98-105. [Content Brief]
[4]. Xia H, et al. Alpha-naphthoflavone attenuates non-alcoholic fatty liver disease in oleic acid-treated HepG2 hepatocytes and in high fat diet-fed mice. Biomed Pharmacother. 2019 Oct;118:109287. [Content Brief]


Complete Stock Solution Preparation Table
Please refer to the solubility information to select the appropriate solvent. Once prepared, please aliquot and store the solution to prevent product inactivation from repeated freeze-thaw cycles.
Storage method and period of stock solution: -80°C, 6 months; -20°C, 1 month (protect from light). When stored at -80°C, please use it within 6 months. When stored at -20°C, please use it within 1 month.
| Optional Solvent | Concentration Solvent Mass | 1 mg | 5 mg | 10 mg | 25 mg |
|---|---|---|---|---|---|
| DMSO | 1 mM | 3.6724 mL | 18.3621 mL | 36.7242 mL | 91.8105 mL |
| 5 mM | 0.7345 mL | 3.6724 mL | 7.3448 mL | 18.3621 mL | |
| 10 mM | 0.3672 mL | 1.8362 mL | 3.6724 mL | 9.1811 mL | |
| 15 mM | 0.2448 mL | 1.2241 mL | 2.4483 mL | 6.1207 mL | |
| 20 mM | 0.1836 mL | 0.9181 mL | 1.8362 mL | 4.5905 mL | |
| 25 mM | 0.1469 mL | 0.7345 mL | 1.4690 mL | 3.6724 mL | |
| 30 mM | 0.1224 mL | 0.6121 mL | 1.2241 mL | 3.0604 mL | |
| 40 mM | 0.0918 mL | 0.4591 mL | 0.9181 mL | 2.2953 mL | |
| 50 mM | 0.0734 mL | 0.3672 mL | 0.7345 mL | 1.8362 mL | |
| 60 mM | 0.0612 mL | 0.3060 mL | 0.6121 mL | 1.5302 mL | |
| 80 mM | 0.0459 mL | 0.2295 mL | 0.4591 mL | 1.1476 mL |


Alpha-Naphthoflavone Related Classifications
HY-125833 Related Classifications
 Powered by Bioz