



Anti-Mouse CD106/VCAM-1 Antibody (M/K-2.7)

Based on 1 Customer Validation
Anti-Mouse CD106/VCAM-1 Antibody (M/K-2.7) is an anti-mouse CD106/VCAM-1 IgG1 monoclonal antibody. Anti-Mouse CD106/VCAM-1 Antibody (M/K-2.7) reduces inflammatory response and oxidative stress by lowering p-STAT3 and reactive oxygen species (ROS) levels. Anti-Mouse CD106/VCAM-1 Antibody (M/K-2.7) can alleviate cardiac inflammation and fibrosis by reducing the expression of collagen I and collagen III. Anti-Mouse CD106/VCAM-1 Antibody (M/K-2.7) can be used for research on cardiovascular conditions such as hypertensive heart condition and subretinal fibrosis.
For research use only. We do not sell to patients.
- Purity : 95.00%
- Molecular Weight:150 kDa
-
Storage:
Please store the product under the recommended conditions in the Certificate of Analysis.

To place orders, for customer services and technical support, please contact: MedChemExpress USA
Tel: 609-228-6898 E-mail: [email protected] [email protected]


-
 Biological Activity
-
Chemical Information
- Protocols
- Purity & Documentation
- References
-
 Help & FAQs





Biological Activity
Description
Isotype
Rat IgG1 kappa
Recommend Isotype Controls
Species Reactivity
Mouse
IC50 & Target
[3]|
IL-1β |
IL-6 |
p-STAT3 |
Collagen I |
Collagen III |
In Vitro
Anti-Mouse CD106/VCAM-1 Antibody (M/K-2.7) (25 μg/mL, 4 h) can significantly inhibit VCAM-1 mediated monocyte adhesion with an inhibition rate of 52 % in TNF-α activated murine cardiac endothelial cells (MCEC) cells[1].
Anti-Mouse CD106/VCAM-1 Antibody (M/K-2.7) (20 μg/mL, 10 h) can block bone marrow-derived macrophages (BMDMs) migration[2].
Anti-Mouse CD106/VCAM-1 Antibody (M/K-2.7) (5 μg/mL, 10 h) significantly inhibits Ang II induced BMDMs adhesion and migration[3].
Anti-Mouse CD106/VCAM-1 Antibody (M/K-2.7) (5 μg/mL, 24 h) inhibits myocardial cell hypertrophy and fibroblast activation by reducing macrophage derived inflammatory factors[3].
MedChemExpress (MCE) has not independently confirmed the accuracy of these methods. They are for reference only. Further protocols information, click here.
-
Cell Line:BMDMs
-
Concentration:20 μg/mL
-
Incubation Time:10 h
-
Result:Significantly reduced the number of macrophage migration caused by VCAM-1.
-
Cell Line:BMDMs
-
Concentration:5 μg/mL
-
Incubation Time:10 h
-
Result:Significantly reduced the number of cell migrations caused by Ang II.
-
Cell Line:Rat cardiomyocytes and cardiac fibroblasts
-
Concentration:5 μg/mL
-
Incubation Time:24 h
-
Result:Reduced the level of CaNA, p-STAT3, TGF-β1 and p-Smad2/3.
-
Cell Line:Rat cardiomyocytes and cardiac fibroblasts
-
Concentration:5 μg/mL
-
Incubation Time:24 h
-
Result:Reduced the level of ANF, BNP, collagen I and collagen III.
In Vivo
Anti-Mouse CD106/VCAM-1 Antibody (M/K-2.7) (0.1 mg or 0.2 mg, i.p., once every 2 days, for 14 days) dose dependently improves cardiac dysfunction and reduces cardiac inflammation and fibrosis in wild-type male C57BL/6J mice with a Ang II induced hypertensive cardiac remodeling model[3].
MedChemExpress (MCE) has not independently confirmed the accuracy of these methods. They are for reference only.
-
Animal Model:Laser induced C57BL/6J mice[2]
-
Dosage:6.85 μg/eye
-
Administration:Intravitreal injection, single dose immediately after the second laser
-
Result:Significantly reduced the area of collagen-1 positive fibrosis.
Reduced F4/80+ macrophage infiltration.
-
Animal Model:Ang II (1,000 ng/kg/min, s.c., for 14 days) implanted wild-type male C57BL/6J mice[3]
-
Dosage:0.1 mg or 0.2 mg
-
Administration:Intraperitoneal injection (i.p.), once every 2 days, for 14 days
-
Result:Improved the heart function decline caused by Ang II.
Reduced heart weight/body weight ratio and ANF/BNP/MYH7 mRNA expression.
Inhibited collagen deposition, collagen III, and α-SMA expression.
Reduced CD68+/VLA-4+ macrophage infiltration, IL-1β/IL-6/TNF-α mRNA expression, and ROS generation.
Gene ID
Accession
Conjugated
Unconjugated
Reconsititution
The product can be reconstituted/diluted with sterile PBS or saline.
Format
-
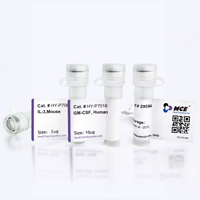
Product Image
Application
in vivo VCAM-1 neutralization; Immunofluorescence


Chemical Information
-
Appearance Liquid
-
Molecular Weight 150 kDa
-
Color Colorless to light yellow
-
SMILES
[Anti-Mouse CD106/VCAM-1 Antibody (M/K-2.7)]
-
Formulation
Please refer to the lot-specific COA for specific buffer information.
-
Storage
Please store the product under the recommended conditions in the Certificate of Analysis.

Protocols
-
Fibrosis/Collagen Morphometry
Fibrosis and collagen morphometry is based on the quantitative visualization of fibrillar collagen deposition in tissue sections using histochemical stains such as Sirius Red (Picrosirius Red) or Masson's trichrome, followed by image-based or polarization-enhanced analysis to estimate collagen proportional area as a surrogate of extracellular matrix accumulation during fibrotic remodeling. Sirius Red combined with polarized light microscopy enhances detection of collagen fibers due to birefringence properties, enabling more specific visualization of collagen type I and III fibrils compared to conventional bright-field histology, while whole-section or region-restricted digital morphometry reduces field-selection bias in fibrosis assessment. Alternative quantitative approaches include second harmonic generation (SHG) and two-photon excited fluorescence microscopy, which enable label-free detection of fibrillar collagen and have been validated against histological staining and biochemica
-
Collagen: Sirius Red Staining
Sirius Red or picrosirius red staining is a histochemical method for visualizing collagen-rich extracellular matrix in tissue sections, and collagen fibers are detected as red-stained structures under bright-field microscopy with enhanced birefringence under polarized light. Picrosirius red is useful for assessing total collagen organization, distribution, and fibrosis burden, but polarized color should not be interpreted as a definitive collagen type I versus type III readout because color is affected by fiber orientation, thickness, and packing.
-
RNA extraction experimental
By lysing cells, releasing RNA, and removing impurities such as proteins and DNA, high-purity RNA products are finally obtained. The commonly used traditional method is the guanidine isothiocyanate/phenol/chloroform method (Trizol), which is suitable for a variety of animal materials including animal tissues, microorganisms, cultured cells, etc., and most plant materials.
-
ROS/oxidative-stress fluorescent staining
ROS/oxidative-stress fluorescent staining uses cell-permeant fluorogenic probes that become fluorescent after oxidation inside cells or tissues; commonly used examples include DCFH-DA/DCFDA for broad cellular oxidant detection, DHE for superoxide-related signal detection, MitoSOX for mitochondrial superoxide-related signal detection, and CellROX probes for oxidative-stress-associated fluorescence readouts. The assay detects probe oxidation rather than a single ROS species unless the probe and analysis method have been chemically validated for that species. DCFH-DA enters cells, is deacetylated by intracellular esterases to DCFH, and produces fluorescent DCF after oxidation, so the readout is used as an operational measure of total cellular oxidative stress rather than a species-specific ROS measurement. DHE and MitoSOX can report superoxide-related oxidation, but red fluorescence alone can include non-specific ethidium-like oxidation products; HPLC or optimized spectral approaches are
-
Connective Tissue: Masson's Trichrome/Collagen Trichrome Staining
Masson’s Trichrome (collagen/trichrome staining) is a histological technique that differentially stains tissue compartments using sequential acidic dyes to distinguish collagen from muscle and cytoplasmic components based on dye affinity and tissue permeability differences, enabling visualization of fibrosis and connective tissue architecture in histological sections. The classical formulation typically uses Weigert's iron hematoxylin for nuclear staining, Biebrich scarlet-acid fuchsin for cytoplasm and muscle, and aniline blue (or light green variants) for collagen, producing a characteristic blue/green collagen signal contrasted against red cytoplasm and dark nuclei. The staining principle relies on selective displacement of smaller dye molecules by larger anionic dyes in collagen-rich regions under controlled acidified conditions, which enhances collagen-specific dye retention. This property makes the method widely used for fibrosis assessment in organs such as heart, liver, lung, a
-
Research Protocol for Inflammation-related Diseases
The NLRP3 inflammasome is a cytosolic innate immune signaling platform that integrates priming signals and danger-signal activation to promote caspase-1 activation, maturation of IL-1β and IL-18, and gasdermin D-mediated pyroptotic cell death. The core experimental logic is to determine whether inflammatory disease phenotypes are driven by increased NLRP3 expression, ASC-containing inflammasome assembly, caspase-1 cleavage, GSDMD cleavage, and extracellular release of IL-1β/IL-18 rather than by nonspecific cell injury alone. The pathway is strongly linked to inflammation-related disease phenotypes because monosodium urate crystals activate NALP3/NLRP3 inflammasome signaling in gout-like crystal inflammation, cholesterol crystals activate NLRP3 inflammasomes in atherogenesis models, and DSS-induced intestinal inflammation has been reported to involve NLRP3 inflammasome activity. However, experimental colitis studies also show context-dependent protective effects of NLRP3 inflammasome co


Purity & Documentation
-
Data Sheet (267 KB)
-
SDS (251 KB)
- English - EN (251 KB)
- Français - FR (251 KB)
- Deutsch - DE (251 KB)
- Norwegian - NO (251 KB)
- Español - ES (251 KB)
- Swedish - SV (251 KB)
- Italian - IT (251 KB)
- Korean - KR (251 KB)
- Portuguese - PT (251 KB)
-
Inhibitory Antibodies User Guide (603 KB)
References
[1]. Kelly KA, et al. Detection of vascular adhesion molecule-1 expression using a novel multimodal nanoparticle. Circ Res. 2005 Feb 18;96(3):327-36. [Content Brief]
[2]. Deng W, et al. Vascular Cell Adhesion Molecule-1 (VCAM-1) contributes to macular fibrosis in neovascular age-related macular degeneration through modulating macrophage functions. Immun Ageing. 2023 Nov 20;20(1):65. [Content Brief]
[3]. Qiu ZY, et al. Blocking VCAM-1 ameliorates hypertensive cardiac remodeling by impeding macrophage infiltration. Front Pharmacol. 2022 Nov 17;13:1058268. [Content Brief]

Calculators
Concentration (start) × Volume (start) = Concentration (final) × Volume (final)


Anti-Mouse CD106/VCAM-1 Antibody (M/K-2.7) Related Classifications
HY-P990294 Related Classifications
 Powered by Bioz