



p-Cresol glucuronide

Based on 1 Customer Validation
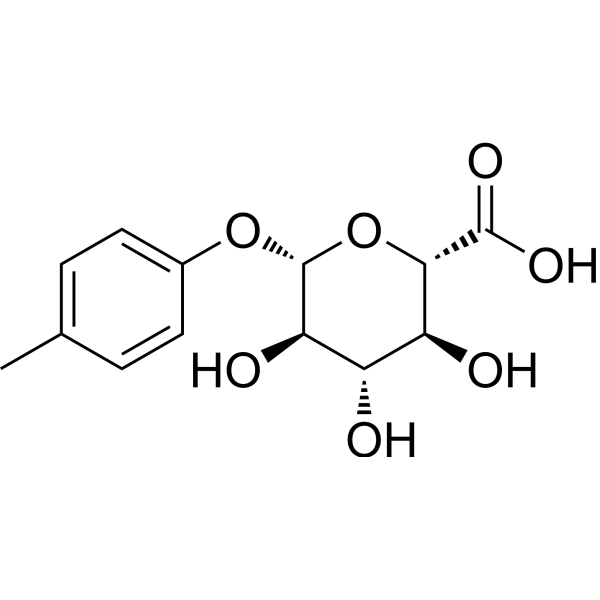
p-Cresol glucuronide is a metabolite of p-Cresol (HY-Y0506). p-Cresol glucuronide acts as a TLR4-antagonizing blood-brain barrier protective agent in brain microvascular endothelial cells, and serves as a non-invasive urinary biomarker metabolite in renal cell carcinoma. p-Cresol glucuronide inhibits LPS (HY-D1056)-induced increase in blood-brain barrier permeability and signal response, impairs mitochondrial function, induces oxidative stress and enhances inflammatory responses, depletes intracellular glutathione, and increases cell necrosis. p-Cresol glucuronide can be used in studies related to renal cell carcinoma, chronic kidney disease and heart disease.
For research use only. We do not sell to patients.
- Purity : 99.90%
- CAS No.: 17680-99-8
- Formula: C13H16O7
- Molecular Weight:284.26
-
Storage:
-20°C, sealed storage, away from moisture and light
* In solvent : -80°C, 6 months; -20°C, 1 month (sealed storage, away from moisture and light)

To place orders, for customer services and technical support, please contact: MedChemExpress USA
Tel: 609-228-6898 E-mail: [email protected] [email protected]


-
 Biological Activity
-
Chemical Information
-
Solvent & Solubility
- Protocols
- Purity & Documentation
- References
-
 Help & FAQs




Biological Activity
Description
In Vitro
Pre-treatment with p-Cresol glucuronide (1 μM; 30 min) for 30 minutes inhibits the LPS-induced increase in paracellular permeability of polarized hCMEC/D3 human brain microvascular endothelial cell monolayers[1].
Pretreatment with p-Cresol glucuronide (1 μM; 30 min) for 30 minutes inhibits the LPS-induced decrease in transendothelial electrical resistance of polarized hCMEC/D3 human brain microvascular endothelial cell monolayers[1].
p-Cresol glucuronide (1 μM; 30 min) inhibits LPS-induced ZO-1 mislocalization and actin cytoskeleton disruption in the human cerebral vascular endothelial cell line hCMEC/D3 when applied as a 30-min pretreatment[1].
Pre-treatment with p-Cresol glucuronide (1 μM; 30 min) for 30 minutes inhibits LPS-induced upregulation of CD11b expression on the surface of the human monocyte cell line THP-1[1].
p-Cresol glucuronide (1 mM; 24 h) exhibits significantly lower toxicity in differentiated HepaRG cells than equimolar p-cresol, and induces weaker oxidative stress, glutathione depletion, and cell necrosis[3].
p-Cresol glucuronide (1 mM; 0-24 h) is taken up by differentiated HepaRG cells, with the intracellular concentration reaching 128.4 μM at 24 h, which is approximately 16 times the concentration of p-cresol generated in situ at an equimolar level[3].
MedChemExpress (MCE) has not independently confirmed the accuracy of these methods. They are for reference only. Further protocols information, click here.
-
Cell Line:hCMEC/D3 cells
-
Concentration:1 μM
-
Incubation Time:30 min (pre-incubation)
-
Result:Prevented the LPS-induced disruption of circumferential ZO-1 localization and the formation of large cytosolic actin fibers.
In Vivo
MedChemExpress (MCE) has not independently confirmed the accuracy of these methods. They are for reference only.
-
Animal Model:C57Bl/6 J (male, 7-8 weeks old)[1]
-
Dosage:1 mg/kg
-
Administration:i.p.; single dose
-
Result:Reduced Evans blue extravasation into brain tissue by approximately 50% 6 h post-administration.
Identified 7702 significantly differentially expressed genes in brain tissue 2 h post-treatment, with 1658 genes showing greater than twofold downregulation and 1433 genes showing greater than twofold upregulation.
Revealed upregulation of processes including axon generation, extracellular matrix organization, and BBB transport pathways, and downregulation of processes including protein synthesis and inflammatory responses via gene ontology analysis.


Chemical Information
-
CAS No. 17680-99-8
-
Appearance Solid
-
Molecular Weight 284.26
-
Formula C13H16O7
-
Color White to off-white
-
SMILES
CC1=CC=C(C=C1)O[C@H]2[C@@H]([C@H]([C@@H]([C@H](O2)C(=O)O)O)O)O
-
Shipping
Room temperature in continental US; may vary elsewhere.
-
Storage
-20°C, sealed storage, away from moisture and light
* In solvent : -80°C, 6 months; -20°C, 1 month (sealed storage, away from moisture and light)


Solvent & Solubility
In Vitro:
DMSO : 100 mg/mL (351.79 mM; Need ultrasonic; Hygroscopic DMSO has a significant impact on the solubility of product, please use newly opened DMSO)
H2O : ≥ 50 mg/mL (175.90 mM)
* "≥" means soluble, but saturation unknown.
Please refer to the solubility information to select the appropriate solvent. Once prepared, please aliquot and store the solution to prevent product inactivation from repeated freeze-thaw cycles.
Storage method and period of stock solution: -80°C, 6 months; -20°C, 1 month (sealed storage, away from moisture and light). When stored at -80°C, please use it within 6 months. When stored at -20°C, please use it within 1 month.
* Note: If you choose water as the stock solution, please dilute it to the working solution, then filter and sterilize it with a 0.22 μm filter before use.
Please refer to the solubility information to select the appropriate solvent. Once prepared, please aliquot and store the solution to prevent product inactivation from repeated freeze-thaw cycles.
Storage method and period of stock solution: -80°C, 6 months; -20°C, 1 month (sealed storage, away from moisture and light). When stored at -80°C, please use it within 6 months. When stored at -20°C, please use it within 1 month.
* Note: If you choose water as the stock solution, please dilute it to the working solution, then filter and sterilize it with a 0.22 μm filter before use.
Concentration (start) × Volume (start) = Concentration (final) × Volume (final)
In Vivo:
Select the appropriate dissolution method based on your experimental animal and administration route.
- For the following dissolution methods, please ensure to first prepare a clear stock solution using an In Vitro approach and then sequentially add co-solvents:
- To ensure reliable experimental results, the clarified stock solution can be appropriately stored based on storage conditions. As for the working solution for In Vivo experiments, it is recommended to prepare freshly and use it on the same day.
- The percentages shown for the solvents indicate their volumetric ratio in the final prepared solution. If precipitation or phase separation occurs during preparation, heat and/or sonication can be used to aid dissolution.
Add each solvent one by one: 10% DMSO 40% PEG300 5% Tween-80 45% Saline
Solubility: ≥ 2.5 mg/mL (8.79 mM); Clear solution
This protocol yields a clear solution of ≥ 2.5 mg/mL (saturation unknown).
Taking 1 mL working solution as an example, add 100 μL DMSO stock solution (25.0 mg/mL) to 400 μL PEG300, and mix evenly; then add 50 μL Tween-80 and mix evenly; then add 450 μL Saline to adjust the volume to 1 mL.
Preparation of Saline: Dissolve 0.9 g sodium chloride in ddH₂O and dilute to 100 mL to obtain a clear Saline solution.
Add each solvent one by one: 10% DMSO 90% (20% SBE-β-CD in Saline)
Solubility: 2.5 mg/mL (8.79 mM); Clear solution; Need ultrasonic
This protocol yields a clear solution of 2.5 mg/mL.
Taking 1 mL working solution as an example, add 100 μL DMSO stock solution (25.0 mg/mL) to 900 μL 20% SBE-β-CD in Saline, and mix evenly.
Preparation of 20% SBE-β-CD in Saline (4°C, storage for one week): 2 g SBE-β-CD powder is dissolved in 10 mL Saline, completely dissolve until clear.
In Vivo Dissolution Calculator
Please enter the basic information of animal experiments:
-
-
-
-
Recommended: Prepare an additional quantity of animals to account for potential losses during experiments.
Working solution concentration: 0.22 mg/mL
This product has good water solubility, please refer to the measured solubility data in water/PBS/Saline for details.

Protocols
-
Mitochondrial membrane-potential fluorescent assay
Mitochondrial membrane potential fluorescent assays estimate ΔΨm in living cells using lipophilic cationic dyes such as TMRM, TMRE, rhodamine 123, and JC-1, which accumulate in mitochondria according to membrane polarization; loss of signal after FCCP or CCCP treatment is interpreted as mitochondrial depolarization. TMRM/TMRE and rhodamine 123 are commonly used for semi-quantitative live-cell microscopy or flow cytometry, while JC-1 can report a shift from red aggregate fluorescence to green monomer fluorescence during depolarization; interpretation requires controls because dye concentration, quenching mode, cell type, dye efflux, and mitochondrial mass can affect fluorescence independently of ΔΨm.
-
ROS/oxidative-stress fluorescent staining
ROS/oxidative-stress fluorescent staining uses cell-permeant fluorogenic probes that become fluorescent after oxidation inside cells or tissues; commonly used examples include DCFH-DA/DCFDA for broad cellular oxidant detection, DHE for superoxide-related signal detection, MitoSOX for mitochondrial superoxide-related signal detection, and CellROX probes for oxidative-stress-associated fluorescence readouts. The assay detects probe oxidation rather than a single ROS species unless the probe and analysis method have been chemically validated for that species. DCFH-DA enters cells, is deacetylated by intracellular esterases to DCFH, and produces fluorescent DCF after oxidation, so the readout is used as an operational measure of total cellular oxidative stress rather than a species-specific ROS measurement. DHE and MitoSOX can report superoxide-related oxidation, but red fluorescence alone can include non-specific ethidium-like oxidation products; HPLC or optimized spectral approaches are
-
Endothelial Tube Formation Assay
Endothelial tube formation assay evaluates the ability of endothelial cells to attach, migrate, align, and organize into capillary-like networks when cultured on gelled basement membrane extract or Matrigel; the readout is the morphology and quantity of tube-like networks, which reflects an in vitro endothelial morphogenesis step related to angiogenesis. Basement membrane extract/Matrigel provides laminin-rich extracellular matrix cues that support endothelial differentiation into capillary-like structures, but it can contain biologically active growth factors, so growth-factor-reduced matrix is preferred when testing defined angiogenic stimulators or inhibitors.
-
Mitochondrial membrane-potential and mitochondrial mass staining
Mitochondrial membrane potential staining measures the electrochemical polarization across the mitochondrial inner membrane in live cells using lipophilic cationic fluorescent probes; early rhodamine-based work showed that selective mitochondrial dye accumulation is lost when the mitochondrial transmembrane potential is dissipated. JC-1 reports mitochondrial polarization by shifting from green monomer fluorescence to red J-aggregate fluorescence as dye concentration increases within energized mitochondria; therefore, the red/green fluorescence ratio is used as a relative readout of mitochondrial membrane potential. TMRE or TMRM staining provides a single-channel relative readout because these cationic rhodamine esters accumulate in polarized mitochondria, and lower fluorescence indicates reduced mitochondrial polarization when acquisition and dye-loading conditions are controlled. Mitochondrial mass staining is commonly performed with MitoTracker Green FM or related MitoTracker dyes as
-
Transepithelial/transendothelial electrical resistance assay
TEER measures electrical resistance across epithelial or endothelial monolayers cultured on permeable supports, and the readout reflects ionic conductance through the cell barrier, especially the paracellular pathway regulated by junctional integrity. TEER can be measured without destroying the monolayer and is commonly used before or during transport, permeability, barrier-disruption, and barrier-maturation experiments. TEER values are influenced by biological maturation and technical conditions; reported factors include temperature, medium formulation, passage number, electrode geometry, membrane properties, and junctional length during early monolayer maturation. Therefore, TEER should be interpreted with blank-insert subtraction, area normalization, repeated readings, and, when possible, orthogonal barrier readouts such as FITC-dextran flux or tight-junction staining.
-
Research Protocol for Cardiovascular Diseases
Cardiovascular disease can be modeled as maladaptive cardiac remodeling, where ischemic injury or pressure overload activates inflammatory signaling, fibroblast activation, extracellular-matrix deposition, cardiomyocyte hypertrophy, vascular remodeling, and progressive ventricular dysfunction. The TGF-β/SMAD axis is a central profibrotic pathway after myocardial injury and pressure overload, while innate immune and cytokine pathways regulate leukocyte recruitment, scar formation, and adverse remodeling. Key unresolved questions include which inflammatory signals are reparative versus harmful, when fibrosis is protective versus maladaptive, and whether pathway inhibition improves function without weakening necessary infarct healing or compensatory remodeling.


Purity & Documentation
-
Data Sheet (288 KB)
-
SDS (394 KB)
- English - EN (394 KB)
- Français - FR (394 KB)
- Deutsch - DE (394 KB)
- Norwegian - NO (394 KB)
- Español - ES (394 KB)
- Swedish - SV (394 KB)
- Italian - IT (394 KB)
- Korean - KR (394 KB)
- Portuguese - PT (394 KB)
-
Handling Instructions (2659 KB)
References


Complete Stock Solution Preparation Table
Please refer to the solubility information to select the appropriate solvent. Once prepared, please aliquot and store the solution to prevent product inactivation from repeated freeze-thaw cycles.
Storage method and period of stock solution: -80°C, 6 months; -20°C, 1 month (sealed storage, away from moisture and light). When stored at -80°C, please use it within 6 months. When stored at -20°C, please use it within 1 month.
| Optional Solvent | Concentration Solvent Mass | 1 mg | 5 mg | 10 mg | 25 mg |
|---|---|---|---|---|---|
| H2O / DMSO | 1 mM | 3.5179 mL | 17.5895 mL | 35.1791 mL | 87.9477 mL |
| 5 mM | 0.7036 mL | 3.5179 mL | 7.0358 mL | 17.5895 mL | |
| 10 mM | 0.3518 mL | 1.7590 mL | 3.5179 mL | 8.7948 mL | |
| 15 mM | 0.2345 mL | 1.1726 mL | 2.3453 mL | 5.8632 mL | |
| 20 mM | 0.1759 mL | 0.8795 mL | 1.7590 mL | 4.3974 mL | |
| 25 mM | 0.1407 mL | 0.7036 mL | 1.4072 mL | 3.5179 mL | |
| 30 mM | 0.1173 mL | 0.5863 mL | 1.1726 mL | 2.9316 mL | |
| 40 mM | 0.0879 mL | 0.4397 mL | 0.8795 mL | 2.1987 mL | |
| 50 mM | 0.0704 mL | 0.3518 mL | 0.7036 mL | 1.7590 mL | |
| 60 mM | 0.0586 mL | 0.2932 mL | 0.5863 mL | 1.4658 mL | |
| 80 mM | 0.0440 mL | 0.2199 mL | 0.4397 mL | 1.0993 mL | |
| 100 mM | 0.0352 mL | 0.1759 mL | 0.3518 mL | 0.8795 mL |
* Note: If you choose water as the stock solution, please dilute it to the working solution, then filter and sterilize it with a 0.22 μm filter before use.


p-Cresol glucuronide Related Classifications
HY-W416250 Related Classifications
 Powered by Bioz
Keywords