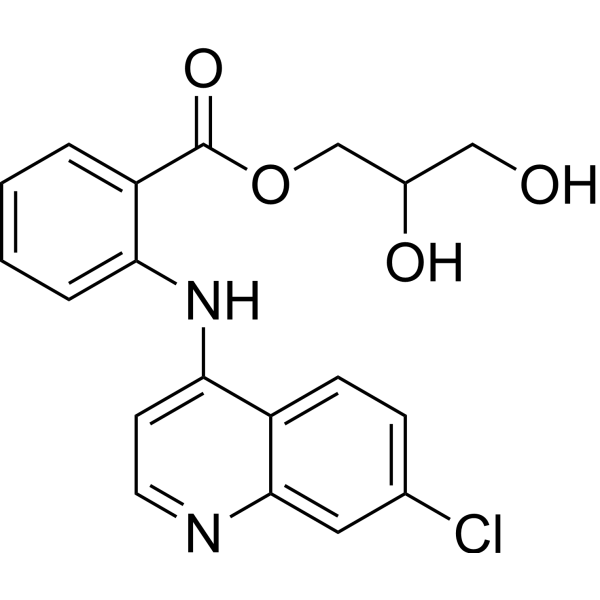
Glafenine
Based on 5 publication(s) in Google Scholar
Glafenine (Glafenin) is a non-selective, non-steroidal anti-inflammatory drug-based COX-1/COX-2 inhibitor. Glafenine exerts anti-inflammatory, anti-proliferative and anti-cell migration effects by inhibiting the arachidonic acid metabolic pathway and reducing prostaglandin synthesis. Glafenine can induce cell cycle arrest in vascular smooth muscle cells and endothelial cells and reduce the synthesis of the extracellular matrix protein Tenascin. Glafenine can be used in the research of inflammatory-related diseases, vascular restenosis and cystic fibrosis (CF).
For research use only. We do not sell to patients.
- Purity : 98.77%
- CAS No.: 3820-67-5
- Formula: C19H17ClN2O4
- Molecular Weight:372.80
-
Storage:Powder -20°C, 3 years , 4°C, 2 years ; In solvent -80°C, 6 months , -20°C, 1 month
Publications Citing Use of MedChemExpress (MCE) Glafenine
More
Biological Activity
Description
IC50 & Target
|
COX-1 |
COX-2 |
Cellular Effect
|
Cell Line
|
Type | Value | Description | References |
|---|---|---|---|---|
| Sf21 | IC50 |
22.3 μM
Compound: Glafenine
|
Inhibition of human BSEP expressed in plasma membrane vesicles of Sf21 cells assessed as inhibition of ATP-dependent [3H]taurocholate uptake
|
[PMID: 21965623] |
| Sf21 | IC50 |
32.2 μM
Compound: Glafenine
|
Inhibition of Sprague-Dawley rat Bsep expressed in plasma membrane vesicles of Sf21 cells assessed as inhibition of ATP-dependent [3H]taurocholate uptake
|
[PMID: 21965623] |
In Vitro
Glafenine (10-100 μM; 4-20 days) inhibits cell proliferation and colony formation in human aortic smooth muscle cells (haSMCs) and endothelial cells (ECs) in a dose-dependent manner, induces cell cycle arrest at the G2/M phase, and reduces the synthesis of the extracellular matrix protein tenascin[1].
Glafenine (10 μM; 24 h) promotes the maturation and translocation of the F508del-CFTR mutant protein to the cell surface and enhances its chloride channel function in human bronchial epithelial cells (HBE) by inhibiting the COX-2-mediated arachidonic acid pathway[2].
MedChemExpress (MCE) has not independently confirmed the accuracy of these methods. They are for reference only. Further protocols information, click here.
-
Cell Line:Human aortic smooth muscle cells (haSMCs), human endothelial cells (ECs)
-
Concentration:10 μM, 50 μM, 100 μM
-
Incubation Time:4 days (short-term), 20 days (long-term)
-
Result:In haSMCs, short-term treatment (4 days) with 50 μM and 100 μM significantly reduced cell proliferation by 30-50% compared to control, while long-term treatment (20 days) with all concentrations caused dose-dependent inhibition, with 100 μM nearly halting proliferation.
Clonogenic activity was reduced by 40-70% in both short- and long-term treatments.
Flow cytometry revealed a G2/M phase block (25-35% increase) and reduced G1 phase (15-20% decrease) in haSMCs at 50-100 μM.
-
Cell Line:Human aortic smooth muscle cells (haSMCs), human endothelial cells (ECs)
-
Concentration:10 μM, 50 μM, 100 μM
-
Incubation Time:4 days (short-term), 20 days (long-term)
-
Result:Resulted a 60% reduction in tenascin expression in haSMCs treated with 100 μM for 4 days.
Significantly decreased proliferation by 25-40% after 4 days at 50 μM and 100 μM, in ECs, without significant cytotoxicity observed at ≤50 μM.
In Vivo
MedChemExpress (MCE) has not independently confirmed the accuracy of these methods. They are for reference only.
-
Animal Model:Zebrafish (Danio rerio) larvae (AB strain, 5 days post-fertilization)[3]
-
Dosage:25 μM
-
Administration:Immersion in culture medium for 12 h
-
Result:Caused dose-dependent intestinal injury, characterized by apoptotic cell accumulation in the lumen, detected by acridine orange (AO) staining and activated caspase-3 immunohistochemistry.
Resulted ER pitting and mitochondrial vacuolization in intestinal epithelial cells (IECs) in transmission electron microscopy (TEM) assay, indicating ER and mitochondrial stress.
Disrupted intestinal architecture with pyknotic nuclei and cellular hypertrophy in segments 1 and 2 in histological analysis.
Chemical Information
-
CAS No. 3820-67-5
-
Appearance Solid
-
Molecular Weight 372.80
-
Formula C19H17ClN2O4
-
Color Light yellow to yellow
-
SMILES
O=C(OCC(O)CO)C1=CC=CC=C1NC2=CC=NC3=CC(Cl)=CC=C23
-
Synonyms
Glafenin
-
Shipping
Room temperature in continental US; may vary elsewhere.
-
Storage
Powder -20°C 3 years 4°C 2 years In solvent -80°C 6 months -20°C 1 month

Publications (5)
-
Journal Impact Factor
-
Most Recent
-
Acta Pharm Sin B
DeepICER: A deep learning framework for predicting compound-induced gene expression profiles. [Abstract]2026 May;16(5):2947-2963. PMID: 42180546 -
-
Int J Biol Macromol
Reticuline isomerase AKR1B1 with aldo-keto reductase activity and detoxification function from the insect Blaps rhynchopetera. [Abstract]2026 Mar:352:151224. PMID: 41791543 -
Bioorg Chem
Identification of FTY720 and COH29 as novel topoisomerase I catalytic inhibitors by experimental and computational studies. [Abstract]2024 Jun:147:107412. PMID: 38696845 -
Indian J Ophthalmol
Ranitidine protects Müller cells against ferroptosis in diabetic retinopathy by regulating the AKT1/GSK3β pathway. [Abstract]2026 Feb 1;74(2):250-258. PMID: 41581041
Solvent & Solubility
In Vitro:
DMSO : 100 mg/mL (268.24 mM; Need ultrasonic; Hygroscopic DMSO has a significant impact on the solubility of product, please use newly opened DMSO)
Please refer to the solubility information to select the appropriate solvent. Once prepared, please aliquot and store the solution to prevent product inactivation from repeated freeze-thaw cycles.
Storage method and period of stock solution: -80°C, 6 months; -20°C, 1 month. When stored at -80°C, please use it within 6 months. When stored at -20°C, please use it within 1 month.
Please refer to the solubility information to select the appropriate solvent. Once prepared, please aliquot and store the solution to prevent product inactivation from repeated freeze-thaw cycles.
Storage method and period of stock solution: -80°C, 6 months; -20°C, 1 month. When stored at -80°C, please use it within 6 months. When stored at -20°C, please use it within 1 month.
Concentration (start) × Volume (start) = Concentration (final) × Volume (final)
In Vivo:
Select the appropriate dissolution method based on your experimental animal and administration route.
- For the following dissolution methods, please ensure to first prepare a clear stock solution using an In Vitro approach and then sequentially add co-solvents:
- To ensure reliable experimental results, the clarified stock solution can be appropriately stored based on storage conditions. As for the working solution for In Vivo experiments, it is recommended to prepare freshly and use it on the same day.
- The percentages shown for the solvents indicate their volumetric ratio in the final prepared solution. If precipitation or phase separation occurs during preparation, heat and/or sonication can be used to aid dissolution.
Add each solvent one by one: 10% DMSO 40% PEG300 5% Tween-80 45% Saline
Solubility: ≥ 2.08 mg/mL (5.58 mM); Clear solution
This protocol yields a clear solution of ≥ 2.08 mg/mL (saturation unknown).
Taking 1 mL working solution as an example, add 100 μL DMSO stock solution (20.8 mg/mL) to 400 μL PEG300, and mix evenly; then add 50 μL Tween-80 and mix evenly; then add 450 μL Saline to adjust the volume to 1 mL.
Preparation of Saline: Dissolve 0.9 g sodium chloride in ddH₂O and dilute to 100 mL to obtain a clear Saline solution.
Add each solvent one by one: 10% DMSO 90% (20% SBE-β-CD in Saline)
Solubility: 2.08 mg/mL (5.58 mM); Suspended solution; Need ultrasonic
This protocol yields a suspended solution of 2.08 mg/mL. Suspended solution can be used for oral and intraperitoneal injection.
Taking 1 mL working solution as an example, add 100 μL DMSO stock solution (20.8 mg/mL) to 900 μL 20% SBE-β-CD in Saline, and mix evenly.
Preparation of 20% SBE-β-CD in Saline (4°C, storage for one week): 2 g SBE-β-CD powder is dissolved in 10 mL Saline, completely dissolve until clear.
In Vivo Dissolution Calculator
Please enter the basic information of animal experiments:
-
-
-
-
Recommended: Prepare an additional quantity of animals to account for potential losses during experiments.
Please enter your animal formula composition:
-
%DMSO +
Recommended: Keep the proportion of DMSO in working solution below 2% if your animal is weak.
-
%+
-
+%Tween-80 + +
-
%Saline +
The co-solvents required include: DMSO, . All of co-solvents are available by MedChemExpress (MCE). , Tween 80. All of co-solvents are available by MedChemExpress (MCE).
Working solution concentration: 0.22 mg/mL
Method for preparing stock solution: mg drug dissolved in μL DMSO. Stock solution concentration: mg/mL.
1. Take μL DMSO stock solution;
2. Add μL .
μL , mix evenly;
3. Then add μL Tween 80, mix evenly;
4. Then add μL
Please ensure that the stock solution in the first step is dissolved to a clear state, and add co-solvents in sequence. You can use ultrasonic heating (ultrasonic cleaner, recommended frequency 20-40 kHz), vortexing, etc. to assist dissolution.
Protocols
-
Scratch/Wound-Healing Migration Assay
The scratch/wound-healing migration assay measures collective migration of adherent cells into an experimentally created cell-free gap in a confluent monolayer. The readout is generated by imaging the gap immediately after scratching and at later time points, then quantifying reduction in wound area, wound width, or percentage closure as cells move into the denuded region. Gap closure reflects cell migration but may also include cell proliferation, so interpretation should distinguish migration-focused conditions from proliferation-driven closure when possible, such as by using short assay windows, serum-controlled conditions, cell counting, or proliferation controls reported in published protocols.
-
Collagen: Sirius Red Staining
Sirius Red or picrosirius red staining is a histochemical method for visualizing collagen-rich extracellular matrix in tissue sections, and collagen fibers are detected as red-stained structures under bright-field microscopy with enhanced birefringence under polarized light. Picrosirius red is useful for assessing total collagen organization, distribution, and fibrosis burden, but polarized color should not be interpreted as a definitive collagen type I versus type III readout because color is affected by fiber orientation, thickness, and packing.
-
Cell migration
Cell migration is a method that plays an important role in wound healing, cell differentiation, embryonic development, etc.
-
BrdU Incorporation Assay
Bromodeoxyuridine (BrdU) incorporation assay is based on the principle that BrdU, a thymidine analog, is incorporated into newly synthesized DNA during the S phase of the cell cycle, thereby serving as a marker of DNA replication and cellular proliferation. Incorporated BrdU can be detected using anti-BrdU antibodies following DNA denaturation, enabling visualization or quantification of proliferating cells through immunochemical detection methods such as immunofluorescence or immunohistochemistry.
-
Neural Crest/Neuronal Cell Migration Explant Assay
Neural crest (NC) and neuronal cell migration explant assays are in vitro systems in which neural tube-derived tissues are cultured to allow premigratory or newly emigrated neural crest cells to undergo epithelial-to-mesenchymal transition (EMT), migrate away from the explant, and form a measurable radial outgrowth that reflects migratory capacity and environmental responsiveness. These assays typically quantify migration by measuring the expansion of cell outgrowth from neural tube or neural plate border explants over time, often comparing early and later timepoints to derive a migration index such as a radius ratio, which reflects net cell dispersal from the explant core. Neural tube explant cultures preserve key aspects of neural crest behavior, including EMT, migration, and early differentiation, making them suitable for assessing intrinsic migratory ability and extrinsic cue dependence. However, studies emphasize that migratory outgrowth from neural tube explants may include non-n
-
ECM-Embedded Organoid (Matrigel/Dome) Culture
ECM-embedded organoid dome culture embeds epithelial stem cells, crypts, organoid fragments, or tumor-derived epithelial cells in a basement-membrane-like hydrogel such as Matrigel, allowing 3D growth, self-organization, lumen formation, budding or cystic morphogenesis, and lineage maintenance under defined niche-factor-containing medium. The primary readouts are organoid establishment efficiency, growth, morphology, passaging capacity, lineage-marker expression, and, when fluorescently labeled lines are used, microscopy- or flow-cytometry-based quantification of population behavior in 3D culture.
-
Connective Tissue: Masson's Trichrome/Collagen Trichrome Staining
Masson’s Trichrome (collagen/trichrome staining) is a histological technique that differentially stains tissue compartments using sequential acidic dyes to distinguish collagen from muscle and cytoplasmic components based on dye affinity and tissue permeability differences, enabling visualization of fibrosis and connective tissue architecture in histological sections. The classical formulation typically uses Weigert's iron hematoxylin for nuclear staining, Biebrich scarlet-acid fuchsin for cytoplasm and muscle, and aniline blue (or light green variants) for collagen, producing a characteristic blue/green collagen signal contrasted against red cytoplasm and dark nuclei. The staining principle relies on selective displacement of smaller dye molecules by larger anionic dyes in collagen-rich regions under controlled acidified conditions, which enhances collagen-specific dye retention. This property makes the method widely used for fibrosis assessment in organs such as heart, liver, lung, a
-
Protocol for Cell Cycle
Cell-cycle analysis by flow cytometry measures DNA content in single cells to estimate the fraction of cells in G0/G1, S, and G2/M phases. Propidium iodide intercalates into DNA, and after RNA removal with RNase, fluorescence intensity reflects cellular DNA content: 2N cells are assigned to G0/G1, cells between 2N and 4N to S phase, and 4N cells to G2/M. DNA-content analysis alone cannot reliably separate G0 from G1 or G2 from M. Ki-67 can distinguish quiescent G0 cells from cycling cells, EdU or BrdU incorporation marks active DNA synthesis in S phase, and phospho-histone H3 staining identifies mitotic cells within the 4N population.
-
Research Protocol for Inflammation-related Diseases
The NLRP3 inflammasome is a cytosolic innate immune signaling platform that integrates priming signals and danger-signal activation to promote caspase-1 activation, maturation of IL-1β and IL-18, and gasdermin D-mediated pyroptotic cell death. The core experimental logic is to determine whether inflammatory disease phenotypes are driven by increased NLRP3 expression, ASC-containing inflammasome assembly, caspase-1 cleavage, GSDMD cleavage, and extracellular release of IL-1β/IL-18 rather than by nonspecific cell injury alone. The pathway is strongly linked to inflammation-related disease phenotypes because monosodium urate crystals activate NALP3/NLRP3 inflammasome signaling in gout-like crystal inflammation, cholesterol crystals activate NLRP3 inflammasomes in atherogenesis models, and DSS-induced intestinal inflammation has been reported to involve NLRP3 inflammasome activity. However, experimental colitis studies also show context-dependent protective effects of NLRP3 inflammasome co
-
Cell Viability Determination by MTT Colorimetric Assay
The following protocol uses the MTT colorimetric assay as a classic literature-established method for assessing cell viability/metabolic activity in cultured mammalian cells. MTT[3-(4,5-dimethylthiazol-2-yl)-2,5-diphenyltetrazolium bromide] is reduced by metabolically active cells to a colored formazan product; the amount of formazan is quantified spectrophotometrically and provides an indirect measure of metabolically active viable cells. Importantly, MTT reduction reflects cellular oxidoreductase/metabolic activity rather than an absolute direct count of living cells, so changes in cellular metabolism can alter the signal independently of cell number.
-
Matrigel Transwell/Boyden Chamber Invasion Assay
Matrigel Transwell/Boyden chamber invasion assay measures the ability of cells to degrade or traverse an extracellular matrix-coated porous membrane and move from an upper chamber toward a chemoattractant in a lower chamber. Invasion is distinguished from migration by coating the membrane with Matrigel or basement membrane matrix; uncoated inserts measure migration, while coated inserts require cells to cross an ECM barrier before reaching the underside of the membrane.
-
Fibrosis/Collagen Morphometry
Fibrosis and collagen morphometry is based on the quantitative visualization of fibrillar collagen deposition in tissue sections using histochemical stains such as Sirius Red (Picrosirius Red) or Masson's trichrome, followed by image-based or polarization-enhanced analysis to estimate collagen proportional area as a surrogate of extracellular matrix accumulation during fibrotic remodeling. Sirius Red combined with polarized light microscopy enhances detection of collagen fibers due to birefringence properties, enabling more specific visualization of collagen type I and III fibrils compared to conventional bright-field histology, while whole-section or region-restricted digital morphometry reduces field-selection bias in fibrosis assessment. Alternative quantitative approaches include second harmonic generation (SHG) and two-photon excited fluorescence microscopy, which enable label-free detection of fibrillar collagen and have been validated against histological staining and biochemica
-
Flow cytometric DNA-content cell-cycle staining
Flow cytometric DNA-content cell-cycle staining measures the fluorescence intensity of DNA-bound fluorochromes in single cells or nuclei to estimate DNA content distributions, allowing assignment of populations to G0/G1, S, and G2/M phases by DNA histogram deconvolution. Propidium iodide (PI) intercalates into DNA, and PI fluorescence is proportional to cellular DNA content when staining is performed under conditions that make DNA accessible and minimize non-DNA signal. Cells with G2/M DNA content are expected to show approximately twice the fluorescence intensity of G0/G1 cells, while S-phase cells occupy intermediate fluorescence values. PI-based DNA-content analysis can also detect cells with fractional DNA content, often reported as sub-G1, when DNA fragmentation and extraction during staining reduce retained DNA signal in apoptotic cells. DAPI is an alternative DNA fluorochrome for univariate DNA-content analysis, while bivariate approaches combining DNA content with proliferation
-
Chemotaxis Gradient Chamber Assay 1
The chemotaxis gradient chamber assay is based on the principle of observing directional cell migration in response to a stable, linear or quasi-linear concentration gradient of a chemoattractant formed between two fluid reservoirs separated by a narrow observation chamber. Cells placed within the chamber respond to the gradient by polarized movement toward higher chemoattractant concentrations, allowing quantification of chemotactic behavior in real time under microscopy. The classic Zigmond chamber design enables simultaneous visualization of gradient formation and individual cell trajectories, making it suitable for studying leukocyte chemotaxis and other motile cell types in vitro.
-
Under-Agarose Cell Migration Assay
The under-agarose cell migration assay is a classical in vitro chemotaxis method designed to evaluate directed cell movement through a semi-solid agarose matrix toward soluble chemoattractant gradients, enabling visualization and quantification of leukocyte or motile cell migration in a confined 2D-like environment. In this system, cells and chemoattractants are placed in separate wells cut into an agarose gel, allowing diffusion-driven gradient formation that guides directional migration, which is typically assessed by measuring migration distance, cell morphology changes, and accumulation toward the chemoattractant source. This assay has been widely used to study neutrophil and leukocyte chemotaxis as a simple alternative to filter-based migration systems and allows direct microscopic observation of migrating cells under near-physiological confinement conditions.
-
Transwell/Boyden Chamber Migration Assay
The Transwell/Boyden chamber migration assay measures cell movement through a porous membrane separating an upper and lower chamber, usually after a chemoattractant gradient is established by placing cells in the upper chamber and chemoattractant-containing medium in the lower chamber. The readout is generated by quantifying cells that traverse the membrane and appear on the lower membrane surface or in the lower chamber, depending on whether the cell type is adherent or non-adherent. This assay reflects chemotactic or haptotactic migration rather than matrix invasion unless an extracellular-matrix barrier is added to the membrane.
-
Endothelial Tube Formation Assay
Endothelial tube formation assay evaluates the ability of endothelial cells to attach, migrate, align, and organize into capillary-like networks when cultured on gelled basement membrane extract or Matrigel; the readout is the morphology and quantity of tube-like networks, which reflects an in vitro endothelial morphogenesis step related to angiogenesis. Basement membrane extract/Matrigel provides laminin-rich extracellular matrix cues that support endothelial differentiation into capillary-like structures, but it can contain biologically active growth factors, so growth-factor-reduced matrix is preferred when testing defined angiogenic stimulators or inhibitors.
-
3D Collagen/Hydrogel Matrix Migration Assay
The 3D collagen/hydrogel matrix migration assay is based on embedding cells within or on top of a fibrillar collagen type I-rich three-dimensional matrix to model in vivo-like extracellular matrix (ECM) architecture, enabling analysis of cell migration through a physically and biochemically relevant scaffold. In contrast to 2D migration systems, cells in 3D matrices interact with fibrillar collagen networks, requiring coordinated adhesion remodeling and proteolytic or non-proteolytic deformation mechanisms to move through confined spaces, thereby providing a more physiologically relevant readout of invasive and migratory behavior in tissue-like environments. Cell movement in 3D collagen matrices is typically quantified by tracking single-cell trajectories, invasion depth, or matrix penetration over time, reflecting combined effects of cytoskeletal dynamics, cell-ECM adhesion turnover, and ECM remodeling. These systems are widely used to study tumor cell invasion and stromal cell motili
-
Matrigel/ECM Transwell Invasion Assay
The Matrigel/ECM Transwell invasion assay measures the ability of cells to move toward a chemoattractant while crossing an extracellular-matrix barrier placed on a porous membrane; therefore, the readout reflects both chemotactic motility and matrix invasion rather than migration alone. Matrigel is a basement-membrane-rich matrix derived from Engelbreth-Holm-Swarm mouse sarcoma and has been used as a reconstituted basement membrane barrier in chemoinvasion assays. The assay readout is generated by quantifying cells that reach the underside of the insert membrane or lower compartment after incubation, commonly by staining and counting invaded cells or by fluorescence-based quantification.
-
Cell-Exclusion Zone Migration Assay
The Cell-Exclusion Zone (CEZ) migration assay is an in vitro 2D cell migration method in which a defined cell-free area is created using removable physical barriers such as silicone stoppers, allowing cells to be seeded around the barrier and subsequently migrate into the cleared zone after barrier removal. This approach enables quantification of collective cell migration by monitoring repopulation of the initially cell-free region over time using microscopy-based imaging. Compared with scratch-based wound healing assays, barrier-based exclusion methods are designed to avoid mechanical damage to the extracellular matrix and reduce injury-induced effects on boundary cells, thereby improving interpretability of migration behavior in vitro. The assay readout is typically the progressive reduction in the cell-free area or the number of cells invading the exclusion zone, reflecting coordinated cell motility relevant to physiological processes such as wound healing, epithelial repair, and ca
-
Chemotaxis Gradient Chamber Assay 2
Chemotaxis gradient chamber assays measure directional cell migration in response to a soluble chemical gradient by imaging cells as they move across a defined observation region; the readout is generated from time-lapse cell trajectories, displacement toward the gradient, forward migration index, trajectory plots, rose/polar plots, and statistical tests of non-random directionality. The Dunn chamber is a direct-viewing glass chamber in which cells migrate across a bridge between control and chemoattractant wells, allowing observation of cells in a linear concentration gradient; related direct-viewing formats include the Insall chamber, which supports defined unidirectional gradients and high numerical-aperture microscopy, and the μ-Slide Chemotaxis chamber, which supports long-term live-cell imaging and gradient characterization with fluorescent dye.
Purity & Documentation
-
Data Sheet (285 KB)
-
SDS (394 KB)
- English - EN (394 KB)
- Français - FR (394 KB)
- Deutsch - DE (394 KB)
- Norwegian - NO (394 KB)
- Español - ES (394 KB)
- Swedish - SV (394 KB)
- Italian - IT (394 KB)
- Korean - KR (394 KB)
- Portuguese - PT (394 KB)
-
Handling Instructions (2659 KB)
References
[1]. Schöber W, et al. Impact of glafenine hydrochloride on human endothelial cells and human vascular smooth muscle cells: a substance reducing proliferation, migration and extracellular matrix synthesis. Cell Biol Int. 2003;27(12):987-96 [Content Brief]
[2]. Carlile GW, et al. The NSAID glafenine rescues class 2 CFTR mutants via cyclooxygenase 2 inhibition of the arachidonic acid pathway. Sci Rep. 2022 Mar 17;12(1):4595 [Content Brief]
[3]. Goldsmith JR, et al. Glafenine-induced intestinal injury in zebrafish is ameliorated by μ-opioid signaling via enhancement of Atf6-dependent cellular stress responses. Dis Model Mech. 2013 Jan;6(1):146-59. [Content Brief]
[4]. Chiu AM, et al. High Throughput Assay Identifies Glafenine as a Corrector for the Folding Defect in Corneal Dystrophy-Causing Mutants of SLC4A11. Invest Ophthalmol Vis Sci. 2015 Dec;56(13):7739-53. [Content Brief]
Complete Stock Solution Preparation Table
Please refer to the solubility information to select the appropriate solvent. Once prepared, please aliquot and store the solution to prevent product inactivation from repeated freeze-thaw cycles.
Storage method and period of stock solution: -80°C, 6 months; -20°C, 1 month. When stored at -80°C, please use it within 6 months. When stored at -20°C, please use it within 1 month.
| Optional Solvent | Concentration Solvent Mass | 1 mg | 5 mg | 10 mg | 25 mg |
|---|---|---|---|---|---|
| DMSO | 1 mM | 2.6824 mL | 13.4120 mL | 26.8240 mL | 67.0601 mL |
| 5 mM | 0.5365 mL | 2.6824 mL | 5.3648 mL | 13.4120 mL | |
| 10 mM | 0.2682 mL | 1.3412 mL | 2.6824 mL | 6.7060 mL | |
| 15 mM | 0.1788 mL | 0.8941 mL | 1.7883 mL | 4.4707 mL | |
| 20 mM | 0.1341 mL | 0.6706 mL | 1.3412 mL | 3.3530 mL | |
| 25 mM | 0.1073 mL | 0.5365 mL | 1.0730 mL | 2.6824 mL | |
| 30 mM | 0.0894 mL | 0.4471 mL | 0.8941 mL | 2.2353 mL | |
| 40 mM | 0.0671 mL | 0.3353 mL | 0.6706 mL | 1.6765 mL | |
| 50 mM | 0.0536 mL | 0.2682 mL | 0.5365 mL | 1.3412 mL | |
| 60 mM | 0.0447 mL | 0.2235 mL | 0.4471 mL | 1.1177 mL | |
| 80 mM | 0.0335 mL | 0.1677 mL | 0.3353 mL | 0.8383 mL | |
| 100 mM | 0.0268 mL | 0.1341 mL | 0.2682 mL | 0.6706 mL |