



Zederone

Based on 1 Customer Validation
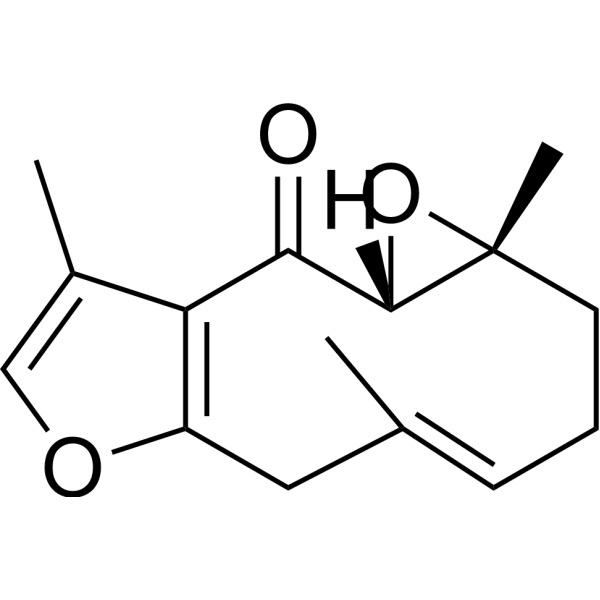
Zederone is a sesquiterpene. Zederone inhibits ovarian cancer cell proliferation through mTOR/p70s6K signalling pathway. Zederone inhibits CYP activities with IC50s of 2.9 μM (CYP2B6), 9.2 μM (CYP2C9), 11,2 μM (CYP2C19) and >30 μM (CYP1A2 and CYP2D6). Zederone is hepatotoxic with LD50 value at 24 hours in mice of approximately 223 mg/kg and cytotoxic against the KG1a cell line. Zederone shows antibacterial activity against a number of multi-drug resistant and Methicillin (HY-121544)-resistant Staphylococcus aureus strain. Zederone shows cognition improving capacity and assists in the modulation of gut bacterial dysbiosis.
Nur für Forschungszwecke. Wir verkaufen nicht an Patienten.
- Reinheit : 99.61%
- CAS. Nr.: 7727-79-9
- Formel: C15H18O3
- Molecular Weight:246.30
-
Speicherung:
-20°C, protect from light
* In solvent : -80°C, 6 months; -20°C, 1 month (protect from light)

To place orders, for customer services and technical support, please contact: MedChemExpress USA
Tel: 609-228-6898 E-mail: [email protected] [email protected]


-
 Biologische Aktivität
-
Chemical Information
-
Lösungsmittel & Löslichkeit
- Protokoll
- Reinheit & Dokumentation
- Verweise
-
 Help & FAQs


-
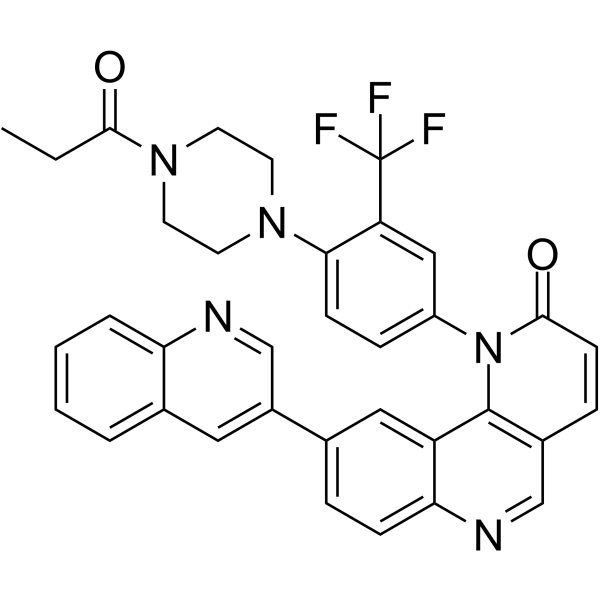
HY-13003
Torin 1mTOR Inhibitor -
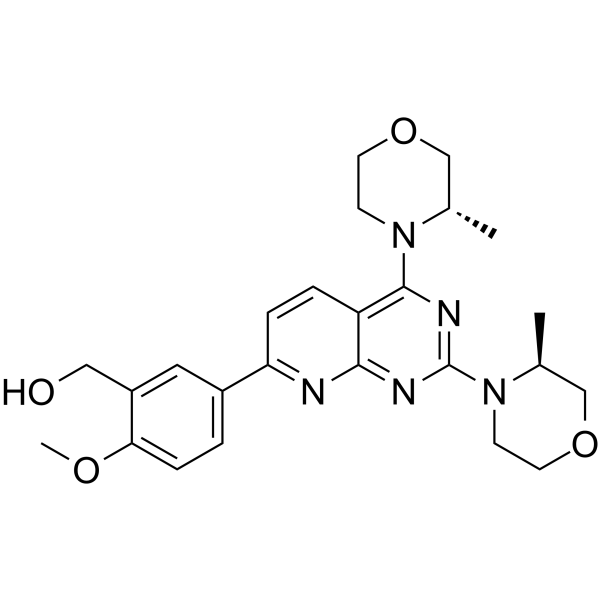
HY-10422
AZD-8055mTOR Inhibitor -
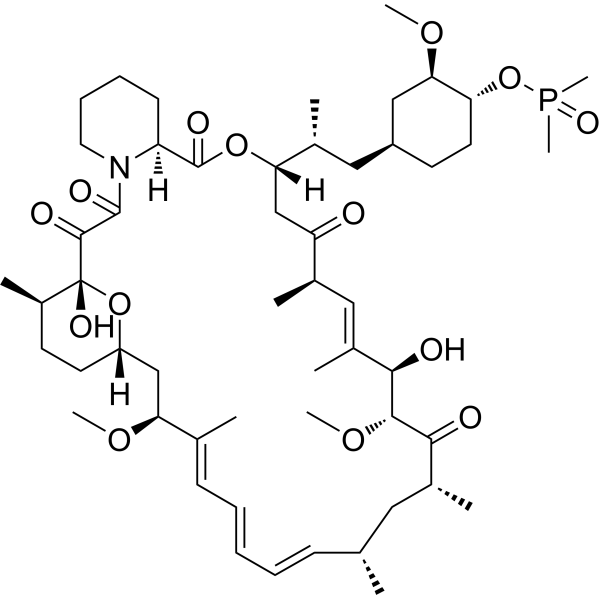
HY-50908
RidaforolimusmTOR Inhibitor -
HY-10423
OSI-027mTOR Inhibitor -
HY-13806
XL388mTOR Inhibitor -
HY-12034
WYE-354mTOR inhibitor -
HY-10219S
Rapamycin-d3Stable Isotope -
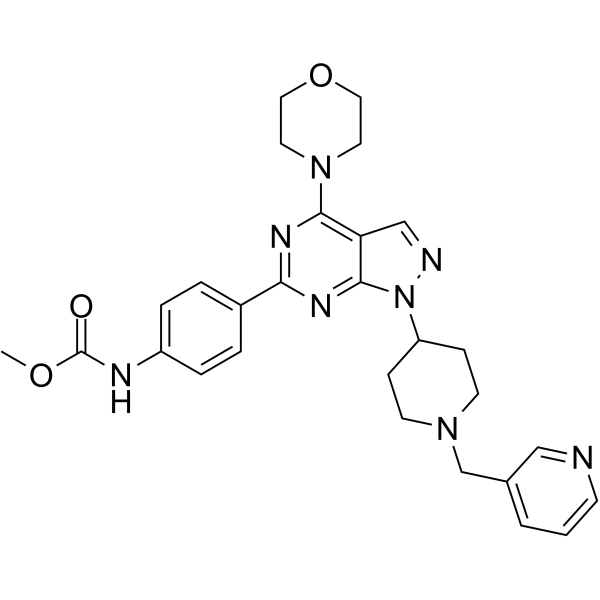
HY-15271
WYE-687mTOR inhibitor -
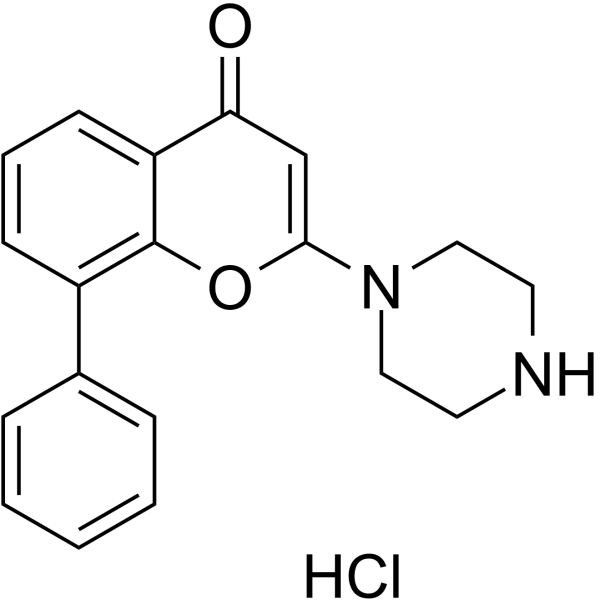
HY-15643A
LY 303511 hydrochloride -

HY-10422R
AZD-8055 (Standard)Reference Standard -

HY-10423R
OSI-027 (Standard)Reference Standard


Biologische Aktivität
Beschreibung
IC50 & Target
[2]|
mTOR |
In Vitro
Zederone (0-80 μg/mL, 24 h) can inhibit the proliferation of human ovarian cancer cell line SKOV3 and arrest SKOV3 cells at G1 phase, and it may regulate the proliferation of SKOV3 cells through inhibiting mTOR/p70s6K signalling pathway[2].
Zederone (0-30 μM, 24 h) significantly activates mouse PXR, significantly activates human PXR and CAR, and AhR shows no response in human hepatoma C3A cells[3].
Zederone exhibits IC50s in HLM incubations of 3.9 μM (CYP2B6), 9.9 μM (CYP3A4/M) and >50 μM (CYP1A2, CYP2C9, CYP2C19, CYP2D6 and CYP3A4/T)[3].
Zederone shows antibacterial activity against SA1199B, ATCC25923, XU212, RN4220 and EMRSA15 with MICs of 128, 64, 128, 64 and 128 μg/ml[4].
Zederone (0-100 μg/mL, 48 h) selectively kills leukemia stem cells (KG1a) with an IC50 of 56.8 μg/mL and low cytotoxicity toward normal peripheral blood mononuclear cells (PBMCs) [5].
MedChemExpress (MCE) has not independently confirmed the accuracy of these methods. They are for reference only.
-
Cell Line:SKOV3 cells and IOSE80 cells
-
Concentration:0, 5, 10, 20, 40 and 80 μg/mL
-
Incubation Time:24 h
-
Result:Inhibited the proliferation of SKOV3 cells in a dose-dependent manner but had no significant effect on the proliferation of IOSE80 cells.
-
Cell Line:SKOV3 cells
-
Concentration:10, 20, 40 μg/mL
-
Incubation Time:24 h
-
Result:Significantly increased the ratio of G1 phase cells, while the ratio of S phase cells and G2/M phase cells was significantly decreased.
-
Cell Line:SKOV3 cells
-
Concentration:10, 20, 40 μg/mL
-
Incubation Time:24 h
-
Result:Significantly decreased the expression levels of p-mTOR, p-p70s6K, mTOR and p70s6K.
Maintained the expression levels of p-PI3K and p-Akt.
In Vivo
Zederone (10 mg/kg, p.o.) improves the fecal microbial profile in dementia induced rat model, showing a increased shift towards Lactobacillus genera from Bacteroides[6].
MedChemExpress (MCE) has not independently confirmed the accuracy of these methods. They are for reference only.
-
Animal Model:Acute liver toxicity model established in adult male ICR mice weighing 30 to 35 g (approximately 6-8 weeks of age)[1]
-
Dosage:50, 100, 150, 200, and 300 mg/kg
-
Administration:Intraperitoneal injection (i.p.), single dose
-
Result:Induced liver enlargement with scattered white foci over the organ.
Observed hepatic centrilobular necrosis with marked increases in plasma alanine transaminase activity and total bilirubin levels.
Decreased the activity of superoxide dismutase and the hepatic glutathione content at 200 mg/kg.
Increased the messenger RNA (mRNA) expression of Cyp2b10 and Cyp3a11 and proinflammatory cytokine tumor necrosis factor, and decreased the nuclear factor-E2-related factor 2 protein at 200 mg/kg.
- Research Protocol for Infectious Diseases
- BrdU Incorporation Assay
- Somatic Cell Culture
- CFSE Dye Dilution Proliferation Assay
- Dye-dilution cell tracking and proliferation staining
- CCK-8/WST-8 Cell Proliferation Assay
- Protocol for Cell Cycle
- Cell Counting-Based Growth Curve Assay
- Colony Formation (Clonogenic) Assay
- Bacterial live/dead nucleic-acid viability staining
- Acute Systemic Toxicity Study
- Cell Viability Determination by MTT Colorimetric Assay
- EdU Incorporation Assay (Click Chemistry-Based DNA Synthesis Measurement)
- Ki-67 Immunostaining Proliferation Assay
- PCNA Immunodetection Proliferation Assay
- Protocol for Cell Counting and Cell Density Analysis
- MTT Cell Proliferation Assay


Chemical Information
-
CAS. Nr. 7727-79-9
-
Appearance Solid
-
Molecular Weight 246.30
-
Formel C15H18O3
-
Color White to yellow
-
SMILES
CC1=COC(C/C(C)=C/CC[C@]2(C)[C@@]3([H])O2)=C1C3=O
-
Structure Classification
-
Initial Source
-
Versand
Room temperature in continental US; may vary elsewhere.
-
Speicherung
-20°C, protect from light
* In solvent : -80°C, 6 months; -20°C, 1 month (protect from light)


Lösungsmittel & Löslichkeit
In Vitro:
DMSO : 50 mg/mL (203.00 mM; Need ultrasonic; Hygroscopic DMSO has a significant impact on the solubility of product, please use newly opened DMSO)
Please refer to the solubility information to select the appropriate solvent. Once prepared, please aliquot and store the solution to prevent product inactivation from repeated freeze-thaw cycles.
Storage method and period of stock solution: -80°C, 6 months; -20°C, 1 month (protect from light). When stored at -80°C, please use it within 6 months. When stored at -20°C, please use it within 1 month.
Please refer to the solubility information to select the appropriate solvent. Once prepared, please aliquot and store the solution to prevent product inactivation from repeated freeze-thaw cycles.
Storage method and period of stock solution: -80°C, 6 months; -20°C, 1 month (protect from light). When stored at -80°C, please use it within 6 months. When stored at -20°C, please use it within 1 month.
Konzentration (Stammlösung) × Volumen (Stammlösung) = Konzentration (Ziellösung) × Volumen (Ziellösung)
In Vivo:
Select the appropriate dissolution method based on your experimental animal and administration route.
- For the following dissolution methods, please ensure to first prepare a clear stock solution using an In Vitro approach and then sequentially add co-solvents:
- To ensure reliable experimental results, the clarified stock solution can be appropriately stored based on storage conditions. As for the working solution for In Vivo experiments, it is recommended to prepare freshly and use it on the same day.
- The percentages shown for the solvents indicate their volumetric ratio in the final prepared solution. If precipitation or phase separation occurs during preparation, heat and/or sonication can be used to aid dissolution.
Add each solvent one by one: 10% DMSO 40% PEG300 5% Tween-80 45% Saline
Solubility: ≥ 2.5 mg/mL (10.15 mM); Clear solution
This protocol yields a clear solution of ≥ 2.5 mg/mL (saturation unknown).
Taking 1 mL working solution as an example, add 100 μL DMSO stock solution (25.0 mg/mL) to 400 μL PEG300, and mix evenly; then add 50 μL Tween-80 and mix evenly; then add 450 μL Saline to adjust the volume to 1 mL.
Preparation of Saline: Dissolve 0.9 g sodium chloride in ddH₂O and dilute to 100 mL to obtain a clear Saline solution.
Add each solvent one by one: 10% DMSO 90% (20% SBE-β-CD in Saline)
Solubility: ≥ 2.5 mg/mL (10.15 mM); Clear solution
This protocol yields a clear solution of ≥ 2.5 mg/mL (saturation unknown).
Taking 1 mL working solution as an example, add 100 μL DMSO stock solution (25.0 mg/mL) to 900 μL 20% SBE-β-CD in Saline, and mix evenly.
Preparation of 20% SBE-β-CD in Saline (4°C, storage for one week): 2 g SBE-β-CD powder is dissolved in 10 mL Saline, completely dissolve until clear.
In Vivo Dissolution Calculator
Please enter the basic information of animal experiments:
-
-
-
-
Recommended: Prepare an additional quantity of animals to account for potential losses during experiments.
Please enter your animal formula composition:
-
%DMSO +
Recommended: Keep the proportion of DMSO in working solution below 2% if your animal is weak.
-
%+
-
+%Tween-80 + +
-
%Saline +
The co-solvents required include: DMSO, . All of co-solvents are available by MedChemExpress (MCE). , Tween 80. All of co-solvents are available by MedChemExpress (MCE).
Working solution concentration: 0.22 mg/mL
Method for preparing stock solution: mg drug dissolved in μL DMSO. Stock solution concentration: mg/mL. * In solvent : -80°C, 6 months; -20°C, 1 month (protect from light)
1. Take μL DMSO stock solution;
2. Add μL .
μL , mix evenly;
3. Then add μL Tween 80, mix evenly;
4. Then add μL
Please ensure that the stock solution in the first step is dissolved to a clear state, and add co-solvents in sequence. You can use ultrasonic heating (ultrasonic cleaner, recommended frequency 20-40 kHz), vortexing, etc. to assist dissolution.


Reinheit & Dokumentation
-
Data Sheet (288 KB)
-
SDS (252 KB)
- English - EN (252 KB)
- Français - FR (252 KB)
- Deutsch - DE (252 KB)
- Norwegian - NO (252 KB)
- Español - ES (252 KB)
- Swedish - SV (252 KB)
- Italian - IT (252 KB)
- Korean - KR (252 KB)
- Portuguese - PT (252 KB)
-
Handling Instructions (2659 KB)
Verweise
[1]. Prapapan Pimkaew, et al. Zederone, a sesquiterpene from Curcuma elata Roxb, is hepatotoxic in mice. Int J Toxicol. 2013 Nov-Dec;32(6):454-62. [Content Brief]
[2]. Zhilei Zhang, et al. A study of zederone for the inhibition on ovarian cancer cell proliferation through mTOR/p70s6K signalling pathway. J BUON. 2020 Mar-Apr;25(2):785-791. [Content Brief]
[3]. Pimkaew P, et al. Interactions of sesquiterpenes zederone and germacrone with the human cytochrome P450 system. Toxicol In Vitro. 2013 Sep;27(6):2005-12. [Content Brief]
[6]. Borah S, Sarkar P, Sharma HK. Zederone Improves the Fecal Microbial Profile in Dementia Induced Rat Model: A First Report. CNS Neurol Disord Drug Targets. 2022;21(4):335-342. [Content Brief]


Complete Stock Solution Preparation Table
Please refer to the solubility information to select the appropriate solvent. Once prepared, please aliquot and store the solution to prevent product inactivation from repeated freeze-thaw cycles.
Storage method and period of stock solution: -80°C, 6 months; -20°C, 1 month (protect from light). When stored at -80°C, please use it within 6 months. When stored at -20°C, please use it within 1 month.
| Optional Solvent | Concentration Solvent Mass | 1 mg | 5 mg | 10 mg | 25 mg |
|---|---|---|---|---|---|
| DMSO | 1 mM | 4.0601 mL | 20.3004 mL | 40.6009 mL | 101.5022 mL |
| 5 mM | 0.8120 mL | 4.0601 mL | 8.1202 mL | 20.3004 mL | |
| 10 mM | 0.4060 mL | 2.0300 mL | 4.0601 mL | 10.1502 mL | |
| 15 mM | 0.2707 mL | 1.3534 mL | 2.7067 mL | 6.7668 mL | |
| 20 mM | 0.2030 mL | 1.0150 mL | 2.0300 mL | 5.0751 mL | |
| 25 mM | 0.1624 mL | 0.8120 mL | 1.6240 mL | 4.0601 mL | |
| 30 mM | 0.1353 mL | 0.6767 mL | 1.3534 mL | 3.3834 mL | |
| 40 mM | 0.1015 mL | 0.5075 mL | 1.0150 mL | 2.5376 mL | |
| 50 mM | 0.0812 mL | 0.4060 mL | 0.8120 mL | 2.0300 mL | |
| 60 mM | 0.0677 mL | 0.3383 mL | 0.6767 mL | 1.6917 mL | |
| 80 mM | 0.0508 mL | 0.2538 mL | 0.5075 mL | 1.2688 mL | |
| 100 mM | 0.0406 mL | 0.2030 mL | 0.4060 mL | 1.0150 mL |


Zederone Related Classifications
HY-N1050 Related Classifications
 Powered by Bioz