



Harmol
Based on 1 publication(s) in Google Scholar
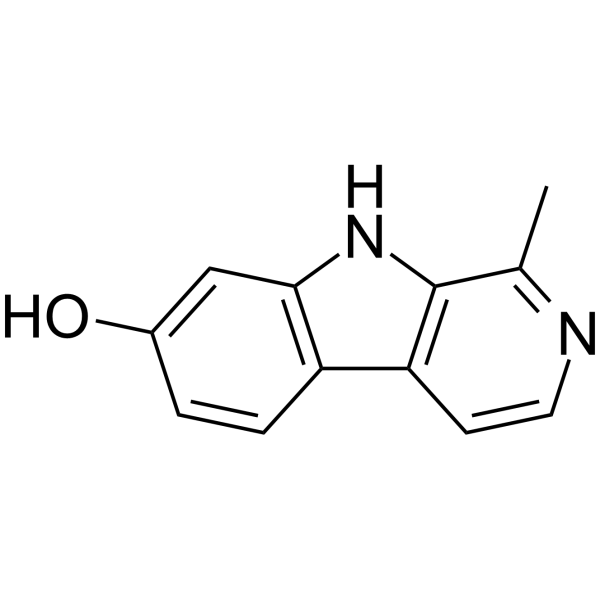
Harmol is an orally active β-carboline alkaloid. Harmol is a TFEB activator and monoamine oxidase inhibitor. Harmol can induce cell mitosis, Autophagy and Apoptosis. Harmol promotes the degradation of α-synuclein by regulating the autophagy-lysosomal pathway. Harmol has anti-tumor, anti-depressant and anti-aging activities. Harmol improves motor impairment in a mouse Parkinson's disease model.
For research use only. We do not sell to patients.
- Purity : 99.81%
- CAS No.: 487-03-6
- Formula: C12H10N2O
- Molecular Weight:198.22
-
Storage:Powder -20°C, 3 years ; In solvent -80°C, 6 months , -20°C, 1 month

To place orders, for customer services and technical support, please contact: MedChemExpress USA
Tel: 609-228-6898 E-mail: [email protected] [email protected]


-
 Biological Activity
-
Chemical Information
-
Solvent & Solubility
- Protocols
- Purity & Documentation
- References
-
 Help & FAQs


-
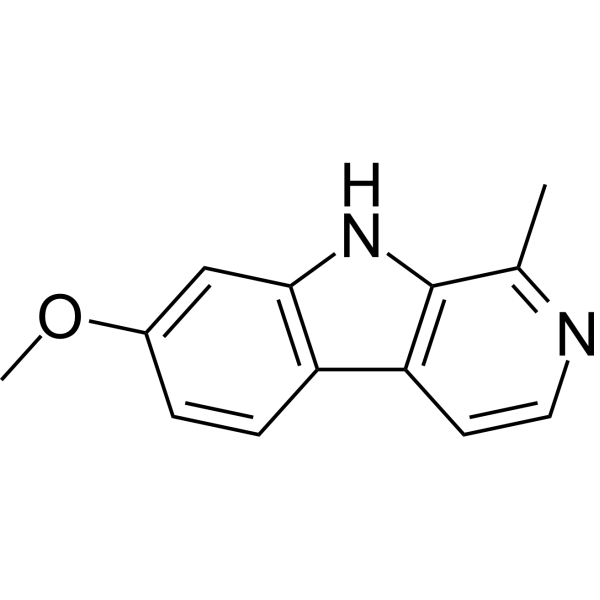
HY-N0737A
HarmineDYRK Inhibitor -
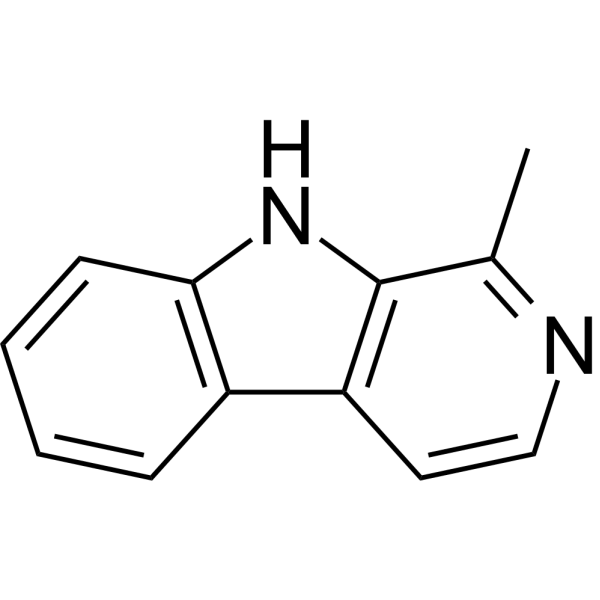
HY-101392
HarmaneMAO Inhibitor -
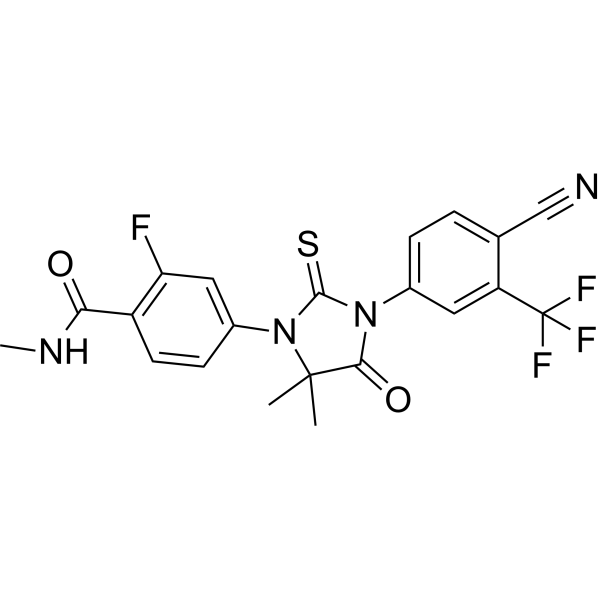
HY-70002
EnzalutamideAndrogen Receptor Antagonist -
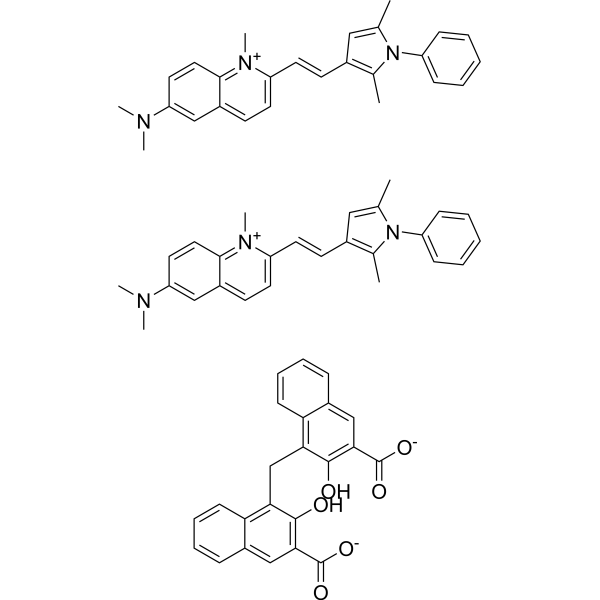
HY-A0293
Pyrvinium pamoateWnt Inhibitor -

HY-125515
TetrahydroharmineMAO-A Inhibitor -
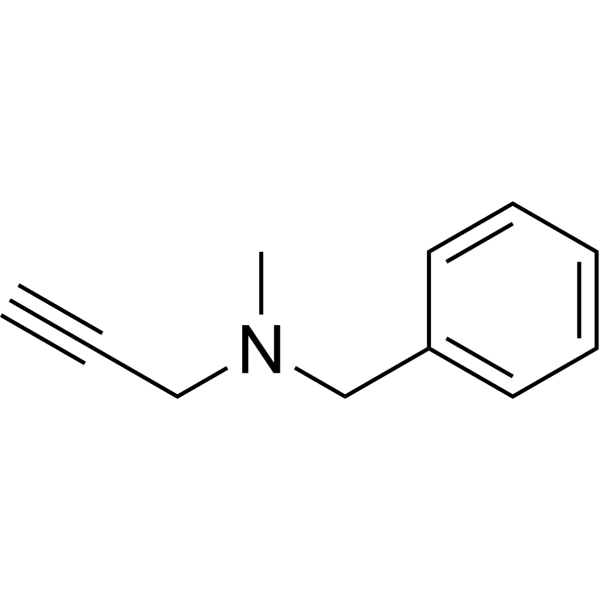
HY-A0091A
PargylineMonoamine Oxidase Inhibitor -

HY-107811R
Harmol (Standard)Monoamine Oxidase Inhibitor -
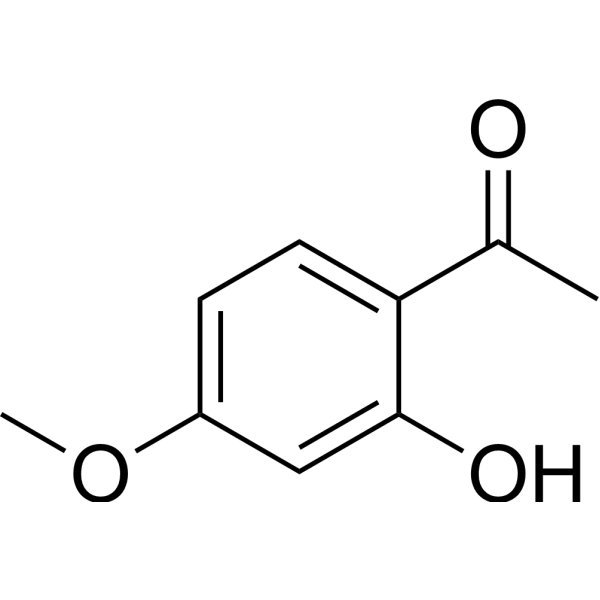
HY-N0159
PaeonolAutophagy Inducer -
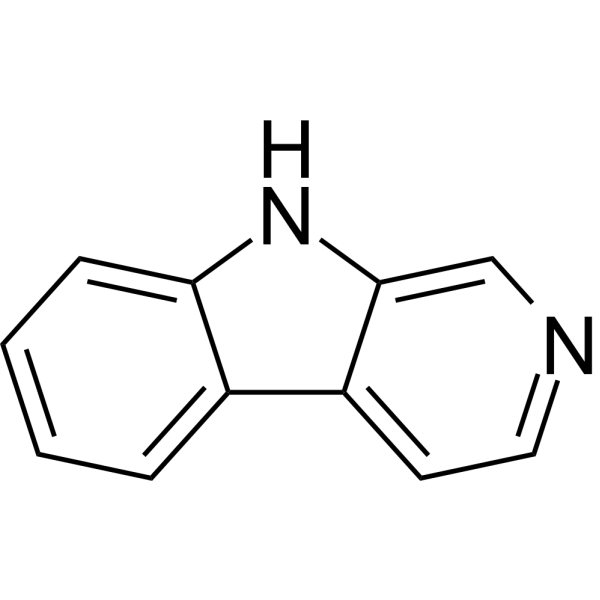
HY-W008566
NorharmaneMAO Inhibitor -
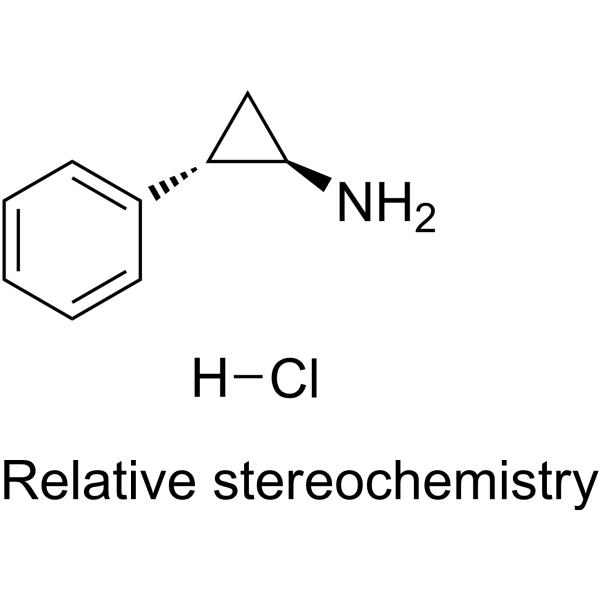
HY-17447A
Tranylcypromine hydrochlorideLSD1/MAO Inhibitor -
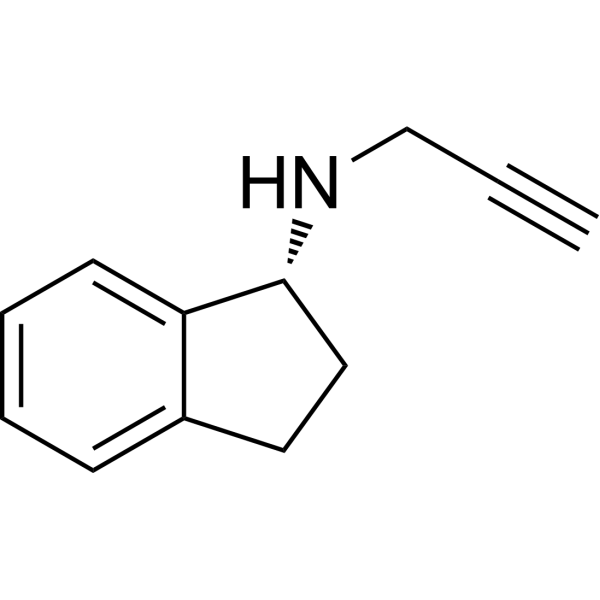
HY-14605A
RasagilineMAO Inhibitor -
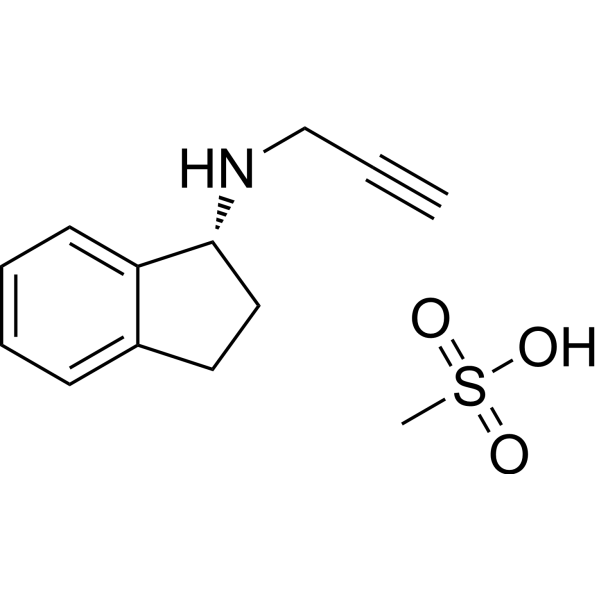
HY-14605
Rasagiline mesylateMAO Inhibitor
Publications Citing Use of MedChemExpress (MCE) Harmol
More Customer Validation & Images

-
Cell Proliferation/Viability Assay

-
Cell Imaging/Staining

-
RT-PCR

-
WB

-
In Vivo Efficacy Study

All α-synuclein Isoforms
More

Biological Activity
Description
IC50 & Target
|
α-synuclein |
In Vitro
Harmol (3-30 μM, 6-24 h) reduces α-syn levels in PC12 cells in a dose- and time-dependent manner[1].
Harmol (30 μM, 24 h) promotes the nuclear translocation of exogenous TFEB (transcription factor EB) in HeLa cells and enhances the nuclear translocation of endogenous TFEB in N2a cells, along with a restoration of autophagic flux and lysosomal biogenesis[1].
Harmol (0-100 μM, 24 and 48 h) shows time- and dose-dependent inhibition of U251MG cell proliferation and induces cell death[2].
Harmol (0-100 μM, 0-48 h) inhibits the expression of survivin in U251MG cells and promotes the expression of LC3-I and LC3-II proteins, suppressing the Akt/mTOR pathway and inducing cell autophagy and apoptosis[2].
Harmol (0-100 μM, 0-24 h) exhibits slight cytotoxicity in A549 and H226 cells, but shows strong cytotoxicity in H596, inhibiting tumor proliferation[3].
Harmol (60 μM, 3-6 h) enhances the activity of caspase-3, caspase-6, caspase-8, and caspase-9, increases the cleavage of RAPA (an endogenous substrate for caspase-3), inducing apoptosis in H596 cells[3].
Harmol (1.3 μg/mL, 1-3 h) activates autophagy in C2C12 cells[4].
Harmol (1.3 μg/mL, 45-60 min) activates mitochondria-specific autophagy in C2C12 cells, occurring only in inactive TMRM-negative mitochondria[4].
Harmol (1.3 μg/mL, 16 h) upregulates the expression of markers for mitochondrial function in C2C12 cells[4].
Harmol (1.3 μg/mL, 0-20 h) has a specific inhibitory effect on MAO-B[4].
Harmol reduces GABAergic neurotransmission but does not completely inhibit the binding of GABA to GABAARs; GABAAR activity is crucial for Harmol-mediated mitochondrial depolarization and relies on mitochondrial function[4].
MedChemExpress (MCE) has not independently confirmed the accuracy of these methods. They are for reference only.
-
Cell Line:Tet-on inducible PC12 cells[1]; Hela, N2a[1]; C2C12[4]
-
Concentration:3, 10, 30 μM; 30 μM; 1.3 μg/mL; 1.3 μg/mL
-
Incubation Time:6, 12, 24 h; 24 h; 16 h; 24 h
-
Result:Reduced the phosphorylation (p-) and total α-syn levels in PC12 cells in a dose-dependent and time-dependent manner, showing pro-degradation activity between 6 and 24 hours.
Enhanced the LC3B-Ⅱ/LC3B-Ⅰ ratio in PC12 cells, promoted TFEB expression, and increased AMPK phosphorylation at the THr172 site. It facilitated the nuclear translocation of exogenous TFEB in HeLa cells and the translocation of endogenous TFEB to the nucleus in N2a cells. This also increased the expression of the lysosomal marker LAMP1 (lysosomal-associated membrane protein 1) precursor and the mature form of CTSD (cathepsin D).
Showed in C2C12, the protein expression of the mitochondrial transcription and replication factor TFAM and components of complex III (UQCRC2) and complex V (ATP5a) was significantly elevated, along with an increase in polyamine spermidine levels, while DYRK1A phosphorylation remained unchanged.
-
Cell Line:Hela, PC12
-
Concentration:30 μM
-
Incubation Time:24 h
-
Result:Caused 60% of Flag-TFEB to undergo nuclear translocation and significantly increased the lysosomal content.
In Vivo
Harmol (100 mg/kg, administered by gavage, once daily for three weeks) has a mild anxiety-reducing effect in mice[4].
Harmol (100 mg/kg, orally, for three months) improves insulin, glucose homeostasis, and metabolic adaptations in obese mice, with no impact on kidney function[4].
Harmol (15 μg/kg, orally, from day 0 to 50) extends the lifespan of invertebrates[4].
Harmol (100 mg/kg, orally, for two months) delays frailty in aging mice[4].
MedChemExpress (MCE) has not independently confirmed the accuracy of these methods. They are for reference only.
-
Animal Model:A53T α-syn mice[1]
-
Dosage:10, 20, 40 mg/kg; twice a day; one month
-
Administration:i.g.
-
Result:Made mice climb the rod faster, spent more time on the spinning rod, travelled farther in open areas, increased their step frequency and standing posture, reduced posture width, stride, step length, swing, and showed recovery of autonomous movement behavior.
Reduced the expression of α-syn and p62 in the brain’s substantia nigra and prefrontal cortex.
Increased the phosphorylation levels of AMPK Thr172 and TFEB in the substantia nigra, while decreasing the phosphorylation level of mTOR Ser2448.Increased the expression of LC3B-II/LC3B-I, LAMP1, pro-CTSD, and mature ctsd in the substantia nigra, while reducing the expression of p62 and p-ULK1(Ser757)/ULK1.
-
Animal Model:Male mice[4]
-
Dosage:100 mg/kg, single dose; 100 mg/kg, daily, 3 weeks
-
Administration:i.g.
-
Result:Showed no change in blood glucose levels, with no change in fasting-mediated ketone body increase, and low permeability of the blood-brain barrier. High levels in the liver and plasma, but low levels in the brain. The mitochondrial autophagy marker PINK1 was elevated, while the phosphorylation levels of AMPK target ACC1 or the autophagy marker LC3-II/LC3-I were unaffected.
Showed no change in the time mice spent in the aversive area (center) versus the non-aversive area (border), with no differences in elevated plus maze tests, and significantly less time spent in the dark/light box.
Increased phosphorylation of ACC2 in the liver and BAT, and levels of the mitochondrial autophagy marker PINK1 were also significantly elevated in the liver, BAT, and soleus.
- Detection of Apoptosis
- TUNEL staining for apoptotic DNA fragmentation
- Annexin V plus membrane-impermeant dye apoptosis staining
- Human pluripotent stem cell midbrain dopaminergic neuron differentiation
- Autophagy
- Apoptosis Solutions
- Lysosome and acidic-vesicle live-cell staining
- Macroautophagy Solutions
- How to Choose the Right Model Animal


Chemical Information
-
CAS No. 487-03-6
-
Appearance Solid
-
Molecular Weight 198.22
-
Formula C12H10N2O
-
Color Off-white to light yellow
-
SMILES
OC1=CC2=C(C=C1)C3=C(C(C)=NC=C3)N2
-
Structure Classification
-
Shipping
Room temperature in continental US; may vary elsewhere.
-
Storage
Powder -20°C 3 years In solvent -80°C 6 months -20°C 1 month


Publications (1)
-
Journal Impact Factor
-
Most Recent
-
Virol J
2024 May 27;21(1):118. PMID: 38802860
Harmol purchased from MedChemExpress. Usage Cited in: Virol J. 2024 May 27;21(1):118. [Abstract]
Vero cells in 96-well plate were cultured with Harmol (0, 6.25, 12.5, 25.0, 50.0, 100.0, 150.0, 200.0, 250.0 µM) for 48 h. Cell viability was measured using a CCK-8 assay.
Harmol purchased from MedChemExpress. Usage Cited in: Virol J. 2024 May 27;21(1):118. [Abstract]
Vero cells were infected with HSV-1 F (MOI = 0.5) and then they were treated with Harmol (12.5 µM) or ACV (1 µM) for 24 h. Images were obtained by inverted microscope.
Harmol purchased from MedChemExpress. Usage Cited in: Virol J. 2024 May 27;21(1):118. [Abstract]
The expression of gD-1 mRNA was detected by qPCR analysis treated with Harmol (0, 3.125, 6.25, 12.5 μM).
Harmol purchased from MedChemExpress. Usage Cited in: Virol J. 2024 May 27;21(1):118. [Abstract]
An MOI of 0.5 of HSV-1 F-infected Vero cells were treated with 0.02% DMSO, Harmol (0, 3.12, 6.25, 12.5 µM), ACV (1.0 µM) and Harmol (3.12, 6.25, 12.5 µM) + ACV (1.0 µM) for 48 h. The gD-1 protein expression was detected by Western Blot assay.
Harmol purchased from MedChemExpress. Usage Cited in: Virol J. 2024 May 27;21(1):118. [Abstract]
Corneal images at 3 dpi and 5 dpi were obtained following HSV-1 infection treated with Harmol (0.01 mg/kg, 5 µL/mouse).


Solvent & Solubility
In Vitro:
DMSO : 83.33 mg/mL (420.39 mM; Need ultrasonic; Hygroscopic DMSO has a significant impact on the solubility of product, please use newly opened DMSO)
Please refer to the solubility information to select the appropriate solvent. Once prepared, please aliquot and store the solution to prevent product inactivation from repeated freeze-thaw cycles.
Storage method and period of stock solution: -80°C, 6 months; -20°C, 1 month. When stored at -80°C, please use it within 6 months. When stored at -20°C, please use it within 1 month.
Please refer to the solubility information to select the appropriate solvent. Once prepared, please aliquot and store the solution to prevent product inactivation from repeated freeze-thaw cycles.
Storage method and period of stock solution: -80°C, 6 months; -20°C, 1 month. When stored at -80°C, please use it within 6 months. When stored at -20°C, please use it within 1 month.
Concentration (start) × Volume (start) = Concentration (final) × Volume (final)
In Vivo:
Select the appropriate dissolution method based on your experimental animal and administration route.
- For the following dissolution methods, please ensure to first prepare a clear stock solution using an In Vitro approach and then sequentially add co-solvents:
- To ensure reliable experimental results, the clarified stock solution can be appropriately stored based on storage conditions. As for the working solution for In Vivo experiments, it is recommended to prepare freshly and use it on the same day.
- The percentages shown for the solvents indicate their volumetric ratio in the final prepared solution. If precipitation or phase separation occurs during preparation, heat and/or sonication can be used to aid dissolution.
Add each solvent one by one: 10% DMSO 40% PEG300 5% Tween-80 45% Saline
Solubility: ≥ 2.08 mg/mL (10.49 mM); Clear solution
This protocol yields a clear solution of ≥ 2.08 mg/mL (saturation unknown).
Taking 1 mL working solution as an example, add 100 μL DMSO stock solution (20.8 mg/mL) to 400 μL PEG300, and mix evenly; then add 50 μL Tween-80 and mix evenly; then add 450 μL Saline to adjust the volume to 1 mL.
Preparation of Saline: Dissolve 0.9 g sodium chloride in ddH₂O and dilute to 100 mL to obtain a clear Saline solution.
In Vivo Dissolution Calculator
Please enter the basic information of animal experiments:
-
-
-
-
Recommended: Prepare an additional quantity of animals to account for potential losses during experiments.
Please enter your animal formula composition:
-
%DMSO +
Recommended: Keep the proportion of DMSO in working solution below 2% if your animal is weak.
-
%+
-
+%Tween-80 + +
-
%Saline +
The co-solvents required include: DMSO, . All of co-solvents are available by MedChemExpress (MCE). , Tween 80. All of co-solvents are available by MedChemExpress (MCE).
Working solution concentration: 0.22 mg/mL
Method for preparing stock solution: mg drug dissolved in μL DMSO. Stock solution concentration: mg/mL.
1. Take μL DMSO stock solution;
2. Add μL .
μL , mix evenly;
3. Then add μL Tween 80, mix evenly;
4. Then add μL
Please ensure that the stock solution in the first step is dissolved to a clear state, and add co-solvents in sequence. You can use ultrasonic heating (ultrasonic cleaner, recommended frequency 20-40 kHz), vortexing, etc. to assist dissolution.


Purity & Documentation
-
Data Sheet (287 KB)
-
SDS (394 KB)
- English - EN (394 KB)
- Français - FR (394 KB)
- Deutsch - DE (394 KB)
- Norwegian - NO (394 KB)
- Español - ES (394 KB)
- Swedish - SV (394 KB)
- Italian - IT (394 KB)
- Korean - KR (394 KB)
- Portuguese - PT (394 KB)
-
Handling Instructions (2659 KB)
References
[1]. Jie Xu,et al. Harmol promotes α-synuclein degradation and improves motor impairment in Parkinson's models via regulating autophagy-lysosome pathway. NPJ Parkinsons Dis. 2022 Aug 6;8(1):100. [Content Brief]
[2]. Akihisa Abe ,et al. Harmol induces autophagy and subsequent apoptosis in U251MG human glioma cells through the downregulation of surviving. Oncol Rep. 2013 Apr;29(4):1333-42. [Content Brief]
[3]. Akihisa Abe,et al. Harmol induces apoptosis by caspase-8 activation independently of Fas/Fas ligand interaction in human lung carcinoma H596 cells. Anticancer Drugs. 009 Jun;20(5):373-81. [Content Brief]
[4]. Luis Filipe Costa-Machado, et al. Peripheral modulation of antidepressant targets MAO-B and GABAAR by harmol induces mitohormesis and delays aging in preclinical models. Nat Commun. 2023 May 15;14(1):2779. [Content Brief]


Complete Stock Solution Preparation Table
Please refer to the solubility information to select the appropriate solvent. Once prepared, please aliquot and store the solution to prevent product inactivation from repeated freeze-thaw cycles.
Storage method and period of stock solution: -80°C, 6 months; -20°C, 1 month. When stored at -80°C, please use it within 6 months. When stored at -20°C, please use it within 1 month.
| Optional Solvent | Concentration Solvent Mass | 1 mg | 5 mg | 10 mg | 25 mg |
|---|---|---|---|---|---|
| DMSO | 1 mM | 5.0449 mL | 25.2245 mL | 50.4490 mL | 126.1225 mL |
| 5 mM | 1.0090 mL | 5.0449 mL | 10.0898 mL | 25.2245 mL | |
| 10 mM | 0.5045 mL | 2.5224 mL | 5.0449 mL | 12.6122 mL | |
| 15 mM | 0.3363 mL | 1.6816 mL | 3.3633 mL | 8.4082 mL | |
| 20 mM | 0.2522 mL | 1.2612 mL | 2.5224 mL | 6.3061 mL | |
| 25 mM | 0.2018 mL | 1.0090 mL | 2.0180 mL | 5.0449 mL | |
| 30 mM | 0.1682 mL | 0.8408 mL | 1.6816 mL | 4.2041 mL | |
| 40 mM | 0.1261 mL | 0.6306 mL | 1.2612 mL | 3.1531 mL | |
| 50 mM | 0.1009 mL | 0.5045 mL | 1.0090 mL | 2.5224 mL | |
| 60 mM | 0.0841 mL | 0.4204 mL | 0.8408 mL | 2.1020 mL | |
| 80 mM | 0.0631 mL | 0.3153 mL | 0.6306 mL | 1.5765 mL | |
| 100 mM | 0.0504 mL | 0.2522 mL | 0.5045 mL | 1.2612 mL |


Harmol Related Classifications
HY-107811 Related Classifications
 Powered by Bioz