



Phenformin
Based on 11 publication(s) in Google Scholar
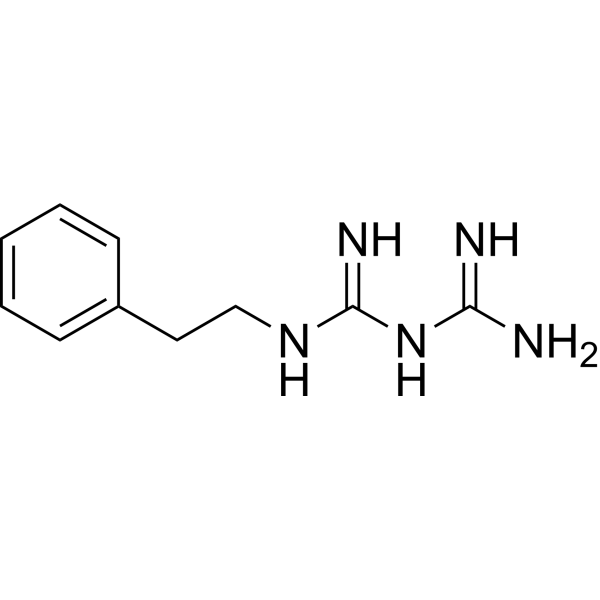
Phenformin (Phenethylbiguanide) is an orally active biguanide hypoglycemic agent. Phenformin inhibits mitochondrial respiratory chain complex I, leading to an increased AMP/ATP ratio, activation of AMPK, and subsequent inhibition of the mTOR pathway, thereby suppressing cell proliferation, inducing apoptosis and autophagy. Phenformin inhibits cancer stem cells (CSCs) and possesses potent antitumor potential.
For research use only. We do not sell to patients.
- Purity : 98.02%
- CAS No.: 114-86-3
- Formula: C10H15N5
- Molecular Weight:205.26
-
Storage:
RT, protect from light.
In solvent -80°C, 1 year , -20°C, 6 months

To place orders, for customer services and technical support, please contact: MedChemExpress USA
Tel: 609-228-6898 E-mail: [email protected] [email protected]


-
 Biological Activity
-
Chemical Information
-
Solvent & Solubility
- Protocols
- Purity & Documentation
- References
-
 Help & FAQs


-
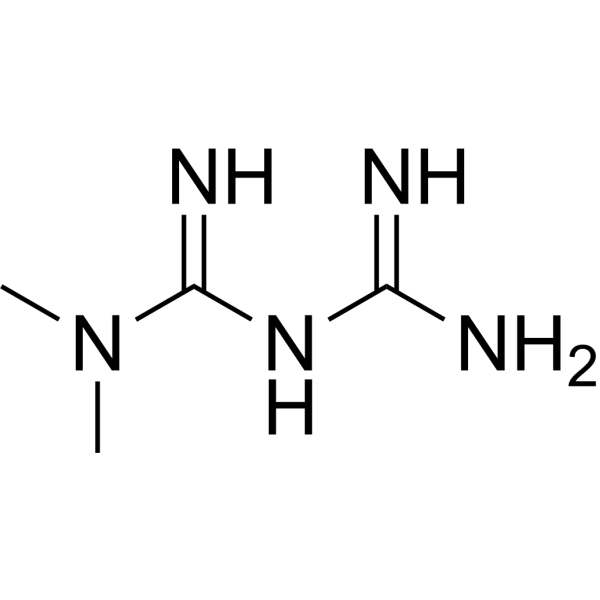
HY-B0627
MetforminAntihyperglycemic Agent -
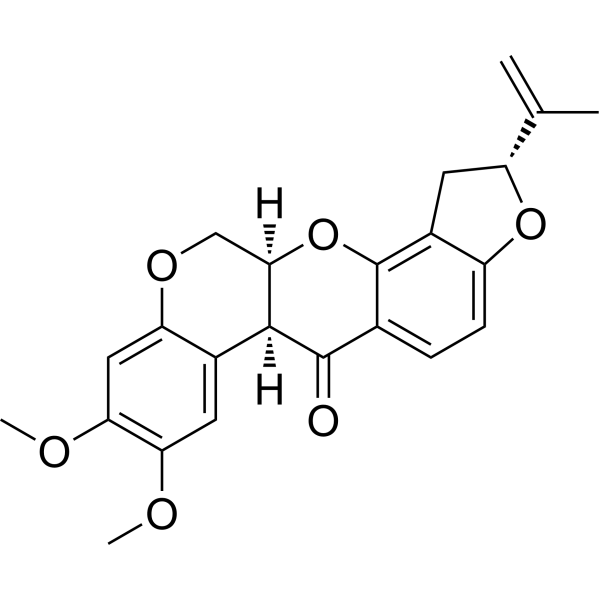
HY-B1756
RotenoneMitochondrial Complex I Inhibitor -
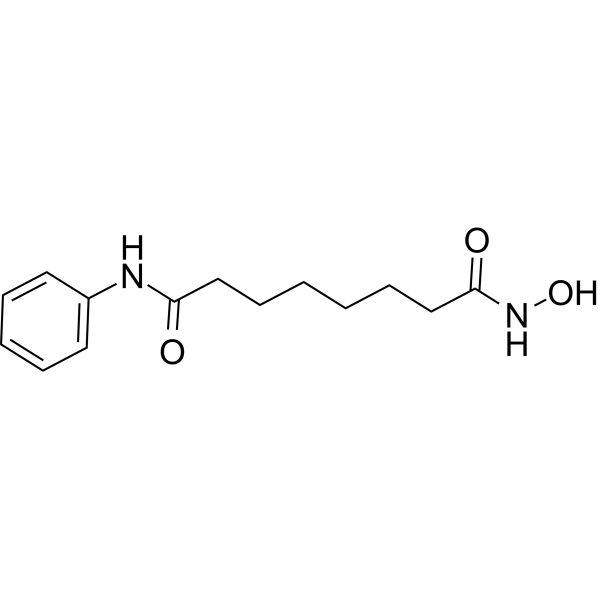
HY-10221
VorinostatHDAC Inhibitor -
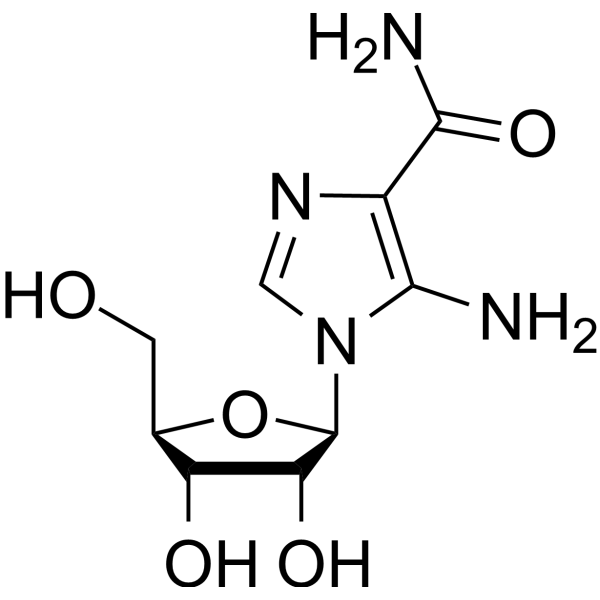
HY-13417
AICARAMPK Activator -
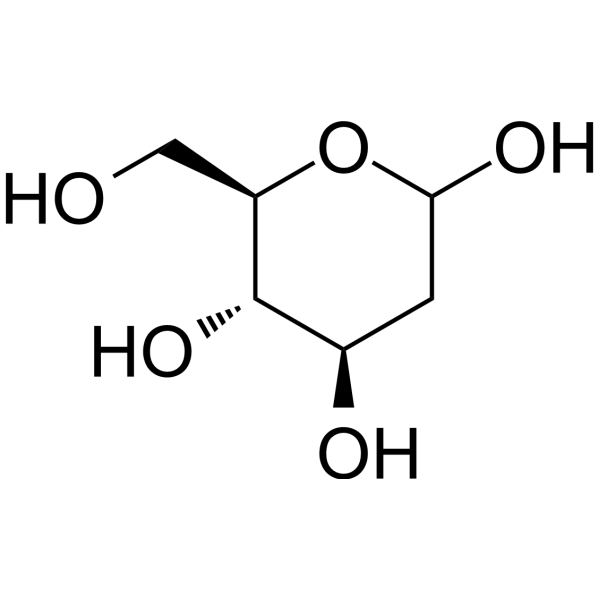
HY-13966
2-Deoxy-D-glucoseGlycolysis Inhibitor -
HY-17386
RosiglitazonePPARγ Agonist -
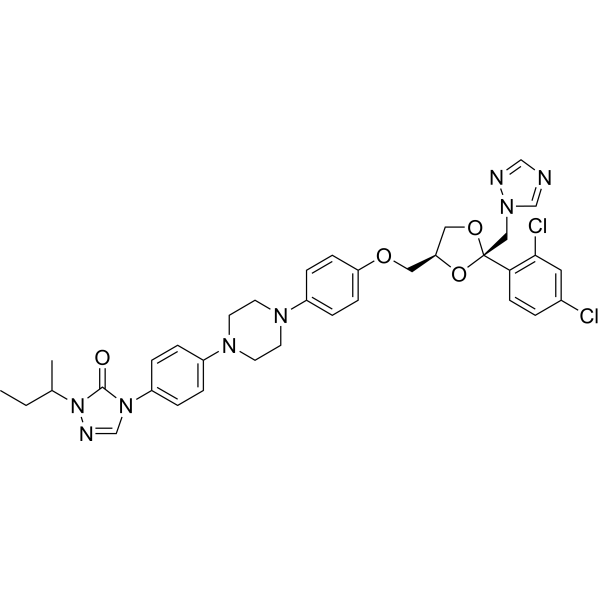
HY-17514
ItraconazoleAntifungal Agent -
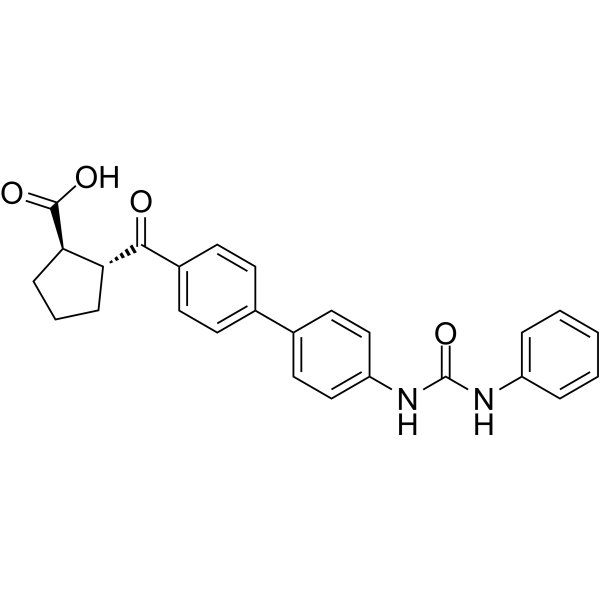
HY-10038
A 922500DGAT-1 Inhibitor -
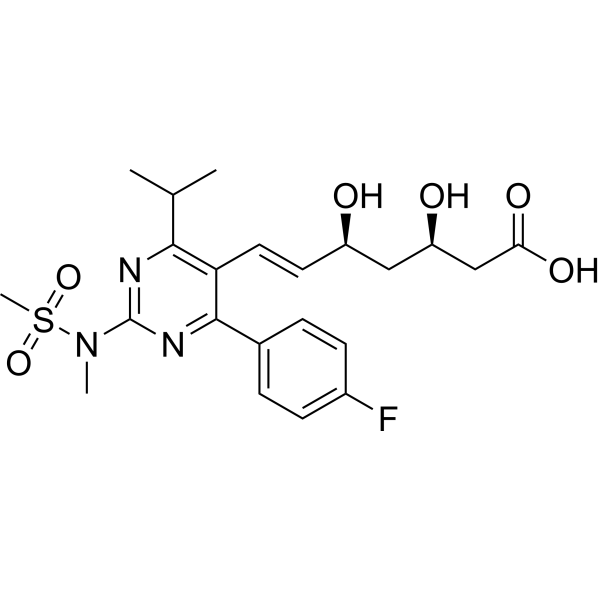
HY-17504A
RosuvastatinHMGCR Inhibitor -
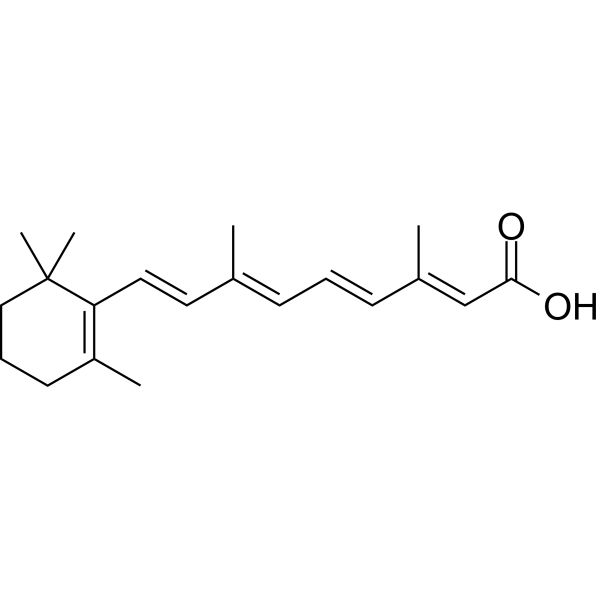
HY-14649
Retinoic acidRAR Agonist -
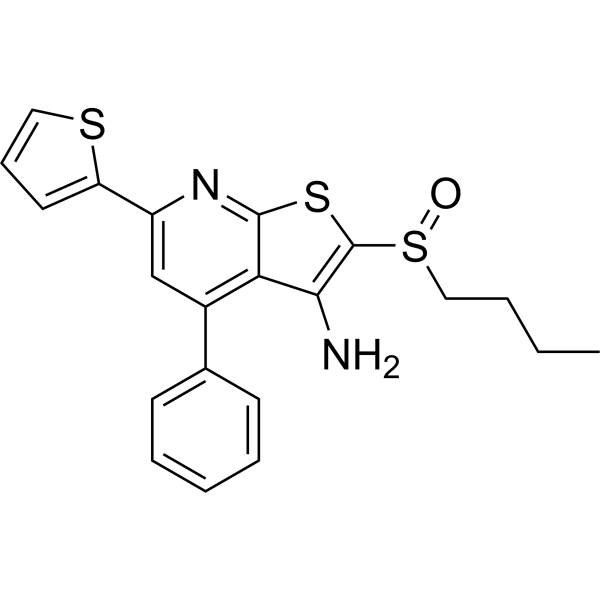
HY-16968
SW03329115-PGDH Inhibitor -
HY-12212
OmaveloxoloneNrf2 Activator
Publications Citing Use of MedChemExpress (MCE) Phenformin
More- Nat Commun. 2019 Jul 1;10(1):2901. [Abstract]
- J Nanobiotechnology. 2026 Feb 7;24(1):227. [Abstract]
- Cell Rep Med. 2022 Nov 15;3(11):100802. [Abstract]
- NPJ Precis Oncol. 2026 Mar 6;10(1):156. [Abstract]
- Int J Biol Macromol. 2025 Aug 21;323(Pt 1):147047. [Abstract]
- Mol Syst Biol. 2023 Jul 11;19(7):e11267. [Abstract]
- Life Sci. 2019 Jan 15:217:243-250. [Abstract]
- Cancer Immunol Immunother. 2026 May 22. [Abstract]
- Pharmaceuticals (Basel). 2024 Sep 19;17(9):1234. [Abstract]
- ACS Omega. 2022 Jan 18;7(4):3293-3311. [Abstract]
- Biomed Pharmacother. 2020 Aug:128:110216. [Abstract]
 Customer Validation & Images

-
Cell Proliferation/Viability Assay
-
Bio/Physico-chemical Assay
-
Cell Proliferation/Viability Assay
-
Bio/Physico-chemical Assay
-
WB
All AMPK Isoforms
More

Biological Activity
Description
Cellular Effect
|
Cell Line

|
Type | Value | Description | References |
|---|---|---|---|---|
| UMUC3 | IC50 |
0.25 mM
Compound: 12
|
Antiproliferative activity in human UMUC3 cells assessed as cell growth inhibition
Antiproliferative activity in human UMUC3 cells assessed as cell growth inhibition
|
[PMID: 36205714] |
In Vitro
Phenformin induces G0/G1 cell cycle arrest, reduces the proportion of S phase in a dose-dependent manner, inhibits CDK4 and D glycine, and activates p21 protein in SKOV3, IGROV-1 and Hey ovarian cancer cell lines[1].
Phenformin acts synergistically with SCH772984 (HY-50846) to inhibit proliferation, induce apoptosis, and completely suppress the mTOR signaling pathway in NF1-mutant melanoma cells[1].
Combination treatment with Phenformin and Temozolomide (HY-17364) exerts a synergistic effect on the death of glioblastoma stem cells, thereby enhancing the anti-tumor activity of Phenformin and reducing its required administration concentration[1].
Phenformin (0.5-5 mM; 24-72 h) reduces the viability and promotes apoptosis of SET2 JAK2V617F cells, with corresponding IC50 values of 2 mM, 1.79 mM and 0.79 mM at 24 h, 48 h and 72 h, respectively[2].
Phenformin (2 mM; 12-48 h) inhibits the proliferation of human cholangiocarcinoma cell lines RBE and Huh28 in a time-dependent manner, with significant effects observed at 12, 24 and 48 h[3].
Phenformin (2 mM; 10 days) inhibits the colony-forming ability of human cholangiocarcinoma cell lines RBE and Huh28[3].
Phenformin (2 mM; 24 h) induces apoptosis in human cholangiocarcinoma cell lines RBE and Huh28 after 24 h of treatment[3].
Phenformin (2 mM; 24 h) upregulates the mRNA expression of autophagy-related genes (BECN1, ATG5, ATG7) in human cholangiocarcinoma cell lines RBE and Huh28 after 24 hours of treatment[3].
Phenformin (2 mM; 12-48 h) exerts a significantly stronger inhibitory effect on the viability of LKB1-knockdown RBE and Huh28 human cholangiocarcinoma cell lines than on cells transfected with negative control siRNA at 12, 24, and 48 h[3].
MedChemExpress (MCE) has not independently confirmed the accuracy of these methods. They are for reference only.
-
Cell Line:RBE, Huh28 human cholangiocarcinoma (CCA) cell lines
-
Concentration:2 mM
-
Incubation Time:12 h, 24 h, 48 h
-
Result:Significantly inhibited proliferation of RBE and Huh28 cells compared to 0 mM controls at 12, 24, and 48 hours, with increasing inhibition over time.
-
Cell Line:RBE, Huh28 human cholangiocarcinoma (CCA) cell lines
-
Concentration:2 mM
-
Incubation Time:24 h
-
Result:Significantly increased the apoptosis rate of RBE and Huh28 cells compared to 0 mM controls.
-
Cell Line:RBE, Huh28 human cholangiocarcinoma (CCA) cell lines
-
Concentration:2 mM
-
Incubation Time:24 h
-
Result:Significantly elevated the mRNA expression levels of BECN1, ATG5, and ATG7 in RBE and Huh28 cells compared to 0 mM controls.
-
Cell Line:LKB1-knockdown RBE, Huh28 human cholangiocarcinoma (CCA) cell lines
-
Concentration:2 mM
-
Incubation Time:12 h, 24 h, 48 h
-
Result:Further reduced the viability of RBE and Huh28 cells treated with phenformin compared to negative control siRNA-transfected cells.
In Vivo
Phenformin (2 mM; intratumoral; every 4 days; 30 days) significantly inhibits RBE tumor volume in a subcutaneous cholangiocarcinoma xenograft mouse model[3].
MedChemExpress (MCE) has not independently confirmed the accuracy of these methods. They are for reference only.
-
Animal Model:C57BL/6 Pepboy (female, lethally irradiated, transplanted with bone marrow cells from conditional vavCre knockin Jak2V617F mice)[2]
-
Dosage:40 mg/kg
-
Administration:i.p.; daily; 45 days
-
Result:Increased frequencies of LSK (Lin⁻Sca-1⁺c-Kit⁺), myeloid progenitors (Lin⁻Sca-1⁺c-Kitʰⁱᵍʰ), and multipotent progenitors (MPP: Lin⁻Sca-1⁺c-Kit⁺CD150⁻CD48⁺) in the bone marrow; showed no effects on peripheral blood counts, spleen weight, megakaryocyte count, erythroid precursors frequency, or ex vivo clonogenic capacity.
-
Animal Model:BALB/c (nu/nu) (male, 5 weeks old, mean weight 15 g, subcutaneous RBE cell xenograft)[3]
-
Dosage:2 mM
-
Administration:intratumoral; every 4 days; 30 days
-
Result:Exhibited significantly smaller RBE tumor volume compared with the control group after 28 days.
- Annexin V plus membrane-impermeant dye apoptosis staining
- BrdU Incorporation Assay
- Somatic Cell Culture
- CFSE Dye Dilution Proliferation Assay
- Dye-dilution cell tracking and proliferation staining
- CCK-8/WST-8 Cell Proliferation Assay
- Protocol for Cell Cycle
- Cell Counting-Based Growth Curve Assay
- Colony Formation (Clonogenic) Assay
- Cell Viability Determination by MTT Colorimetric Assay
- EdU Incorporation Assay (Click Chemistry-Based DNA Synthesis Measurement)
- Ki-67 Immunostaining Proliferation Assay
- Detection of Apoptosis
- TUNEL staining for apoptotic DNA fragmentation
- PCNA Immunodetection Proliferation Assay
- Protocol for Cell Counting and Cell Density Analysis
- Autophagy
- Apoptosis Solutions
- Lysosome and acidic-vesicle live-cell staining
- MTT Cell Proliferation Assay
- Macroautophagy Solutions


Chemical Information
-
CAS No. 114-86-3
-
Appearance Solid
-
Molecular Weight 205.26
-
Formula C10H15N5
-
Color White to off-white
-
SMILES
NC(NC(NCCC1=CC=CC=C1)=N)=N
-
Synonyms
Phenethylbiguanide
-
Shipping
Room temperature in continental US; may vary elsewhere.
-
Storage
RT, protect from light
In solvent -80°C 1 year -20°C 6 months


Publications (11)
-
Journal Impact Factor
-
Most Recent
-
Nat Commun
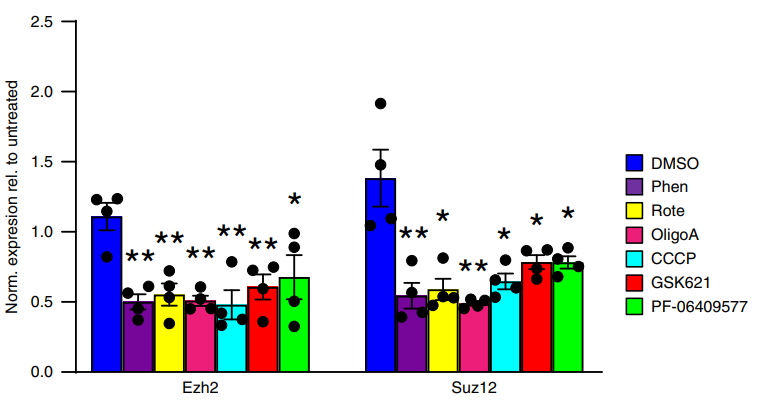
An ErbB2/c-Src axis links bioenergetics with PRC2 translation to drive epigenetic reprogramming and mammary tumorigenesis. [Abstract]2019 Jul 1;10(1):2901. PMID: 31263101
Phenformin purchased from MedChemExpress. Usage Cited in: Nat Commun. 2019 Jul 1;10(1):2901. [Abstract]
Phenformin hydrochloride (Phen) (100 µM; 24 h) markedly reduced Ezh2 and Suz12 protein expression in NIC cells.
-
J Nanobiotechnology
Nanozymes subvert pharmacological conventions: insights from counteracting the placental side effects of TiO₂ nanozymes. [Abstract]2026 Feb 7;24(1):227. PMID: 41654860 -
Cell Rep Med
Estrogen-related receptor alpha drives mitochondrial biogenesis and resistance to neoadjuvant chemoradiation in esophageal cancer. [Abstract]2022 Nov 15;3(11):100802. PMID: 36334593
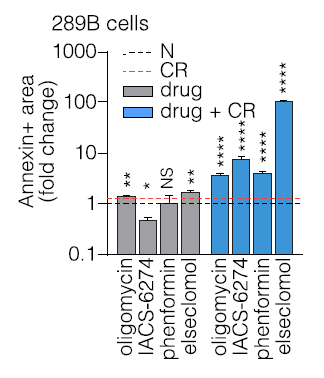
Phenformin purchased from MedChemExpress. Usage Cited in: Cell Rep Med. 2022 Nov 15;3(11):100802. [Abstract]
Phenformin hydrochloride (370 µM) strongly potentiated the induction of apoptosis of 298B cells in response to CR.
-
NPJ Precis Oncol
Cuproptosis-associated PDHA1 promotes sarcoma progression and immunotherapy responsiveness via the E2F1-PD-L1 axis: a multi-omics and clinical validation study. [Abstract]2026 Mar 6;10(1):156. PMID: 41792370
Phenformin purchased from MedChemExpress. Usage Cited in: NPJ Precis Oncol. 2026 Mar 6;10(1):156. [Abstract]
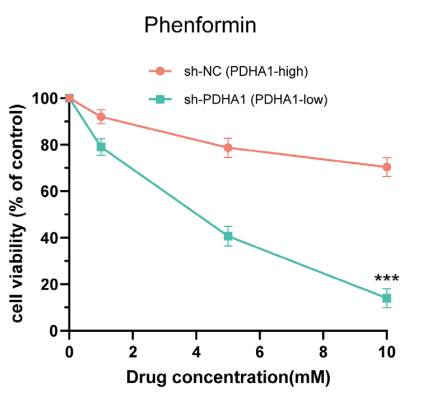
Dose-response curves showing the effect of phenformin (4-10 mM; 48 h) on cell viability in MG63 cells with high (sh-NC) and low PDHA1 expression (sh-PDHA1).
-
Int J Biol Macromol
Bacterial cellulose membrane integrating phase-transited lysozyme nanofilm loaded with biguanides for dressing treatment of atopic dermatitis. [Abstract]2025 Aug 21;323(Pt 1):147047. PMID: 40848785 -
Mol Syst Biol
A metabolic map of the DNA damage response identifies PRDX1 in the control of nuclear ROS scavenging and aspartate availability. [Abstract]2023 Jul 11;19(7):e11267. PMID: 37259925
Phenformin purchased from MedChemExpress. Usage Cited in: Mol Syst Biol. 2023 Jul 11;19(7):e11267. [Abstract]
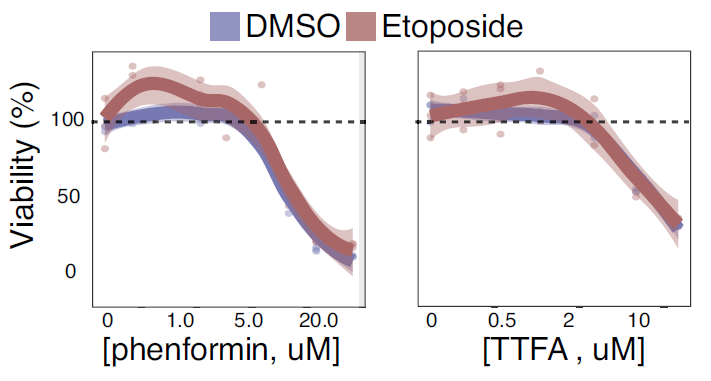
Phenformin hydrochloride (1-20 μM) increased cell survival of U2-OS cells treated with etoposide.
-
Life Sci
FTY720 inhibits the activation of pancreatic stellate cells by promoting apoptosis and suppressing autophagy via the AMPK/mTOR pathway. [Abstract]2019 Jan 15:217:243-250. PMID: 30550889 -
Cancer Immunol Immunother
GFI1 enhances MHC-I expression in tumor cells and augments tumor responsiveness to PD-1/PD-L1 inhibitors. [Abstract]2026 May 22. PMID: 42174278 -
Pharmaceuticals (Basel)
2024 Sep 19;17(9):1234. PMID: 39338396
Phenformin purchased from MedChemExpress. Usage Cited in: Pharmaceuticals (Basel). 2024 Sep 19;17(9):1234. [Abstract]
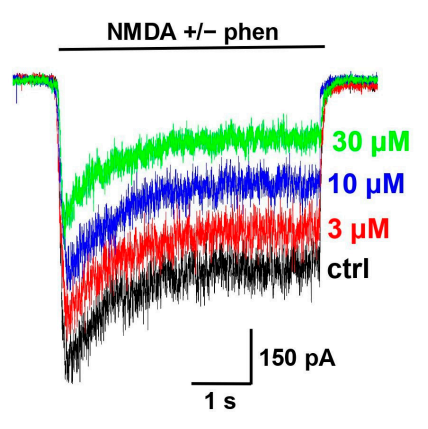
Representative recordings illustrating the NMDA receptors inhibition by Phenformin hydrochloride (Phen) (3-30 μM).
-
ACS Omega
Proteomic Changes in the Monolayer and Spheroid Melanoma Cell Models of Acquired Resistance to BRAF and MEK1/2 Inhibitors. [Abstract]2022 Jan 18;7(4):3293-3311. PMID: 35128241 -
Biomed Pharmacother
Saikosaponin A inhibits the activation of pancreatic stellate cells by suppressing autophagy and the NLRP3 inflammasome via the AMPK/mTOR pathway. [Abstract]2020 Aug:128:110216. PMID: 32497863


Solvent & Solubility
In Vitro:
H2O : 350 mg/mL (1705.15 mM; Need ultrasonic)
Please refer to the solubility information to select the appropriate solvent. Once prepared, please aliquot and store the solution to prevent product inactivation from repeated freeze-thaw cycles.
Storage method and period of stock solution: -80°C, 1 year; -20°C, 6 months. When stored at -80°C, please use it within 1 year. When stored at -20°C, please use it within 6 months.
* Note: If you choose water as the stock solution, please dilute it to the working solution, then filter and sterilize it with a 0.22 μm filter before use.
Please refer to the solubility information to select the appropriate solvent. Once prepared, please aliquot and store the solution to prevent product inactivation from repeated freeze-thaw cycles.
Storage method and period of stock solution: -80°C, 1 year; -20°C, 6 months. When stored at -80°C, please use it within 1 year. When stored at -20°C, please use it within 6 months.
* Note: If you choose water as the stock solution, please dilute it to the working solution, then filter and sterilize it with a 0.22 μm filter before use.
Concentration (start) × Volume (start) = Concentration (final) × Volume (final)


Purity & Documentation
-
Data Sheet (278 KB)
-
SDS (394 KB)
- English - EN (394 KB)
- Français - FR (394 KB)
- Deutsch - DE (394 KB)
- Norwegian - NO (394 KB)
- Español - ES (394 KB)
- Swedish - SV (394 KB)
- Italian - IT (394 KB)
- Korean - KR (394 KB)
- Portuguese - PT (394 KB)
-
Handling Instructions (2659 KB)
References
[1]. García Rubiño ME, et al. Phenformin as an Anticancer Agent: Challenges and Prospects. Int J Mol Sci. 2019;20(13):3316. Published 2019 Jul 5. [Content Brief]
[2]. Alves-Silva AB, et al. Phenformin increases early hematopoietic progenitors in the Jak2V617F murine model. Invest New Drugs. 2022;40(3):576-585. [Content Brief]
[3]. Hu S, et al. Phenformin inhibits cell proliferation and induces cell apoptosis and autophagy in cholangiocarcinoma. Mol Med Rep. 2018;17(4):6028-6032. [Content Brief]
[4]. Yendapally R, et al. A review of phenformin, metformin, and imeglimin. Drug Dev Res. 2020;81(4):390-401. [Content Brief]


Complete Stock Solution Preparation Table
Please refer to the solubility information to select the appropriate solvent. Once prepared, please aliquot and store the solution to prevent product inactivation from repeated freeze-thaw cycles.
Storage method and period of stock solution: -80°C, 1 year; -20°C, 6 months. When stored at -80°C, please use it within 1 year. When stored at -20°C, please use it within 6 months.
| Optional Solvent | Concentration Solvent Mass | 1 mg | 5 mg | 10 mg | 25 mg |
|---|---|---|---|---|---|
| H2O | 1 mM | 4.8719 mL | 24.3593 mL | 48.7187 mL | 121.7967 mL |
| 5 mM | 0.9744 mL | 4.8719 mL | 9.7437 mL | 24.3593 mL | |
| 10 mM | 0.4872 mL | 2.4359 mL | 4.8719 mL | 12.1797 mL | |
| 15 mM | 0.3248 mL | 1.6240 mL | 3.2479 mL | 8.1198 mL | |
| 20 mM | 0.2436 mL | 1.2180 mL | 2.4359 mL | 6.0898 mL | |
| 25 mM | 0.1949 mL | 0.9744 mL | 1.9487 mL | 4.8719 mL | |
| 30 mM | 0.1624 mL | 0.8120 mL | 1.6240 mL | 4.0599 mL | |
| 40 mM | 0.1218 mL | 0.6090 mL | 1.2180 mL | 3.0449 mL | |
| 50 mM | 0.0974 mL | 0.4872 mL | 0.9744 mL | 2.4359 mL | |
| 60 mM | 0.0812 mL | 0.4060 mL | 0.8120 mL | 2.0299 mL | |
| 80 mM | 0.0609 mL | 0.3045 mL | 0.6090 mL | 1.5225 mL | |
| 100 mM | 0.0487 mL | 0.2436 mL | 0.4872 mL | 1.2180 mL |
* Note: If you choose water as the stock solution, please dilute it to the working solution, then filter and sterilize it with a 0.22 μm filter before use.


Phenformin Related Classifications
HY-16397 Related Classifications
 Powered by Bioz
Keywords
- Phenformin
- 114-86-3
- Phenethylbiguanide
- Mitochondrial Metabolism
- AMPK
- Apoptosis
- Autophagy
- mTOR
- glioblastoma stem cells
- SKOV3 cells
- mitochondrial respiratory chain complex I
- Hey ovarian cancer cell lines
- AMP-activated protein kinase
- apoptosis
- mTOR regulatory complex
- IGROV-1 cells
- autophagy
- type 2 diabetes mellitus
- Inhibitor
- inhibitor
- inhibit