



Sodium metavanadate, 99%
Based on 1 publication(s) in Google Scholar
Sodium metavanadate, 99% (Sodium vanadate (V), 99%) is an orally active phosphate structural analog and protein tyrosine phosphatase (PTPases) inhibitor. Sodium metavanadate, 99% mimics phosphate to interfere with phosphoprotein reactions, inhibits GAPDH, Na+/K+-ATPase and microbial membrane ATPase, and acts as a terminal electron acceptor for anaerobic respiration. Sodium metavanadate, 99% induces ROS production, G2/M phase arrest, mitochondrial membrane potential loss and apoptosis in breast cancer cells, and reduces tumor volume in tumor-bearing mice. Sodium metavanadate, 99% also exhibits oral insulin-sensitizing and metabolic regulatory activities, and reduces plasmodium parasitemia levels. Sodium metavanadate, 99% can be used in studies related to cadmium exposure-induced metabolic syndrome, plasmodium infection, breast cancer and type 1 diabetes.
For research use only. We do not sell to patients.
- Purity : 99.34%
- CAS No.: 13718-26-8
- Formula: NaVO3
- Molecular Weight:121.93
-
Storage:
Store at room temperature, keep dry and cool.
In solvent -80°C, 1 year , -20°C, 6 months


To place orders, for customer services and technical support, please contact: MedChemExpress USA
Tel: 609-228-6898 E-mail: [email protected] [email protected]


-
 Biological Activity
-
Chemical Information
-
Solvent & Solubility
- Protocols
- Purity & Documentation
- References
-
 Help & FAQs


-

HY-Y1103A
Iron(II) sulfate heptahydrate, for cell culture, 99%Iron Salt -

HY-Y1881A
Copper sulfate pentahydrateBiochemical Reagents -
HY-D0852
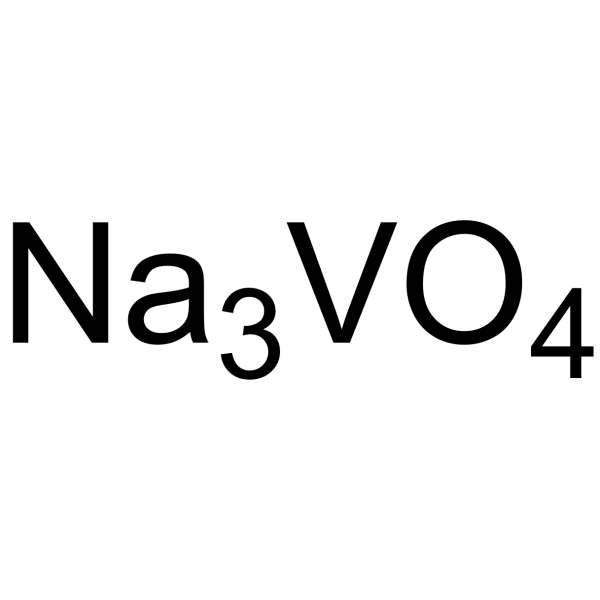
Sodium orthovanadateProtein Tyrosine/Alkaline Phosphatase Inhibitor -
HY-K0202
Protein A/G Magnetic Beads -

HY-Y1267D
Magnesium sulfate, for cell cultureAnti-Inflammatory Agent -

HY-Y1267
Magnesium sulfateAnti-Inflammatory Agent -

HY-Y0344D
Sodium chloride, for cell cultureBiochemical Assay Reagent -

HY-Y0537
Potassium chloride, AR, 99.5%Potassium Supplement
Publications Citing Use of MedChemExpress (MCE) Sodium metavanadate, 99%
MoreAll Parasite Isoforms
More

Biological Activity
Description
Cellular Effect
|
Cell Line

|
Type | Value | Description | References |
|---|---|---|---|---|
| 4T1 | IC50 |
8.19 μM
|
Cytotoxicity against murine breast cancer 4T1 cells assessed as reduction in cell viability incubated for 24 hrs by MTT assay.
Cytotoxicity against murine breast cancer 4T1 cells assessed as reduction in cell viability incubated for 24 hrs by MTT assay.
|
33689084 |
| 4T1 | IC50 |
1.92 μM
|
Cytotoxicity against murine breast cancer 4T1 cells assessed as reduction in cell viability incubated for 48 hrs by MTT assay.
Cytotoxicity against murine breast cancer 4T1 cells assessed as reduction in cell viability incubated for 48 hrs by MTT assay.
|
33689084 |
In Vitro
Sodium metavanadate, 99% (0.1-20 mM; 24 h) exhibits medium-dependent inhibitory effects. In Sabouraud's complex medium, the MIC of SC-1 is 16 mM, while the MICs of DBVPG 6173, 6174/6176 and 6037/6220 are 4 mM, 6 mM and 8 mM, respectively. In YNB basal medium, SC-1 tolerates concentrations up to 10 mM, whereas DBVPG 6173 and 6037 are significantly inhibited when the concentration exceeds 4 mM[1].
Sodium metavanadate, 99% (2-10 mM; 18-24 h) exhibits strain-dependent uptake, reduction and resistance characteristics in Saccharomyces cerevisiae: SC-1 does not accumulate vanadate at high concentrations, but accumulates moderate levels of total vanadium and reduces it to vanadyl ions at lower concentrations; DBVPG 6173 and 6037 show significant differences in accumulation levels and cannot reduce this compound; the drug resistance of SC-1 is constitutive, and pre-exposure does not alter its growth lag phase[1].
Sodium metavanadate, 99% (0.01-1000 μM; 24-48 h) potently inhibits the proliferation of 4T1 mouse breast cancer cells, with an IC50 value of 8.19 μM at 24 h and 1.92 μM at 48 h, and autophagy enhances this inhibitory effect[4].
Sodium metavanadate, 99% (1-100 μM; 24 h) increases the intracellular ROS level in 4T1 mouse breast cancer cells in a concentration-dependent manner[4].
Sodium metavanadate, 99% (10-100 μM; 24 h) induces G2/M phase arrest in 4T1 mouse breast cancer cells[4].
Sodium metavanadate, 99% (1-100 μM; 24 h) induces concentration-dependent apoptosis in 4T1 mouse breast cancer cells, and necroptosis is not involved in this cell death pathway[4].
Sodium metavanadate, 99% (1-100 μM; 24 h) reduces the mitochondrial membrane potential of 4T1 mouse breast cancer cells in a concentration-dependent manner[4].
MedChemExpress (MCE) has not independently confirmed the accuracy of these methods. They are for reference only. Further protocols information, click here.
-
Cell Line:murine breast cancer 4T1 cells
-
Concentration:0.01, 0.1, 1, 10, 100 and 1000 μM (24 h, 48 h); 10 μM (24 h, combined with 3-M (AHY-19312))
-
Incubation Time:24 h; 48 h
-
Result:Exhibited time- and concentration-dependent cytotoxicity toward 4T1 cells.
Reached IC50 values of 8.19 μM at 24 h and 1.92 μM at 48 h.
Enhanced cytotoxicity was observed when co-treated with autophagy inducer rapamycin.
Slightly increased cell viability was observed when co-treated with autophagy inhibitor 3-MA.
-
Cell Line:murine breast cancer 4T1 cells
-
Concentration:10, 50 and 100 μM
-
Incubation Time:24 h
-
Result:Induced G2/M phase arrest in 4T1 cells.
Increased the proportion of cells in G2/M phase to 13.7% at 10 μM, 14.8% at 50 μM, and 42.1% at 100 μM, compared to 9.8% in control.
Decreased the proportion of cells in G0/G1 phase to 34.4% at 10 μM, 32.8% at 50 μM, and 16.7% at 100 μM, compared to 51.0% in control.
-
Cell Line:murine breast cancer 4T1 cells
-
Concentration:1, 10, 50 and 100 μM (apoptosis assays); 10 μM (24 h, combined with 20-80 μM Nec-1 (HY-15760))
-
Incubation Time:24 h
-
Result:Induced apoptosis in 4T1 cells in a concentration-dependent manner.
Reached total apoptosis rates of 11.3% at 1 μM, 14.6% at 10 μM, and 39.3% at 100 μM, compared to 6.5% in control.
Reached early apoptosis rates of 10.1% at 1 μM, 13.5% at 10 μM, and 15.8% at 100 μM.
Reached late apoptosis rates of 1.2% at 1 μM, 1.1% at 10 μM, and 23.5% at 100 μM.
Did not show significant reduction in apoptosis when co-treated with Nec-1.
In Vivo
Sodium metavanadate, 99% (10 mg/kg/day; oral administration; once daily for 4 consecutive days) reduces the level of parasitemia in CD-1 mice infected with Plasmodium yoelii yoelii, and causes extensive ultrastructural damage to the cell membrane, mitochondria and nucleus of all blood-stage malaria parasites[3].
Sodium metavanadate, 99% (10 mg/kg/day; p.o.; daily administration; for 4 consecutive days) does not alter the red blood cell morphology of healthy CD-1 mice[3].
Sodium metavanadate, 99% (10-20 mg/kg; i.p.; once daily; for 21 consecutive days) exhibits dose-dependent anticancer activity in a mouse breast cancer xenograft model. Doses higher than 15 mg/kg inhibit tumor growth but cause significant body weight loss[4].
Sodium metavanadate, 99% (0.1-0.3 mg/mL; p.o.; ad libitum access to drug-containing drinking water; 7 days) delays the onset of spontaneous type 1 diabetes in BB-DP rats in a concentration-dependent manner, reduces the severity of diabetes in affected rats, but cannot prevent disease onset[5].
MedChemExpress (MCE) has not independently confirmed the accuracy of these methods. They are for reference only.
-
Animal Model:Wistar (male, starting weight 80-100 g, conditioned to 120 g prior to study initiation, cadmium-induced metabolic syndrome model)[2]
-
Dosage:5 μM/kg
-
Administration:p.o.; twice a week; 2 months
-
Result:Reduced fasting glycemia by 27% after 1 month.
Improved oral glucose tolerance significantly at 30, 60, and 90 minutes after 1 month.
Increased glycogen levels above control levels by 65.6% in liver, 190% in muscle, 91.5% in heart, 46.3% in renal cortex, and 115% in renal medulla after 1 month.
Lowered BMI and body fat percentage significantly from the first week of monitoring.
Reduced cadmium concentrations in liver, kidney, heart, muscle, and adipose tissue after 1 month.
Increased adipose tissue triglyceride content by 18.5% compared to untreated cadmium group after 1 month.
Reduced fasting glycemia slightly significantly after 2 months.
Improved oral glucose tolerance with glucose levels reduced by 28.6% at 30 minutes and 21.8% at 60 minutes after 2 months.
Increased glycogen levels above control levels by 45.2% in liver, 289.4% in muscle, 57.1% in heart, and 129.1% in renal medulla after 2 months.
Reduced cadmium concentrations in liver, kidney, heart, and muscle after 2 months.
Reduced adipose tissue triglyceride content by 12.8% compared to the 1-month monitoring time point after 2 months.
Exerted no effect on dyslipidemia or tissue triglyceride storage (except adipose tissue changes noted).
Altered no parameters in non-cadmium-exposed control rats.
-
Animal Model:CD-1 (male, 30 g, infected i.p. with 25×103 erythrocytes parasitized with Plasmodium yoelii yoelii)[3]
-
Dosage:10 mg/kg/day
-
Administration:p.o.; daily; 4 days
-
Result:Reduced parasitemia by approximately 50% compared to untreated infected mice.
Caused discontinuity of the parasitophorous vacuole, nuclear membranes, and digestive vacuole, plus edema in the cytoplasm and nucleoplasm in ring-stage parasites.
Induced cytoplasmic lipid droplets and vacuoles, plus lipid droplets and damage within mitochondrial matrices in mature trophozoites.
Caused cytoplasmic lipid droplets, mitochondrial membrane discontinuities and swelling, increased perinuclear cistern size, and cellular disorganization in immature schizont-stage merozoites.
-
Animal Model:CD-1 (male, 30 g)[3]
-
Dosage:10 mg/kg/day
-
Administration:p.o.; daily; 4 days
-
Result:Observed no morphological changes to erythrocytes; erythrocytes maintained their characteristic biconcave disc shape.
-
Animal Model:BALB/C nude mice (4-6 weeks of age)[4]
-
Dosage:10 mg/kg; 15 mg/kg; 20 mg/kg
-
Administration:i.p.; daily; 21 days
-
Result:Reduced tumor growth by approximately 50% compared to the saline group at 10 mg/kg.
Reduced tumor growth by approximately 64% compared to the saline group at 15 mg/kg and 20 mg/kg.
Did not cause obvious weight loss at 10 mg/kg.
Caused significant body weight decreases at 15 mg/kg and 20 mg/kg.
Reduced tumor cell proliferation (measured by Ki-67 density) in a dose-dependent manner.
Reduced tumor microvessel density (measured by CD31 staining) in a dose-dependent manner.
Increased tumor cell apoptosis (measured by TUNEL assay) in a dose-dependent manner.
Decreased pro-caspase-9 and PARP protein levels significantly across all doses.
Caused slight down-regulation of pro-caspase-3 across all doses.
-
Animal Model:Bio-Breeding Diabetes Prone (BB-DP) (40-50 days old, 140-250 g, prediabetic, spontaneously developing autoimmune diabetes)[5]
-
Dosage:0.1 mg/mL; 0.2 mg/mL; 0.3 mg/mL
-
Administration:p.o.; ad libitum in drinking water; 7 days
-
Result:Delayed age of diabetes onset to 84.8 days (0.1 mg/mL), 102.8 days (0.2 mg/mL), and 105.5 days (0.3 mg/mL).
Reduced diabetes incidence to 50% (0.1 mg/mL), 45.8% (0.2 mg/mL), and 45.8% (0.3 mg/mL).
Decreased blood glucose levels from 95.6 mg/dl to 63 mg/dl (0.1 mg/mL), 100.3 mg/dl to 73 mg/dl (0.2 mg/mL), and 98 mg/dl to 73 mg/dl (0.3 mg/mL) in week 1, with levels remaining lower than controls over 90 days.
Recorded blood glucose at diabetes onset as 276.8 mg/dl (0.1 mg/mL) and 286.1 mg/dl (0.2 mg/mL).
Increased body weight slightly from 309.4 g to 344 g across all treated groups in the two weeks before diabetes onset.
Reduced insulinemia to 0.43 µg/l (0.1 mg/mL), 0.38 µg/l (0.2 mg/mL), and 0.27 µg/l (0.3 mg/mL) at 7 days post-treatment start; levels rose to 1.15 µg/l (0.1 mg/mL), 2.89 µg/l (0.2 mg/mL), and 0.86 µg/l (0.3 mg/mL) by day 90.


Chemical Information
-
CAS No. 13718-26-8
-
Appearance Solid
-
Molecular Weight 121.93
-
Formula NaVO3
-
Color Off-white to light yellow
-
SMILES
O=[V](=O)([Na])=O
-
Synonyms
Sodium vanadate(V), 99%
-
Shipping
Room temperature in continental US; may vary elsewhere.
-
Storage
Store at room temperature, keep dry and cool
In solvent -80°C 1 year -20°C 6 months


Publications (1)
-
Journal Impact Factor
-
Most Recent


Solvent & Solubility
In Vitro:
H2O : 10 mg/mL (82.01 mM; Need ultrasonic)
Please refer to the solubility information to select the appropriate solvent. Once prepared, please aliquot and store the solution to prevent product inactivation from repeated freeze-thaw cycles.
Storage method and period of stock solution: -80°C, 1 year; -20°C, 6 months. When stored at -80°C, please use it within 1 year. When stored at -20°C, please use it within 6 months.
* Note: If you choose water as the stock solution, please dilute it to the working solution, then filter and sterilize it with a 0.22 μm filter before use.
Please refer to the solubility information to select the appropriate solvent. Once prepared, please aliquot and store the solution to prevent product inactivation from repeated freeze-thaw cycles.
Storage method and period of stock solution: -80°C, 1 year; -20°C, 6 months. When stored at -80°C, please use it within 1 year. When stored at -20°C, please use it within 6 months.
* Note: If you choose water as the stock solution, please dilute it to the working solution, then filter and sterilize it with a 0.22 μm filter before use.
Concentration (start) × Volume (start) = Concentration (final) × Volume (final)

Protocols
-
Research Protocol for Infectious Diseases
Infectious-disease experiments test how pathogens interact with host barriers, innate immune receptors, inflammatory signaling, pathogen replication, and tissue injury; pattern-recognition receptors such as TLRs, RIG-I-like receptors, NOD-like receptors, and inflammasomes detect microbial molecules and activate NF-κB, interferon, and cytokine responses. The central hypothesis is that infection severity reflects the balance between pathogen burden and host response: protective inflammation restricts pathogen growth, whereas excessive or mislocalized inflammation contributes to tissue damage and disease phenotype. Unresolved questions include which host pathways are protective versus pathogenic, why some infection models fail to translate to human disease, and which combined readouts best predict clinically relevant infection outcomes.
-
Mitochondrial membrane-potential fluorescent assay
Mitochondrial membrane potential fluorescent assays estimate ΔΨm in living cells using lipophilic cationic dyes such as TMRM, TMRE, rhodamine 123, and JC-1, which accumulate in mitochondria according to membrane polarization; loss of signal after FCCP or CCCP treatment is interpreted as mitochondrial depolarization. TMRM/TMRE and rhodamine 123 are commonly used for semi-quantitative live-cell microscopy or flow cytometry, while JC-1 can report a shift from red aggregate fluorescence to green monomer fluorescence during depolarization; interpretation requires controls because dye concentration, quenching mode, cell type, dye efflux, and mitochondrial mass can affect fluorescence independently of ΔΨm.
-
Annexin V plus membrane-impermeant dye apoptosis staining
Annexin V-based apoptosis assays rely on the detection of phosphatidylserine (PS) externalization from the inner leaflet of the plasma membrane to the outer leaflet, an early biochemical hallmark of apoptosis. Fluorescently labeled Annexin V binds PS in a calcium-dependent manner, enabling identification of early apoptotic cells by flow cytometry or fluorescence microscopy. When combined with a membrane-impermeant DNA-binding dye (e. g. , propidium iodide), this approach allows discrimination between viable (Annexin V−/dye−), early apoptotic (Annexin V+/dye−), and late apoptotic or necrotic (Annexin V+/dye+) cell populations by assessing membrane integrity and PS exposure.
-
ROS/oxidative-stress fluorescent staining
ROS/oxidative-stress fluorescent staining uses cell-permeant fluorogenic probes that become fluorescent after oxidation inside cells or tissues; commonly used examples include DCFH-DA/DCFDA for broad cellular oxidant detection, DHE for superoxide-related signal detection, MitoSOX for mitochondrial superoxide-related signal detection, and CellROX probes for oxidative-stress-associated fluorescence readouts. The assay detects probe oxidation rather than a single ROS species unless the probe and analysis method have been chemically validated for that species. DCFH-DA enters cells, is deacetylated by intracellular esterases to DCFH, and produces fluorescent DCF after oxidation, so the readout is used as an operational measure of total cellular oxidative stress rather than a species-specific ROS measurement. DHE and MitoSOX can report superoxide-related oxidation, but red fluorescence alone can include non-specific ethidium-like oxidation products; HPLC or optimized spectral approaches are
-
Protocol for Cell Cycle
Cell-cycle analysis by flow cytometry measures DNA content in single cells to estimate the fraction of cells in G0/G1, S, and G2/M phases. Propidium iodide intercalates into DNA, and after RNA removal with RNase, fluorescence intensity reflects cellular DNA content: 2N cells are assigned to G0/G1, cells between 2N and 4N to S phase, and 4N cells to G2/M. DNA-content analysis alone cannot reliably separate G0 from G1 or G2 from M. Ki-67 can distinguish quiescent G0 cells from cycling cells, EdU or BrdU incorporation marks active DNA synthesis in S phase, and phospho-histone H3 staining identifies mitotic cells within the 4N population.
-
Breast Cancer Modeling
Breast cancer is a heterogeneous cancer, and it has been distinguished into four subtypes: luminal A, luminal B, HER2-positive and basal-like. Molecular mutations, epigenetic alterations, hormone exposure and immune microenvironment are related to the progression of breast cancer.
-
Research Protocol for Metabolic Diseases
AMP-activated protein kinase, AMPK, is a conserved cellular energy sensor that responds to reduced cellular energy status and coordinates metabolism by increasing ATP-generating catabolic pathways while suppressing ATP-consuming anabolic processes. In metabolic disease research, the AMPK pathway is experimentally relevant because it regulates hepatic lipid synthesis, fatty acid oxidation, glucose production, skeletal-muscle glucose disposal, mTORC1-linked biosynthesis, autophagy, mitochondrial homeostasis, and whole-body energy balance. The central pathway logic is that energy stress, metformin, exercise-like stimulation, or direct AMPK activators increase AMPKα Thr172 phosphorylation and downstream substrate phosphorylation, including ACC and RAPTOR. Phosphorylation of ACC suppresses lipogenesis and supports fatty acid oxidation, whereas phosphorylation of RAPTOR suppresses mTORC1 signaling and links cellular energy status to growth and protein synthesis control. The pathway is linked
-
Kinase activity and phosphorylation assays
Kinase activity assays measure the ability of kinases to transfer phosphate groups from ATP to specific substrates, while phosphorylation assays detect the presence and levels of phosphorylated proteins. Common methods include radiolabeled ATP incorporation (e. g. ,), ADP release detection via bioluminescence (e. g. ,[3]), enzyme-linked immunosorbent assays (ELISA) for phospho-specific epitopes (e. g. ,[6]), and microtiter-based formats for high-throughput screening (e. g. ,[8]). The ADP-Glo assay quantifies kinase activity by measuring ADP produced during phosphorylation using a luciferase-based system. Radiometric assays involve autoradiography or scintillation counting after incorporation of 32P-labeled ATP into substrate proteins. ELISA-based approaches rely on phospho-specific antibodies to detect activated kinases in cell lysates or purified samples.
-
Apoptosis
Apoptosis, also called programmed cell death, is generally characterized by distinct morphological characteristics.
-
TUNEL staining for apoptotic DNA fragmentation
TUNEL staining detects DNA strand breaks by using terminal deoxynucleotidyl transferase to add labeled nucleotides to exposed 3′-OH DNA termini, generating either microscopic staining in fixed cells or tissue sections, or fluorescence/cytometric signal in cell suspensions. TUNEL positivity reflects DNA fragmentation but should not be interpreted alone as definitive apoptosis, because TUNEL can also label necrotic, autolytic, mechanically damaged, or DNA-repair-associated DNA breaks.
-
Flow cytometric DNA-content cell-cycle staining
Flow cytometric DNA-content cell-cycle staining measures the fluorescence intensity of DNA-bound fluorochromes in single cells or nuclei to estimate DNA content distributions, allowing assignment of populations to G0/G1, S, and G2/M phases by DNA histogram deconvolution. Propidium iodide (PI) intercalates into DNA, and PI fluorescence is proportional to cellular DNA content when staining is performed under conditions that make DNA accessible and minimize non-DNA signal. Cells with G2/M DNA content are expected to show approximately twice the fluorescence intensity of G0/G1 cells, while S-phase cells occupy intermediate fluorescence values. PI-based DNA-content analysis can also detect cells with fractional DNA content, often reported as sub-G1, when DNA fragmentation and extraction during staining reduce retained DNA signal in apoptotic cells. DAPI is an alternative DNA fluorochrome for univariate DNA-content analysis, while bivariate approaches combining DNA content with proliferation
-
Research Protocol for Endocrine Diseases
Endocrine diseases often arise from disrupted hormone production, hormone signaling, or target-tissue responsiveness; for diabetes-focused endocrine disease models, insulin signaling regulates glucose uptake, hepatic glucose output, lipid metabolism, and β-cell compensation. Type 2 diabetes develops through interacting defects in insulin resistance, β-cell dysfunction, adipose inflammation, hepatic glucose overproduction, altered incretin signaling, and ectopic lipid metabolism. A major unresolved question is whether endocrine dysfunction is driven primarily by target-tissue insulin resistance, intrinsic β-cell failure, immune/inflammatory stress, or combined multi-organ failure that differs by disease stage.
-
Fluorescent plasma-membrane potential dye assay
Fluorescent plasma-membrane potential dye assays measure changes in cell membrane potential using voltage-sensitive dyes whose fluorescence changes when cells depolarize or hyperpolarize. Anionic bis-oxonol dyes such as DiBAC4(3) enter depolarized cells more readily and show increased fluorescence after intracellular binding, while hyperpolarization reduces dye accumulation and fluorescence. FMP/FLIPR membrane-potential dyes are used for faster, homogeneous microplate assays of ion-channel or receptor-mediated membrane-potential changes.
-
Mitochondrial membrane-potential and mitochondrial mass staining
Mitochondrial membrane potential staining measures the electrochemical polarization across the mitochondrial inner membrane in live cells using lipophilic cationic fluorescent probes; early rhodamine-based work showed that selective mitochondrial dye accumulation is lost when the mitochondrial transmembrane potential is dissipated. JC-1 reports mitochondrial polarization by shifting from green monomer fluorescence to red J-aggregate fluorescence as dye concentration increases within energized mitochondria; therefore, the red/green fluorescence ratio is used as a relative readout of mitochondrial membrane potential. TMRE or TMRM staining provides a single-channel relative readout because these cationic rhodamine esters accumulate in polarized mitochondria, and lower fluorescence indicates reduced mitochondrial polarization when acquisition and dye-loading conditions are controlled. Mitochondrial mass staining is commonly performed with MitoTracker Green FM or related MitoTracker dyes as
-
Apoptosis Solutions
Apoptosis is a regulated, generally non-lytic cell-death pathway that removes unwanted, damaged, infected, or abnormal cells through coordinated morphological changes, caspase activation, DNA fragmentation, and membrane remodeling. The intrinsic apoptosis pathway is controlled mainly by mitochondrial outer membrane permeabilization, BCL-2 family proteins, cytochrome c release, apoptosome formation, caspase-9 activation, and downstream executioner caspase-3/7 activation. The extrinsic apoptosis pathway is initiated by death receptors such as Fas, TNFR, and TRAIL receptors, which recruit adaptor proteins and activate caspase-8 before engaging executioner caspases or mitochondrial amplification through BID cleavage. Apoptosis is linked to many phenotypes, including cancer cell killing, tissue homeostasis, immune regulation, neurodegeneration, infection response, and treatment-induced cytotoxicity; unresolved questions include how apoptosis interacts with necroptosis, pyroptosis, ferroptos
-
Protocol for Kinase activity and phosphorylation assays
Kinase activity assays measure transfer of phosphate from ATP to a protein or peptide substrate, generating phosphorylated substrate, ADP, or incorporated radiolabeled phosphate as the readout; phosphorylation assays measure site-specific phosphorylation in cells or tissues as a proxy for kinase-pathway activation, inhibition, or substrate regulation. Phosphorylation can be detected by phospho-specific Western blot, immunoprecipitation kinase assay, phospho-immunofluorescence, phospho-flow cytometry, luminescent ADP detection, radiolabeled ATP incorporation, or reporter-based pathway assays, and these readouts can be applied to cancer cells, primary neurons, mouse tumors, organoids, inflammatory macrophages, ferroptosis studies, and mitophagy studies when the kinase target is biologically relevant.


Purity & Documentation
-
Data Sheet (307 KB)
-
SDS (789 KB)
- English - EN (789 KB)
- Français - FR (789 KB)
- Deutsch - DE (789 KB)
- Norwegian - NO (789 KB)
- Español - ES (789 KB)
- Swedish - SV (789 KB)
- Italian - IT (789 KB)
- Korean - KR (789 KB)
- Portuguese - PT (789 KB)
-
Handling Instructions (2659 KB)
References
[1]. Bisconti L, et al. Reduction of vanadate to vanadyl by a strain of Saccharomyces cerevisiae. Biometals : an international journal on the role of metal ions in biology, biochemistry, and medicine. 1997 Oct;10(4):239-46. [Content Brief]
[5]. Cheta D, et al. The influence of sodium metavanadate on the process of diabetogenesis in BB rats. Journal of cellular and molecular medicine. 2003;7(4):447-54. [Content Brief]


Complete Stock Solution Preparation Table
Please refer to the solubility information to select the appropriate solvent. Once prepared, please aliquot and store the solution to prevent product inactivation from repeated freeze-thaw cycles.
Storage method and period of stock solution: -80°C, 1 year; -20°C, 6 months. When stored at -80°C, please use it within 1 year. When stored at -20°C, please use it within 6 months.
| Optional Solvent | Concentration Solvent Mass | 1 mg | 5 mg | 10 mg | 25 mg |
|---|---|---|---|---|---|
| H2O | 1 mM | 8.2014 mL | 41.0071 mL | 82.0143 mL | 205.0357 mL |
| 5 mM | 1.6403 mL | 8.2014 mL | 16.4029 mL | 41.0071 mL | |
| 10 mM | 0.8201 mL | 4.1007 mL | 8.2014 mL | 20.5036 mL | |
| 15 mM | 0.5468 mL | 2.7338 mL | 5.4676 mL | 13.6690 mL | |
| 20 mM | 0.4101 mL | 2.0504 mL | 4.1007 mL | 10.2518 mL | |
| 25 mM | 0.3281 mL | 1.6403 mL | 3.2806 mL | 8.2014 mL | |
| 30 mM | 0.2734 mL | 1.3669 mL | 2.7338 mL | 6.8345 mL | |
| 40 mM | 0.2050 mL | 1.0252 mL | 2.0504 mL | 5.1259 mL | |
| 50 mM | 0.1640 mL | 0.8201 mL | 1.6403 mL | 4.1007 mL | |
| 60 mM | 0.1367 mL | 0.6835 mL | 1.3669 mL | 3.4173 mL | |
| 80 mM | 0.1025 mL | 0.5126 mL | 1.0252 mL | 2.5629 mL |
* Note: If you choose water as the stock solution, please dilute it to the working solution, then filter and sterilize it with a 0.22 μm filter before use.


Sodium metavanadate, 99% Related Classifications
HY-D0852A Related Classifications
 Powered by Bioz
Keywords
- Sodium metavanadate, 99%
- 13718-26-8
- Sodium vanadate(V), 99%
- Phosphatase
- Parasite
- Reactive Oxygen Species (ROS)
- Apoptosis
- Plasmodium yoelii yoelii
- 4T1 murine breast cancer cells
- Saccharomyces cerevisiae
- Na+/K+ pumps
- breast cancer cells
- BB-DP rats
- Pseudomonas
- Neurospora crassa
- Wistar rats
- glyceraldehyde-3-phosphate dehydrogenase
- Inhibitor
- inhibitor
- inhibit