



MD13

Based on 1 Customer Validation
MD13 is a MIF PROTAC degrader with a DC50 of approximately 100 nM. MD13 induces ubiquitination and degradation of MIF by recruiting the Cereblon Cullin RING E3 ubiquitin ligase complex. MD13 inactivates the MAPK pathway and induces G2/M phase cell cycle arrest. MD13 exhibits antiproliferative effects in 3D tumor spheroid models. MD13 can be used in lung cancer-related research.
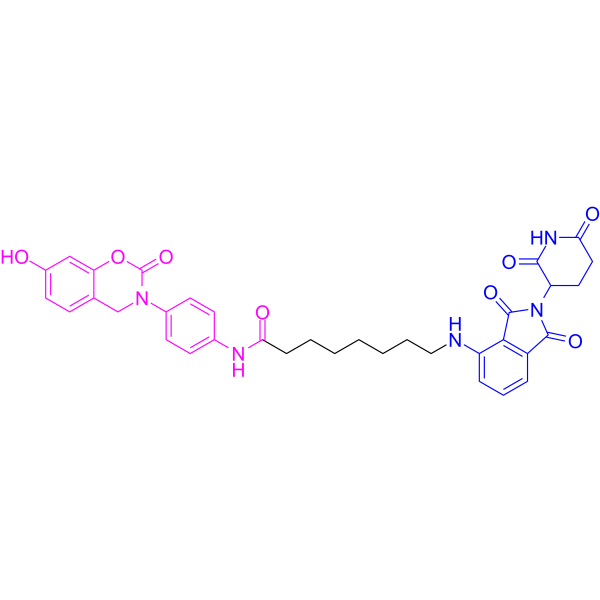
(Pink: Macrophage migration inhibitory factor (MIF) Target protein ligand; Blue: Cereblon ligand (HY-10984); Black: linker).
Nos produits utilisent uniquement pour la recherche. Nous ne vendons pas aux patients.
- Pureté : 99.96%
- CAS No.: 2758431-97-7
- Formule: C35H35N5O8
- Masse moléculaire:653.68
-
Stockage:Powder -20°C, 3 years , 4°C, 2 years ; In solvent -80°C, 6 months , -20°C, 1 month

To place orders, for customer services and technical support, please contact: MedChemExpress USA
Tel: 609-228-6898 E-mail: [email protected] [email protected]


-
 Activité biologique
-
Chemical Information
-
Solvant et solubilité
- Protocole
- Pureté et documentation
- Références
-
 Help & FAQs


Voir tous les produits spécifiques à Isoform PROTACs
More

Activité biologique
Description
IC50 & Target
[1]|
Cereblon |
In Vitro
MedChemExpress (MCE) has not independently confirmed the accuracy of these methods. They are for reference only.
-
Cell Line:A549 human lung adenocarcinoma cells
-
Concentration:0.01-20 μM (dose-response); 2 μM (time-course); 0.2-20 μM; 2 μM (with 2 μM Bortezomib co-treatment); 2 μM (with 50 μM MIF inhibitor 3 or 50 μM CRBN inhibitor 4 pretreatment)
-
Incubation Time:12 h (dose-response); 3-48 h (time-course); 12 h; co-treatment; 1 h pretreatment followed by MD13 treatment
-
Result:Induced dose-dependent MIF degradation, with a half-maximal degradation concentration (DC50) of ~100 nM (western blot) or ~200 nM (ELISA), and maximal degradation of 90-95% at concentrations >1 μM.
Showed a Hook effect at 20 μM.
Induced detectable degradation after 3 h of treatment with 2 μM MD13, reached >92% by 6 h, and showed only slight recovery after 48 h.
Had its MIF degradation effect rescued by co-treatment with Bortezomib, or pretreatment with MIF inhibitor 3 or CRBN inhibitor 4.
-
Cell Line:2D monolayer A549 human lung adenocarcinoma cells
-
Concentration:0.01-20 μM
-
Incubation Time:72 h
-
Result:Inhibited A549 cell proliferation in a dose-dependent manner, with the inhibitory effect visible at nanomolar concentrations and reaching ~50% inhibition at 20 μM.
Showed no significant inhibitory effect from inactive control compounds (MD15, MIF inhibitor 3, CRBN inhibitor 4) at concentrations up to 20 μM.
-
Cell Line:A549 human lung adenocarcinoma cells
-
Concentration:1-5 μM
-
Incubation Time:48 h
-
Result:Induced dose-dependent cell cycle arrest at the G2/M phase in A549 cells.
Increased the proportion of cells in G2/M phase from 12% (control) to 17%, 19%, and 23% with 1, 2, and 5 μM MD13 respectively.
Showed little to no effect on cell cycle distribution from inactive control compound MD15 at 5 μM.
-
Cell Line:A549 human lung adenocarcinoma cells
-
Concentration:2 μM
-
Incubation Time:6-48 h
-
Result:Inhibited ERK phosphorylation in A549 cells by ~50% after 24 h of treatment with 2 μM MD13, with the inhibition persisting at 48 h.
Showed no significant effect on pERK levels from inactive control compounds (MD15, MIF inhibitor 3, CRBN inhibitor 4).
- Multiplex immunofluorescence IHC
- Flow cytometric DNA-content cell-cycle staining
- BrdU Incorporation Assay
- Multiplex immunohistochemistry
- Suspension Spheroid Formation (Low-Adhesion/Forced Aggregation)
- Protocol for Cell Cycle
- Hanging Drop Spheroid Culture
- 3D Tumor Spheroid Invasion Assay
- Cell Viability Determination by MTT Colorimetric Assay


Chemical Information
-
CAS No. 2758431-97-7
-
Appearance Solid
-
Masse moléculaire 653.68
-
Formule C35H35N5O8
-
Color Light yellow to yellow
-
SMILES
O=C(NC1=CC=C(N2C(OC3=CC(O)=CC=C3C2)=O)C=C1)CCCCCCCNC4=CC=CC(C(N5C(CC6)C(NC6=O)=O)=O)=C4C5=O
-
Livraison
Room temperature in continental US; may vary elsewhere.
-
Stockage
Powder -20°C 3 years 4°C 2 years In solvent -80°C 6 months -20°C 1 month


Solvant et solubilité
In Vitro:
DMSO : 100 mg/mL (152.98 mM; Need ultrasonic; Hygroscopic DMSO has a significant impact on the solubility of product, please use newly opened DMSO)
Please refer to the solubility information to select the appropriate solvent. Once prepared, please aliquot and store the solution to prevent product inactivation from repeated freeze-thaw cycles.
Storage method and period of stock solution: -80°C, 6 months; -20°C, 1 month. When stored at -80°C, please use it within 6 months. When stored at -20°C, please use it within 1 month.
Please refer to the solubility information to select the appropriate solvent. Once prepared, please aliquot and store the solution to prevent product inactivation from repeated freeze-thaw cycles.
Storage method and period of stock solution: -80°C, 6 months; -20°C, 1 month. When stored at -80°C, please use it within 6 months. When stored at -20°C, please use it within 1 month.
Concentration (start) × Volume (start) = Concentration (final) × Volume (final)


Pureté et documentation
-
Fiche technique (274 KB)
-
SDS (254 KB)
- English - EN (254 KB)
- Français - FR (254 KB)
- Deutsch - DE (254 KB)
- Norwegian - NO (254 KB)
- Español - ES (254 KB)
- Swedish - SV (254 KB)
- Italian - IT (254 KB)
- Korean - KR (254 KB)
- Portuguese - PT (254 KB)
-
Instruction de manipulation (2659 KB)
Références


Complete Stock Solution Preparation Table
Please refer to the solubility information to select the appropriate solvent. Once prepared, please aliquot and store the solution to prevent product inactivation from repeated freeze-thaw cycles.
Storage method and period of stock solution: -80°C, 6 months; -20°C, 1 month. When stored at -80°C, please use it within 6 months. When stored at -20°C, please use it within 1 month.
| Optional Solvent | Concentration Solvent Mass | 1 mg | 5 mg | 10 mg | 25 mg |
|---|---|---|---|---|---|
| DMSO | 1 mM | 1.5298 mL | 7.6490 mL | 15.2980 mL | 38.2450 mL |
| 5 mM | 0.3060 mL | 1.5298 mL | 3.0596 mL | 7.6490 mL | |
| 10 mM | 0.1530 mL | 0.7649 mL | 1.5298 mL | 3.8245 mL | |
| 15 mM | 0.1020 mL | 0.5099 mL | 1.0199 mL | 2.5497 mL | |
| 20 mM | 0.0765 mL | 0.3825 mL | 0.7649 mL | 1.9123 mL | |
| 25 mM | 0.0612 mL | 0.3060 mL | 0.6119 mL | 1.5298 mL | |
| 30 mM | 0.0510 mL | 0.2550 mL | 0.5099 mL | 1.2748 mL | |
| 40 mM | 0.0382 mL | 0.1912 mL | 0.3825 mL | 0.9561 mL | |
| 50 mM | 0.0306 mL | 0.1530 mL | 0.3060 mL | 0.7649 mL | |
| 60 mM | 0.0255 mL | 0.1275 mL | 0.2550 mL | 0.6374 mL | |
| 80 mM | 0.0191 mL | 0.0956 mL | 0.1912 mL | 0.4781 mL | |
| 100 mM | 0.0153 mL | 0.0765 mL | 0.1530 mL | 0.3825 mL |


MD13 Related Classifications
HY-148117 Related Classifications
 Powered by Bioz
Keywords
- MD13
- 2758431-97-7
- MD 13
- MD-13
- PROTACs
- Macrophage migration inhibitory factor (MIF)
- p38 MAPK
- cereblon Cullin RING E3 ubiquitin ligase complex
- MAPK pathway
- MIF
- Macrophage Migration Inhibitory Factor
- 3D tumor spheroid models
- HEK293 cells
- A549 cells
- G2/M cell cycle arrest
- ERK phosphorylation
- lung cancer
- Inhibitor
- inhibitor
- inhibit