



PPM-3

Based on 1 Customer Validation
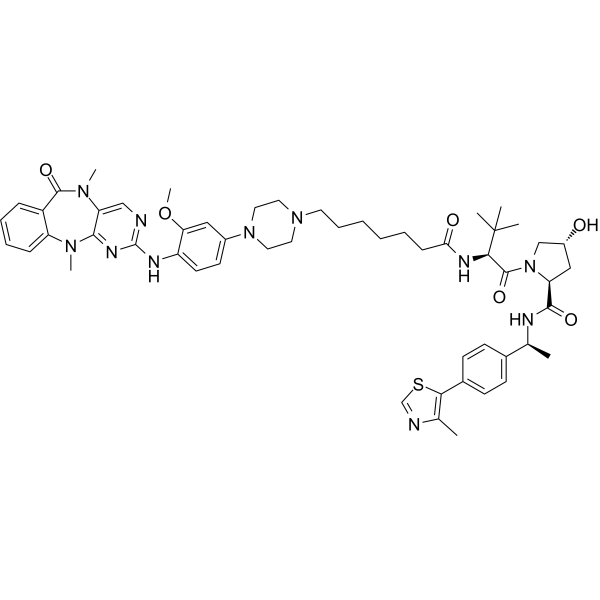
PPM-3 is a highly selective ERK5 PROTAC degrader that mediates the degradation of ERK5 protein by recruiting VHL. PPM-3 inhibits ERK5 kinase activity with an IC50 of 62.4 nM. PPM-3-mediated ERK5 degradation exhibits a hook effect. PPM-3 exerts no significant direct inhibitory effect on the proliferation and migration of cancer cells. PPM-3 can be used in studies related to macrophage polarization and tumor immunity.
(Pink: ERK5 ligand (HY-184975); Blue: VHL ligand (HY-112078); Black: linker).
Nur für Forschungszwecke. Wir verkaufen nicht an Patienten.
- Reinheit : 98.2%
- CAS. Nr.: 3032388-42-1
- Formel: C54H69N11O6S
- Molecular Weight:1000.26
-
Speicherung:Powder -20°C, 3 years ; In solvent -80°C, 6 months , -20°C, 1 month

To place orders, for customer services and technical support, please contact: MedChemExpress USA
Tel: 609-228-6898 E-mail: [email protected] [email protected]


-
 Biologische Aktivität
-
Chemical Information
- Protokoll
- Reinheit & Dokumentation
- Verweise
-
 Help & FAQs


Alle PROTACs Isoform-spezifische Produkte anzeigen
More

Biologische Aktivität
Beschreibung
IC50 & Target
[1]|
ERK5 62.4 nM (IC50) |
In Vitro
When tested in a cell-free system, PPM-3 (0.5 μM) exhibits excellent kinase selectivity for ERK5 compared with more than 300 other kinases[1].
PPM-3 effectively reduces ERK5 protein levels in an initial degradation activity comparison assay in A375 cells, with a DC50 of approximately 17 nM, and exhibits the highest ERK5 degradation activity among PPM-3, PPM-4 and PPM-5[1].
PPM-3 (6-500 nM; 12 h) selectively degrades ERK5 but does not degrade LRRK2, BRD4 or DCLK1 in A375 melanoma cells[1].
PPM-3 (200 nM; 12 h) induces ERK5 degradation in A375 cells. Pre-incubation with MG132 (HY-13259) (1 μM) or MLN4924 (HY-70062) (1 μM) for 1 h blocks the downregulation of ERK5, supporting that PPM-3-mediated ERK5 degradation depends on the proteasome/E3 ubiquitination-related pathway[1].
PPM-3 (72 h) does not reduce the cell viability of H1975, HepG2, MDA-MB-231, PC-3, HCT116, or A375 cancer cells[1].
PPM-3 (0.01-1 μM; 24 h) does not affect the migration of A375 or HCT116 cancer cells[1].
PPM-3 (10-1000 nM; 24 h) does not reduce ERK5 mRNA levels in A375 cells, indicating that the decrease in ERK5 protein is not caused by the downregulation of ERK5 transcription[1].
PPM-3 (6-500 nM; 12 h) selectively degrades ERK5 in A375 cells, with no significant effect on the protein levels of LRRK2, BRD4, and DCLK1[1].
PPM-3 (200 nM) begins to induce ERK5 degradation in A375 cells within 2-4 h, reaches its maximum degradation effect at 12 h, and this effect is maintained for at least 72 h[1].
PPM-3 (12 h) effectively degrades ERK5 in H1975, HepG2, MDA-MB-231, PC-3, HCT116, and A375 cells, with DC50 values of 11.5, 13.7, 22.7, 23.5, 5.6, and 41.4 nM, and DCmax values of 94.7%, 92.7%, 86.7%, 89.4%, 88.9%, and 91.4%, respectively[1].
PPM-3 (72 h) exhibits no significant direct antiproliferative effect within the concentration range that effectively degrades ERK5 in H1975, HepG2, MDA-MB-231, PC-3, HCT116, and A375 cells[1].
Combined exposure to PPM-3 (200 nM; 72 h) with Dabrafenib (HY-14660), Vemurafenib (HY-12057), Trametinib (HY-10999), Mirdametinib (HY-10254), or GDC-0994 (HY-15947) does not significantly alter the effects of these RAF, MEK1/2, or ERK1/2 inhibitors on the viability of A375/HCT116 cells[1].
PPM-3 (0.5 μM) exerts no significant effect on the colony formation of A375/HCT116 cells grown directly under normal culture conditions. However, conditioned medium from M0 or M2 macrophages treated with PPM-3 reduces tumor cell colony formation and attenuates the promoting effect of M2-conditioned medium on the colony growth of A375 and HCT116 cells[1].
MedChemExpress (MCE) has not independently confirmed the accuracy of these methods. They are for reference only.
-
Cell Line:A375 melanoma cells
-
Concentration:PPM-3: 200 nM; MG132: 1 μM; MLN4924: 1 μM
-
Incubation Time:MG132/MLN4924 preincubation: 1 h; PPM-3: 12 h
-
Result:Induced ERK5 protein degradation.
MG132 preincubation prevented ERK5 downregulation.
MLN4924 preincubation prevented ERK5 downregulation.
-
Cell Line:A375 melanoma cells
-
Concentration:10, 100, 1000 nM
-
Incubation Time:12 h
-
Result:Did not reduce ERK5 mRNA levels.
-
Cell Line:A375, HCT116
-
Concentration:0.01, 0.1, 1 μM
-
Incubation Time:24 h
-
Result:Did not evidently alter tumor-cell migration.
-
Cell Line:A375 and HCT116 cancer cells
-
Concentration:200 nM
-
Incubation Time:72 h
-
Result:Did not evidently alter the cell-viability effects of the tested RAF, MEK1/2, or ERK1/2 inhibitors.
-
Cell Line:A375
-
Concentration:6-500 nM
-
Incubation Time:12 h
-
Result:Selectively reduced ERK5 protein levels.
Did not evidently alter LRRK2 protein levels.
Did not evidently alter BRD4 protein levels.
Did not evidently alter DCLK1 protein levels.
-
Cell Line:A375
-
Concentration:0.04-30 μM
-
Incubation Time:12 h
-
Result:Increased ERK5 degradation as concentration increased up to approximately 1.1 μM.
Showed declining degradation activity at concentrations above approximately 1.1 μM, demonstrating a hook effect.
-
Cell Line:THP-1
-
Concentration:PPM-3: 0.5 μM; LPS: 1 μg/mL
-
Incubation Time:PPM-3 preincubation: 0.5 h; LPS: 24 h
-
Result:Reduced ERK5 protein levels in the presence of LPS.


Chemical Information
-
CAS. Nr. 3032388-42-1
-
Appearance Solid
-
Molecular Weight 1000.26
-
Formel C54H69N11O6S
-
Color White to off-white
-
SMILES
O=C(C1=CC=CC=C1N(C)C2=NC(NC3=CC=C(C=C3OC)N4CCN(CC4)CCCCCCC(N[C@@H](C(C)(C)C)C(N5C[C@@H](C[C@H]5C(N[C@H](C6=CC=C(C=C6)C7=C(N=CS7)C)C)=O)O)=O)=O)=NC=C28)N8C
-
Versand
Room temperature in continental US; may vary elsewhere.
-
Speicherung
Powder -20°C 3 years In solvent -80°C 6 months -20°C 1 month


Reinheit & Dokumentation
-
Data Sheet (285 KB)
-
SDS (252 KB)
- English - EN (252 KB)
- Français - FR (252 KB)
- Deutsch - DE (252 KB)
- Norwegian - NO (252 KB)
- Español - ES (252 KB)
- Swedish - SV (252 KB)
- Italian - IT (252 KB)
- Korean - KR (252 KB)
- Portuguese - PT (252 KB)
-
Handling Instructions (2659 KB)
Verweise

Calculators
Konzentration (Stammlösung) × Volumen (Stammlösung) = Konzentration (Ziellösung) × Volumen (Ziellösung)


PPM-3 Related Classifications
HY-149616 Related Classifications
 Powered by Bioz