



PROTAC α-synuclein degrader 5

Based on 1 Customer Validation
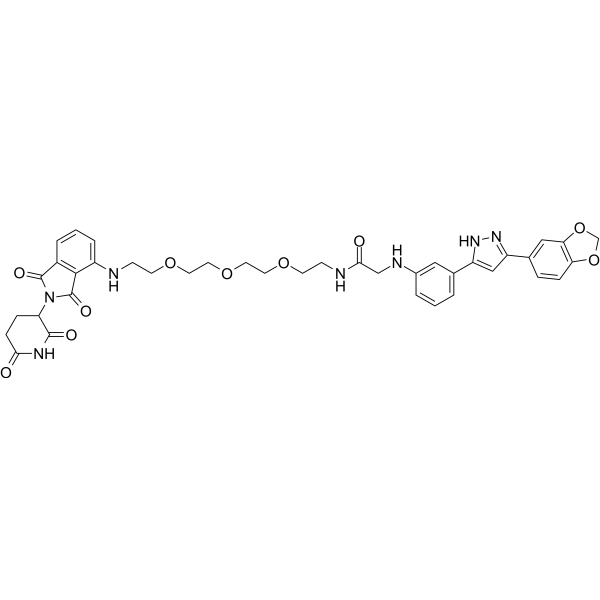
PROTAC α-synuclein degrader 5 is a selective PROTAC degrader targeting α‑synuclein aggregates, with a DC50 of 7.51 μM. PROTAC α-synuclein degrader 5 binds to αSyn aggregates, recruits the CRBN E3 ubiquitin ligase, and mediates the ubiquitination and subsequent degradation of α‑synuclein aggregates. PROTAC α-synuclein degrader 5 activates the autophagy-lysosome pathway. PROTAC α-synuclein degrader 5 reduces ROS levels in neuroblastoma cells, restores mitochondrial membrane potential, rescues cell viability, and decreases LDH release. PROTAC α-synuclein degrader 5 degrades αSyn aggregates in Caenorhabditis elegans and ameliorates oxidative stress. PROTAC α-synuclein degrader 5 is used for the research of synucleinopathies, such as Parkinson's disease.
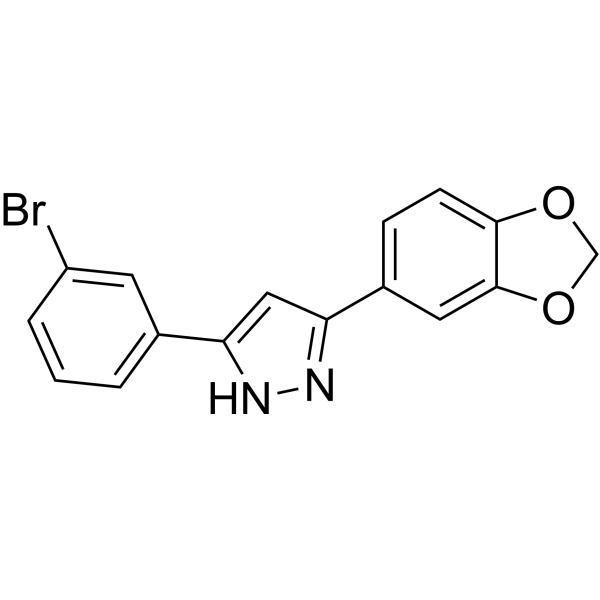
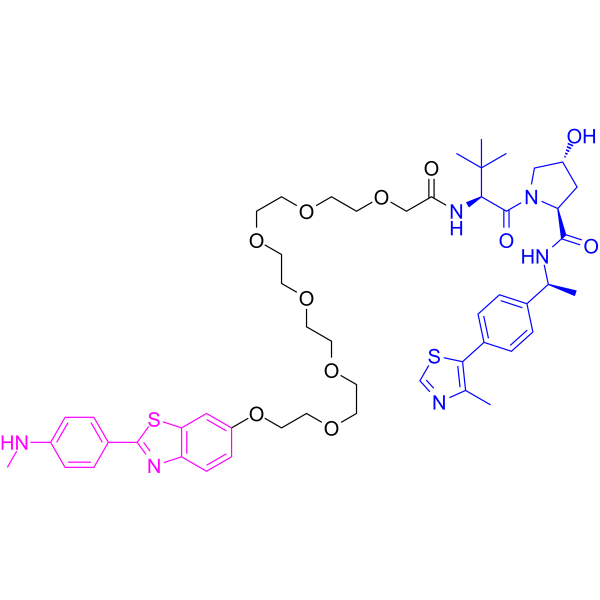
(Pink: α-synuclein ligand (HY-187000); Blue: VHL ligand (HY-10984); Black: linker).
For research use only. We do not sell to patients.
- Purity : 99.80%
- CAS No.: 2781922-42-5
- Formula: C39H41N7O10
- Molecular Weight:767.78
-
Storage:
-20°C, sealed storage, away from moisture and light
* In solvent : -80°C, 6 months; -20°C, 1 month (sealed storage, away from moisture and light)

To place orders, for customer services and technical support, please contact: MedChemExpress USA
Tel: 609-228-6898 E-mail: [email protected] [email protected]


-
 Biological Activity
-
Chemical Information
-
Solvent & Solubility
- Protocols
- Purity & Documentation
- References
-
 Help & FAQs




Biological Activity
Description
IC50 & Target
[1]|
α-synuclein Aggregation 7.51 μM (DC50) |
Cellular Effect
|
Cell Line

|
Type | Value | Description | References |
|---|---|---|---|---|
| HEK-293T | DC50 |
7.51 μM
|
Degradation of αSyn aggregates in pre-formed fibril-seeding Snca OE HEK293T human embryonic kidney cells assessed by immunoblot assay after 48 h incubation.
Degradation of αSyn aggregates in pre-formed fibril-seeding Snca OE HEK293T human embryonic kidney cells assessed by immunoblot assay after 48 h incubation.
|
37267712 |
| HEK-293T | DC50 |
3.32 μM
|
Degradation of conformation-specific αSyn aggregates in pre-formed fibril-seeding Snca OE HEK293T human embryonic kidney cells assessed by conformation-specific native dot blot assay after 48 h incubation.
Degradation of conformation-specific αSyn aggregates in pre-formed fibril-seeding Snca OE HEK293T human embryonic kidney cells assessed by conformation-specific native dot blot assay after 48 h incubation.
|
37267712 |
In Vitro
PROTAC α-synuclein degrader 5 (Compound 2b) (0.625‑20 μM; 0-48 h) degrades α-synuclein aggregates in the Snca OE-PFF seeding model HEK293T cells, with a DC50 of 7.51 μM and a Dmax of 89%. It exhibits high selectivity for aggregated α-synuclein and does not affect the level of α-synuclein monomers[1].
PROTAC α-synuclein degrader 5 (1 μM) exhibits a binding dissociation constant KD of 1.161 μM toward α-synuclein preformed fibrils (PFF) as determined by fluorescence polarization assay[1].
PROTAC α-synuclein degrader 5 (10 μM; 12 h) is confirmed via co-immunoprecipitation (co-IP) assay to increase the ubiquitination level of α-synuclein aggregates in HEK293T cells of the Snca OE-PFF seeding model[1].
PROTAC α-synuclein degrader 5 (10 μM; 48 h) achieves the degradation of α-synuclein aggregates in the Snca OE-PFF seeding model HEK293T cells via the combined action of the ubiquitin-proteasome system (UPS) and the autophagy-lysosome pathway (ALP); after treatment with MG132 (HY-13259), BafA1 (HY-100558) or LC3B knockdown, the degradation efficiency decreases significantly[1].
PROTAC α-synuclein degrader 5 (10 μM; 6 h) activates autophagic flux and promotes lysosome biogenesis in the Snca OE-PFF seeding model of HEK293T cells[1].
PROTAC α-synuclein degrader 5 (10 μM; 24 h) reduces the level of reactive oxygen species (ROS) in PFF-treated SH-SY5Y cells, restores mitochondrial membrane potential, and alleviates aggregate-induced cellular damage[1].
MedChemExpress (MCE) has not independently confirmed the accuracy of these methods. They are for reference only. Further protocols information, click here.
-
Cell Line:Snca OE-PFF seeding HEK293T cells
-
Concentration:0.625, 1.25, 2.5, 5, 10, 20, 40 μM (48 h)
10 μM (0-48 h) -
Incubation Time:48 h
0, 3, 6, 12, 24, 48 h -
Result:Degraded α-synuclein aggregates in the Snca OE-PFF seeding model HEK293T cells, with a DC50 of 7.51 μM and a Dmax of 89%. It exhibits high selectivity for aggregated α-synuclein and does not affect the level of α-synuclein monomers.
-
Cell Line:Snca OE-PFF seeding HEK293T cells
-
Concentration:10 μM
-
Incubation Time:48 h
-
Result:Achieved the degradation of α-synuclein aggregates in the Snca OE-PFF seeding model HEK293T cells via the combined action of the ubiquitin-proteasome system (UPS) and the autophagy-lysosome pathway (ALP); after treatment with MG132 (HY-13259), BafA1 (HY-100558) or LC3B knockdown, the degradation efficiency decreased significantly.
In Vivo
MedChemExpress (MCE) has not independently confirmed the accuracy of these methods. They are for reference only.
-
Animal Model:NL5901 (pkls2386 [unc-54p::αSyn::YFP])[1]
-
Dosage:20 μM; 40 μM; 80 μM
-
Administration:incubated in liquid NGM culture medium; 48 hours
-
Result:Degraded αSyn aggregates in a dose-dependent manner.
Reduced the total number of αSyn-YFP fluorescent punctae with increasing concentrations.
Reduced the mean fluorescence intensity (MFI) of αSyn-YFP with increasing concentrations.


Chemical Information
-
CAS No. 2781922-42-5
-
Appearance Solid
-
Molecular Weight 767.78
-
Formula C39H41N7O10
-
Color Light yellow to yellow
-
SMILES
O=C(NCCOCCOCCOCCNC1=CC=CC(C(N2C3C(NC(CC3)=O)=O)=O)=C1C2=O)CNC4=CC(C5=CC(C6=CC7=C(C=C6)OCO7)=NN5)=CC=C4
-
Shipping
Room temperature in continental US; may vary elsewhere.
-
Storage
-20°C, sealed storage, away from moisture and light
* In solvent : -80°C, 6 months; -20°C, 1 month (sealed storage, away from moisture and light)


Solvent & Solubility
In Vitro:
DMSO : ≥ 100 mg/mL (130.25 mM; Hygroscopic DMSO has a significant impact on the solubility of product, please use newly opened DMSO)
* "≥" means soluble, but saturation unknown.
Please refer to the solubility information to select the appropriate solvent. Once prepared, please aliquot and store the solution to prevent product inactivation from repeated freeze-thaw cycles.
Storage method and period of stock solution: -80°C, 6 months; -20°C, 1 month (sealed storage, away from moisture and light). When stored at -80°C, please use it within 6 months. When stored at -20°C, please use it within 1 month.
Please refer to the solubility information to select the appropriate solvent. Once prepared, please aliquot and store the solution to prevent product inactivation from repeated freeze-thaw cycles.
Storage method and period of stock solution: -80°C, 6 months; -20°C, 1 month (sealed storage, away from moisture and light). When stored at -80°C, please use it within 6 months. When stored at -20°C, please use it within 1 month.
Concentration (start) × Volume (start) = Concentration (final) × Volume (final)
In Vivo:
Select the appropriate dissolution method based on your experimental animal and administration route.
- For the following dissolution methods, please ensure to first prepare a clear stock solution using an In Vitro approach and then sequentially add co-solvents:
- To ensure reliable experimental results, the clarified stock solution can be appropriately stored based on storage conditions. As for the working solution for In Vivo experiments, it is recommended to prepare freshly and use it on the same day.
- The percentages shown for the solvents indicate their volumetric ratio in the final prepared solution. If precipitation or phase separation occurs during preparation, heat and/or sonication can be used to aid dissolution.
Add each solvent one by one: 10% DMSO 40% PEG300 5% Tween-80 45% Saline
Solubility: ≥ 3.75 mg/mL (4.88 mM); Clear solution
This protocol yields a clear solution of ≥ 3.75 mg/mL (saturation unknown).
Taking 1 mL working solution as an example, add 100 μL DMSO stock solution (37.5 mg/mL) to 400 μL PEG300, and mix evenly; then add 50 μL Tween-80 and mix evenly; then add 450 μL Saline to adjust the volume to 1 mL.
Preparation of Saline: Dissolve 0.9 g sodium chloride in ddH₂O and dilute to 100 mL to obtain a clear Saline solution.
In Vivo Dissolution Calculator
Please enter the basic information of animal experiments:
-
-
-
-
Recommended: Prepare an additional quantity of animals to account for potential losses during experiments.
Please enter your animal formula composition:
-
%DMSO +
Recommended: Keep the proportion of DMSO in working solution below 2% if your animal is weak.
-
%+
-
+%Tween-80 + +
-
%Saline +
The co-solvents required include: DMSO, . All of co-solvents are available by MedChemExpress (MCE). , Tween 80. All of co-solvents are available by MedChemExpress (MCE).
Working solution concentration: 0.22 mg/mL
Method for preparing stock solution: mg drug dissolved in μL DMSO. Stock solution concentration: mg/mL. * In solvent : -80°C, 6 months; -20°C, 1 month (sealed storage, away from moisture and light)
1. Take μL DMSO stock solution;
2. Add μL .
μL , mix evenly;
3. Then add μL Tween 80, mix evenly;
4. Then add μL
Please ensure that the stock solution in the first step is dissolved to a clear state, and add co-solvents in sequence. You can use ultrasonic heating (ultrasonic cleaner, recommended frequency 20-40 kHz), vortexing, etc. to assist dissolution.

Protocols
-
Mitochondrial membrane-potential fluorescent assay
Mitochondrial membrane potential fluorescent assays estimate ΔΨm in living cells using lipophilic cationic dyes such as TMRM, TMRE, rhodamine 123, and JC-1, which accumulate in mitochondria according to membrane polarization; loss of signal after FCCP or CCCP treatment is interpreted as mitochondrial depolarization. TMRM/TMRE and rhodamine 123 are commonly used for semi-quantitative live-cell microscopy or flow cytometry, while JC-1 can report a shift from red aggregate fluorescence to green monomer fluorescence during depolarization; interpretation requires controls because dye concentration, quenching mode, cell type, dye efflux, and mitochondrial mass can affect fluorescence independently of ΔΨm.
-
Mammalian live/dead viability and cytotoxicity staining
Live/dead viability and cytotoxicity staining assays are based on the simultaneous detection of intracellular esterase activity in metabolically active (viable) cells and membrane integrity loss in non-viable cells. In commonly used dual-staining approaches, membrane-permeant fluorogenic substrates are converted by intracellular esterases into fluorescent products in live cells, while impermeant DNA-binding dyes selectively enter cells with compromised plasma membranes and label nucleic acids in dead or dying cells, enabling discrimination between viable and non-viable populations by fluorescence microscopy or flow cytometry.
-
ROS/oxidative-stress fluorescent staining
ROS/oxidative-stress fluorescent staining uses cell-permeant fluorogenic probes that become fluorescent after oxidation inside cells or tissues; commonly used examples include DCFH-DA/DCFDA for broad cellular oxidant detection, DHE for superoxide-related signal detection, MitoSOX for mitochondrial superoxide-related signal detection, and CellROX probes for oxidative-stress-associated fluorescence readouts. The assay detects probe oxidation rather than a single ROS species unless the probe and analysis method have been chemically validated for that species. DCFH-DA enters cells, is deacetylated by intracellular esterases to DCFH, and produces fluorescent DCF after oxidation, so the readout is used as an operational measure of total cellular oxidative stress rather than a species-specific ROS measurement. DHE and MitoSOX can report superoxide-related oxidation, but red fluorescence alone can include non-specific ethidium-like oxidation products; HPLC or optimized spectral approaches are
-
CCK-8/WST-8 Cell Proliferation Assay
The CCK-8/WST-8 assay is based on the reduction of the water-soluble tetrazolium salt WST-8 to a water-soluble formazan product by cellular dehydrogenases in metabolically active cells, where the generated formazan amount is proportional to the number of living cells and is quantified by measuring absorbance in the visible range, providing a colorimetric readout for cell viability and proliferation assessment. This class of tetrazolium-based assays improves upon earlier MTT-based systems by producing a water-soluble formazan, eliminating the need for organic solubilization steps and enabling direct spectrophotometric measurement in culture medium.
-
Cell Viability Determination by MTT Colorimetric Assay
The following protocol uses the MTT colorimetric assay as a classic literature-established method for assessing cell viability/metabolic activity in cultured mammalian cells. MTT[3-(4,5-dimethylthiazol-2-yl)-2,5-diphenyltetrazolium bromide] is reduced by metabolically active cells to a colored formazan product; the amount of formazan is quantified spectrophotometrically and provides an indirect measure of metabolically active viable cells. Importantly, MTT reduction reflects cellular oxidoreductase/metabolic activity rather than an absolute direct count of living cells, so changes in cellular metabolism can alter the signal independently of cell number.
-
Cell Cytotoxicity Assay
Cytotoxicity assays are usually based on the assessment of cell membrane damage, which can also be indirectly detected by measuring cell viability. Detection methods include MTT assay, CKK-8 assay, LDH assay and ATP assay, etc.
-
Human pluripotent stem cell midbrain dopaminergic neuron differentiation
Human pluripotent stem cells are directed toward midbrain dopaminergic neurons by first inducing a neural floor-plate-like progenitor state, then patterning cells with ventralizing SHH signaling and midbrain/WNT-FGF cues, and finally maturing progenitors into neurons expressing dopaminergic markers such as TH, NURR1/NR4A2, PITX3, DAT/SLC6A3, VMAT2/SLC18A2, GIRK2/KCNJ6, FOXA2, LMX1A, and EN1. The main readouts are loss of pluripotency, acquisition of FOXA2+/LMX1A+ midbrain floor-plate progenitors, emergence of βIII-tubulin+/MAP2+ neurons, and production of TH+ dopaminergic neurons with molecular, dopamine-release, and electrophysiological features of midbrain dopaminergic identity.
-
Fluorescent plasma-membrane potential dye assay
Fluorescent plasma-membrane potential dye assays measure changes in cell membrane potential using voltage-sensitive dyes whose fluorescence changes when cells depolarize or hyperpolarize. Anionic bis-oxonol dyes such as DiBAC4(3) enter depolarized cells more readily and show increased fluorescence after intracellular binding, while hyperpolarization reduces dye accumulation and fluorescence. FMP/FLIPR membrane-potential dyes are used for faster, homogeneous microplate assays of ion-channel or receptor-mediated membrane-potential changes.
-
Autophagy
Autophagy is a process in which eukaryotic cells use lysosomes to degrade their own cytoplasmic proteins and damaged organelles under the regulation of autophagy related gene (Atg). Microtubule-associated proteins light chain 3 (LC3) is recognized as autophagy marker, which transfers from cytoplasmic LC3 (LC3-I) to membrane type (LC3-II). LC3-II/I ratio could be detected by Western Blot and fluorescence microscopy.
-
Mitochondrial membrane-potential and mitochondrial mass staining
Mitochondrial membrane potential staining measures the electrochemical polarization across the mitochondrial inner membrane in live cells using lipophilic cationic fluorescent probes; early rhodamine-based work showed that selective mitochondrial dye accumulation is lost when the mitochondrial transmembrane potential is dissipated. JC-1 reports mitochondrial polarization by shifting from green monomer fluorescence to red J-aggregate fluorescence as dye concentration increases within energized mitochondria; therefore, the red/green fluorescence ratio is used as a relative readout of mitochondrial membrane potential. TMRE or TMRM staining provides a single-channel relative readout because these cationic rhodamine esters accumulate in polarized mitochondria, and lower fluorescence indicates reduced mitochondrial polarization when acquisition and dye-loading conditions are controlled. Mitochondrial mass staining is commonly performed with MitoTracker Green FM or related MitoTracker dyes as
-
Lysosome and acidic-vesicle live-cell staining
Lysosome and acidic-vesicle live-cell staining detects acidic intracellular compartments by using membrane-permeant acidotropic probes that accumulate in low-pH vesicles, including lysosomes, late endosomes, autolysosomes, and acidic phagosomes. LysoTracker staining is commonly used as an intensity-based readout of acidic lysosomal compartment abundance or enlargement, while acridine orange produces green fluorescence in less concentrated compartments and red fluorescence after concentration-dependent accumulation in acidic vesicular organelles. Loss or reduction of acridine-orange red signal can be used as a readout of lysosomal membrane permeabilization or reduced acidic-vesicle integrity. This protocol is designed for live cultured cells and can be adapted for fluorescence microscopy, high-content imaging, plate-reader readout, or flow cytometry when the selected literature supports the readout. Because these dyes report acidotropic accumulation rather than lysosome identity alone,
-
MTT Cell Proliferation Assay
The MTT assay is a colorimetric endpoint assay for estimating viable cell number, cell growth, cytotoxicity, or cell activation in cultured mammalian cells. Living cells reduce the yellow tetrazolium salt MTT into purple/blue formazan, while dead cells do not generate the same signal; the resulting color can be quantified with a multiwell spectrophotometer. MTT reduction is commonly interpreted as a readout of metabolic activity that often correlates with viable cell number, but it should not be treated as a direct cell-counting method unless the assay is optimized for the cell type and experimental condition. Studies show that MTT reduction can involve mitochondrial and non-mitochondrial reducing systems, and formazan may accumulate in intracellular lipid droplets rather than simply marking mitochondria.
-
Macroautophagy Solutions
Macroautophagy is a conserved lysosome-dependent degradation pathway in which cytoplasmic material is sequestered into double-membrane autophagosomes and delivered to lysosomes for degradation and recycling. The pathway supports cellular homeostasis during nutrient limitation, organelle stress, protein-aggregate accumulation, infection, differentiation, and tissue remodeling by coupling cargo sequestration, autophagosome maturation, lysosomal fusion, and degradation of cargo-derived macromolecules. The core molecular sequence includes initiation by nutrient- and stress-regulated autophagy machinery, autophagosome nucleation, LC3/ATG8-family conjugation to autophagosomal membranes, cargo selection through receptors such as SQSTM1/p62, autophagosome-lysosome fusion, and lysosomal degradation. LC3 was identified as a mammalian homolog of yeast Atg8 that localizes to autophagosomal membranes after processing, and p62/SQSTM1 was shown to connect ubiquitinated cargo with autophagic degradati


Purity & Documentation
-
Data Sheet (281 KB)
-
SDS (252 KB)
- English - EN (252 KB)
- Français - FR (252 KB)
- Deutsch - DE (252 KB)
- Norwegian - NO (252 KB)
- Español - ES (252 KB)
- Swedish - SV (252 KB)
- Italian - IT (252 KB)
- Korean - KR (252 KB)
- Portuguese - PT (252 KB)
-
Handling Instructions (2659 KB)
References


Complete Stock Solution Preparation Table
Please refer to the solubility information to select the appropriate solvent. Once prepared, please aliquot and store the solution to prevent product inactivation from repeated freeze-thaw cycles.
Storage method and period of stock solution: -80°C, 6 months; -20°C, 1 month (sealed storage, away from moisture and light). When stored at -80°C, please use it within 6 months. When stored at -20°C, please use it within 1 month.
| Optional Solvent | Concentration Solvent Mass | 1 mg | 5 mg | 10 mg | 25 mg |
|---|---|---|---|---|---|
| DMSO | 1 mM | 1.3025 mL | 6.5123 mL | 13.0246 mL | 32.5614 mL |
| 5 mM | 0.2605 mL | 1.3025 mL | 2.6049 mL | 6.5123 mL | |
| 10 mM | 0.1302 mL | 0.6512 mL | 1.3025 mL | 3.2561 mL | |
| 15 mM | 0.0868 mL | 0.4342 mL | 0.8683 mL | 2.1708 mL | |
| 20 mM | 0.0651 mL | 0.3256 mL | 0.6512 mL | 1.6281 mL | |
| 25 mM | 0.0521 mL | 0.2605 mL | 0.5210 mL | 1.3025 mL | |
| 30 mM | 0.0434 mL | 0.2171 mL | 0.4342 mL | 1.0854 mL | |
| 40 mM | 0.0326 mL | 0.1628 mL | 0.3256 mL | 0.8140 mL | |
| 50 mM | 0.0260 mL | 0.1302 mL | 0.2605 mL | 0.6512 mL | |
| 60 mM | 0.0217 mL | 0.1085 mL | 0.2171 mL | 0.5427 mL | |
| 80 mM | 0.0163 mL | 0.0814 mL | 0.1628 mL | 0.4070 mL | |
| 100 mM | 0.0130 mL | 0.0651 mL | 0.1302 mL | 0.3256 mL |


PROTAC α-synuclein degrader 5 Related Classifications
HY-155021 Related Classifications
 Powered by Bioz
Keywords
- PROTAC α-synuclein degrader 5
- 2781922-42-5
- PROTACs
- α-synuclein
- Reactive Oxygen Species (ROS)
- Autophagy
- autophagy-lysosome pathway
- E3 ligase CRBN
- ubiquitination
- C. elegans NL5901
- ROS
- Caenorhabditis elegans
- neuroblastoma cells
- α-synuclein aggregates
- synucleinopathies
- mitochondrial membrane potential
- Inhibitor
- inhibitor
- inhibit