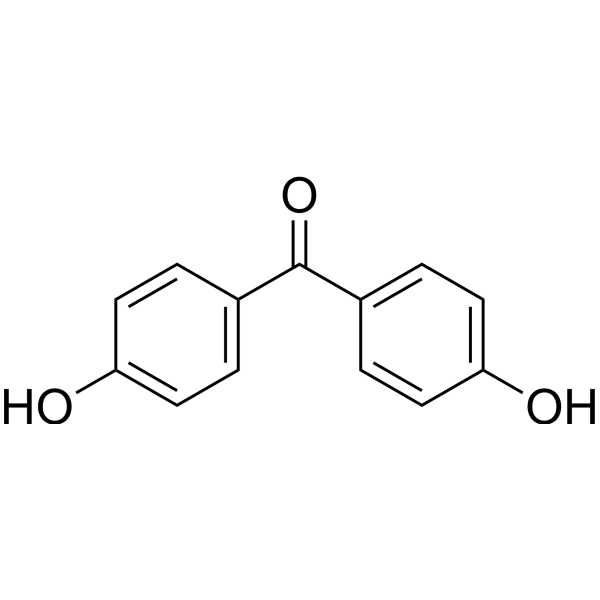
4-Hydroxybenzophenone
Based on 1 Customer Validation
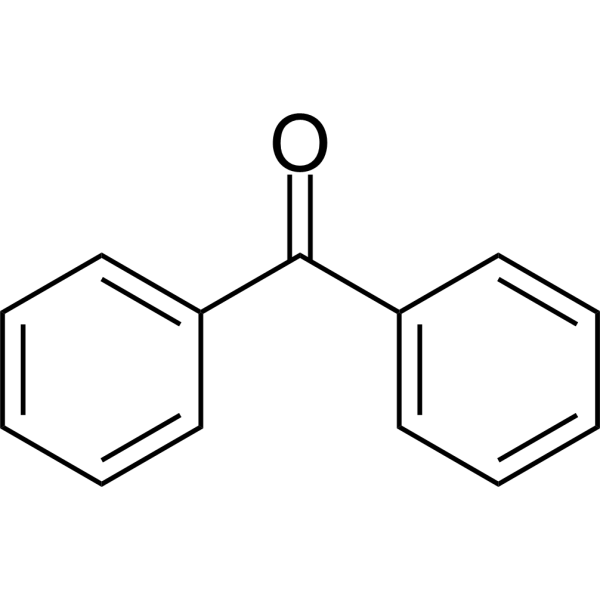
4‑Hydroxybenzophenone (4HBP) is a major metabolite of Benzophenone (HY-Y0546) and is orally active. 4-Hydroxybenzophenone triggers endoplasmic reticulum stress and activates the PERK-eIF2α-ATF4-CHOP and IRE1α-XBP1s pathways, and inhibits IκB translation. 4-Hydroxybenzophenone induces endoplasmic reticulum stress, unfolded protein response activation, protein homeostasis imbalance, protein aggregation, oxidative stress, ROS accumulation, mitochondrial membrane potential decrease, ATP depletion, and cytotoxicity. 4-Hydroxybenzophenone induces neural stem cell apoptosis (apoptosis) and affects neuronal differentiation. 4-Hydroxybenzophenone promotes malignant proliferation of hepatocellular carcinoma cells and xenograft tumor growth in nude mice. 4-Hydroxybenzophenone can be used in research related to neurodevelopmental toxicity and hepatocellular carcinoma.
For research use only. We do not sell to patients.
- Purity : 99.95%
- CAS No.: 1137-42-4
- Formula: C13H10O2
- Molecular Weight:198.22
-
Storage:
RT, stored under nitrogen.
In solvent -80°C, 1 year , -20°C, 6 months
Biological Activity
Description
IC50 & Target
[1]|
NF-κB |
IL-6 |
IL-1β |
TNF-α |
eIF2-α |
Cellular Effect
|
Cell Line
|
Type | Value | Description | References |
|---|---|---|---|---|
| HepG2 | IC50 |
41.3 μM
|
Decrease in mitochondrial membrane potential in human HepG2 hepatocellular carcinoma cells measured by m-MPI dye after 1 hr treatment in a 1,536-well plate format.
|
25302578 |
In Vitro
4-Hydroxybenzophenone (4HBP) (1 μM; 7 days) primarily affects NSC proliferation and induces ER stress and apoptosis in mouse NSCs; it triggers inflammatory responses and activates the NFκB signaling pathway in hippocampal NSCs[1].
4-Hydroxybenzophenone (1 μM) induces morphological changes in the endoplasmic reticulum of hippocampal NSCs[1].
4-Hydroxybenzophenone (4HBP) (5 nM; 48 h) increases cell viability in HepG2 hepatocellular carcinoma cells, but not in normal LO2 hepatocytes[2].
4-Hydroxybenzophenone (5 nM; 1-2 weeks) promotes colony formation in HepG2 hepatocellular carcinoma cells but not in normal LO2 hepatocytes[2].
4-Hydroxybenzophenone (5 nM; beyond 30 passages) accelerates the proliferative capacity of HepG2 hepatocellular carcinoma cells but does not affect normal LO2 hepatocytes; at P30, it upregulates BIP and selectively activates the IRE1α-XBP1s signaling axis in HepG2 cells, induces XBP1s nuclear translocation, and increases protein aggregation[2].
4-Hydroxybenzophenone exposure (5 nM; more than 30 passages) induces PERK reporter oligomerization and aggregate formation in HepG2 cells at P30[2].
The 4-Hydroxybenzophenone-induced increase in cell viability, enhanced proliferation, and elevated colony formation ability in HepG2 cells are reversed by XBP1 knockdown or inhibition of the IRE1α-XBP1s pathway with MKC8866 (HY-104040)[2].
4-Hydroxybenzophenone (4OH-BP) exhibits strong binding affinity with ESR1 and ESR2 in molecular docking simulations[3].
4-Hydroxybenzophenone (1-1000 nM; 7 days) inhibits the proliferation of primary mouse hippocampal NSCs in vitro and reduces the viability of primary mouse hippocampal NSCs in vitro[4].
4-Hydroxybenzophenone (1 μM; 7 days) treatment significantly upregulates the expression of Cxcl1 and other genes in primary mouse NSCs, with Cxcl1 being the most significantly upregulated gene[4].
4-Hydroxybenzophenone induces endoplasmic reticulum stress and activates the PERK signaling pathway in hippocampal neural stem cells. PERK inhibition reverses the 4-Hydroxybenzophenone-induced decrease in IκBα levels in hippocampal neural stem cells and rescues hippocampal neural stem cell apoptosis[1].
4-Hydroxybenzophenone induces ATF4-dependent p65 transcriptional regulation; ATF4 or CHOP knockdown rescues 4-Hydroxybenzophenone-triggered hippocampal neural stem cell apoptosis; it eliminates nuclear p65 aggregation and reverses apoptosis[1].
4-Hydroxybenzophenone (1 μM; 7 days) strongly induces Cxcl1 mRNA and protein expression in primary mouse NSCs; moreover, Cxcl1 knockdown attenuates the 4HBP-induced inhibition of proliferation and increase in apoptosis, and rescues the decrease in cell viability in primary mouse NSCs[4].
4-Hydroxybenzophenone is a hydroxybenzophenone isomer that reduces mitochondrial membrane potential (MMP) with an IC50 of 41.3 μM[5].
MedChemExpress (MCE) has not independently confirmed the accuracy of these methods. They are for reference only. Further protocols information, click here.
-
Cell Line:Primary hippocampal neural stem cells (NSCs)
-
Concentration:1 μM
-
Incubation Time:7 days
-
Result:Dose-dependently inhibited viability of primary NSCs.
Neither the parental BP nor BP-3 caused significant toxicity at the same concentration.
-
Cell Line:Hippocampal neural stem cells (NSCs)
-
Concentration:0, 0.01, 0.1, 1 μM
-
Incubation Time:7 days
-
Result:Phosphorylated and total level of p65 robustly increased.
Reduction in IκBα level.
Elevated level of p65 mRNA.
-
Cell Line:Hippocampal neural stem cells (NSCs)
-
Concentration:1 μM
-
Incubation Time:7 days
-
Result:ATF4 knockdown almost completely eliminated nuclear p65 in the 4HBP-treated NSCs.
Increased proliferation and decreased apoptosis, as reflected by Ki67 and cleaved-caspase 3 staining.
-
Cell Line:HepG2 and LO2
-
Concentration:5 nM
-
Incubation Time:48 h
-
Result:Increased cell viability significantly in HepG2 cells at passage 10 and passage 30.
Failed to induce significant alterations in cell viability in normal LO2 cells.
-
Cell Line:HepG2
-
Concentration:10 μM
-
Incubation Time:48 h
-
Result:Almost completely inhibited the 4-Hydroxybenzophenone-induced increase in cell viability.
Showed a more significant decrease in viability compared with the control group.
-
Cell Line:Primary mouse neural stem cells (NSCs)
-
Concentration:1 μM
-
Incubation Time:7 days
-
Result:Identified top upregulated genes induced by 4HBP exposure, with chemokine Cxcl1 ranked first.
Confirmed that expression of Cxcl1, Adm2, Cntnap3, P2rx3, and Atp2a3 were generally increased.\nConfirmed elevated mRNA expression of Cxcl1 upon 4HBP exposure.
-
Cell Line:Primary mouse neural stem cells (NSCs)
-
Concentration:1 μM
-
Incubation Time:7 days
-
Result:Showed significantly stronger signal of Cxcl1 staining in Nestin-labeled NSCs treated with 4HBP compared to untreated cells.
Resulted in marked reduction of Cxcl1 staining with siRNA-mediated transient knockdown of Cxcl1.\nShowed significantly less Ki67+ cells and more cleaved-caspase 3+ cells in 4HBP-treated group.
Cxcl1 knockdown strongly reversed the number of Ki67+ and cleaved-caspase 3+ cells.
-
Cell Line:Primary mouse neural stem cells (NSCs)
-
Concentration:1 μM
-
Incubation Time:7 days
-
Result:Cxcl1 knockdown rescued the decline in cell viability caused by 4HBP treatment.
In Vivo
4-Hydroxybenzophenone (4HBP) (5 nM; subcutaneous injection; 0-12 days) specifically promotes the malignant progression of HCC cells and enhances their tumorigenic potential in vivo[2].
MedChemExpress (MCE) has not independently confirmed the accuracy of these methods. They are for reference only.
-
Animal Model:C57BL/6 mice (pregnant dams and their offspring; male 25-30 g, female 20-25 g)[1]
-
Dosage:0.1, 1 mg/kg/day
-
Administration:p.o.; throughout the entire 21-day pregnancy
-
Result:Reduced offspring swimming time in target quadrant and platform-crossing numbers in the 1 mg/kg/day 4HBP group, decreased spontaneous exploration, and increased dark-cage residence time and entry frequency.
Decreased hippocampal volume at P1 with persistent morphological changes at P56, lowered Ki67+/Nestin+ NSC count and raised TUNEL signals at 1 mg/kg/day.
Altered GFAP and Tuj1 expression, reduced NeuN+ cell number, and elevated cleaved-caspase 3 and Bax levels in offspring hippocampus.
Increased PERK pathway component expression at P1 with sustained mild activation at P56, upregulated TNFα, IL-1β and IL-6, elevated total and phosphorylated p65 and reduced IκBα in hippocampal tissues.
-
Animal Model:C57BL/6 mice (pregnant dams and their offspring; male 25-30 g, female 20-25 g)[1]
-
Dosage:1 mg/kg/day (4HBP)
50 mg/kg/day (GSK2606414) -
Administration:p.o.; throughout the entire 21-day pregnancy
-
Result:Altered no behavioral performance in the Morris water maze after single GSK2606414 treatment, and fully rescued 4HBP-induced cognitive deficits to the control level; consistent rescued cognitive phenotypes were validated in the T-maze test.
Promoted proliferation and alleviated apoptosis of hippocampal NSCs in P1 and P56 offspring co-treated with 4HBP and GSK2606414.
Attenuated 4HBP-triggered PERK-eIF2α pathway activation, nuclear p65 accumulation, NF-κB signaling activation and inflammatory cytokine overexpression in offspring hippocampal tissues.
-
Animal Model:BALB/c nude mice (female, 4.5-5.5 weeks old, HepG2 cell-derived xenograft model (6.5 × 10⁸ cells suspended in a mixture of 1 mL sterile PBS and Matrigel at a 2:1 ratio))[2]
-
Dosage:5 nM
-
Administration:subcutaneous injection; 0, 3, 6, 9, 12 days
-
Result:Displayed significantly larger tumor volumes and higher tumor weights than paired vehicle control tumors at 22 days post-injection.
Chemical Information
-
CAS No. 1137-42-4
-
Appearance Solid
-
Molecular Weight 198.22
-
Formula C13H10O2
-
Color White to off-white
-
SMILES
O=C(C1=CC=C(O)C=C1)C2=CC=CC=C2
-
Synonyms
4HBP
-
Shipping
Room temperature in continental US; may vary elsewhere.
-
Storage
RT, stored under nitrogen
In solvent -80°C 1 year -20°C 6 months
Solvent & Solubility
In Vitro:
DMSO : 100 mg/mL (504.49 mM; Need ultrasonic; Hygroscopic DMSO has a significant impact on the solubility of product, please use newly opened DMSO)
Please refer to the solubility information to select the appropriate solvent. Once prepared, please aliquot and store the solution to prevent product inactivation from repeated freeze-thaw cycles.
Storage method and period of stock solution: -80°C, 1 year; -20°C, 6 months. When stored at -80°C, please use it within 1 year. When stored at -20°C, please use it within 6 months.
Please refer to the solubility information to select the appropriate solvent. Once prepared, please aliquot and store the solution to prevent product inactivation from repeated freeze-thaw cycles.
Storage method and period of stock solution: -80°C, 1 year; -20°C, 6 months. When stored at -80°C, please use it within 1 year. When stored at -20°C, please use it within 6 months.
Concentration (start) × Volume (start) = Concentration (final) × Volume (final)
In Vivo:
Select the appropriate dissolution method based on your experimental animal and administration route.
- For the following dissolution methods, please ensure to first prepare a clear stock solution using an In Vitro approach and then sequentially add co-solvents:
- To ensure reliable experimental results, the clarified stock solution can be appropriately stored based on storage conditions. As for the working solution for In Vivo experiments, it is recommended to prepare freshly and use it on the same day.
- The percentages shown for the solvents indicate their volumetric ratio in the final prepared solution. If precipitation or phase separation occurs during preparation, heat and/or sonication can be used to aid dissolution.
Add each solvent one by one: 10% DMSO 40% PEG300 5% Tween-80 45% Saline
Solubility: ≥ 5 mg/mL (25.22 mM); Clear solution
This protocol yields a clear solution of ≥ 5 mg/mL (saturation unknown).
Taking 1 mL working solution as an example, add 100 μL DMSO stock solution (50.0 mg/mL) to 400 μL PEG300, and mix evenly; then add 50 μL Tween-80 and mix evenly; then add 450 μL Saline to adjust the volume to 1 mL.
Preparation of Saline: Dissolve 0.9 g sodium chloride in ddH₂O and dilute to 100 mL to obtain a clear Saline solution.
Add each solvent one by one: 10% DMSO 90% (20% SBE-β-CD in Saline)
Solubility: ≥ 5 mg/mL (25.22 mM); Clear solution
This protocol yields a clear solution of ≥ 5 mg/mL (saturation unknown).
Taking 1 mL working solution as an example, add 100 μL DMSO stock solution (50.0 mg/mL) to 900 μL 20% SBE-β-CD in Saline, and mix evenly.
Preparation of 20% SBE-β-CD in Saline (4°C, storage for one week): 2 g SBE-β-CD powder is dissolved in 10 mL Saline, completely dissolve until clear.
In Vivo Dissolution Calculator
Please enter the basic information of animal experiments:
-
-
-
-
Recommended: Prepare an additional quantity of animals to account for potential losses during experiments.
Please enter your animal formula composition:
-
%DMSO +
Recommended: Keep the proportion of DMSO in working solution below 2% if your animal is weak.
-
%+
-
+%Tween-80 + +
-
%Saline +
The co-solvents required include: DMSO, . All of co-solvents are available by MedChemExpress (MCE). , Tween 80. All of co-solvents are available by MedChemExpress (MCE).
Working solution concentration: 0.22 mg/mL
Method for preparing stock solution: mg drug dissolved in μL DMSO. Stock solution concentration: mg/mL.
1. Take μL DMSO stock solution;
2. Add μL .
μL , mix evenly;
3. Then add μL Tween 80, mix evenly;
4. Then add μL
Please ensure that the stock solution in the first step is dissolved to a clear state, and add co-solvents in sequence. You can use ultrasonic heating (ultrasonic cleaner, recommended frequency 20-40 kHz), vortexing, etc. to assist dissolution.
Protocols
-
Cell differentiation
Cell differentiation refers to the process in which cells of the same origin gradually produce cell groups with different morphological structure and functional characteristics.
-
Liver Cancer Modeling
Liver cancer can be classified into primary liver cancer and secondary liver cancer. Secondary liver cancer is the metastatic liver cancer. Primary liver cancer includes hepatocellular carcinoma (HCC), intrahepatic cholangiocarcinoma (ICC) and fibrolamellar HCC, of which HCC is the most common form, accounting for approximately 90% of primary liver cancers[1]. HCC mouse models include chemical agent-induced models, transplanted tumor models, and genetic engineered models.
-
Directly Induced Neuron Culture
Directly induced neuron culture converts somatic cells, most commonly fibroblasts, into induced neurons without passing through a pluripotent or neural progenitor stage; classic evidence shows that mouse fibroblasts can be converted by Ascl1, Brn2/Pou3f2, and Myt1l, human fibroblasts can be converted by defined neuronal transcription factors, and human fibroblasts can also be converted by miR-9/9-124 with neurogenic or subtype-specifying transcription factors. The readout is acquisition of neuronal identity and function, assessed by neuronal morphology, neuronal markers such as Tuj1/βIII-tubulin, MAP2, synapsin, and subtype markers when relevant, together with functional assays such as action-potential firing, synaptic activity, and electrophysiology.
-
PC12 NGF-Induced Neuronal Differentiation Culture
PC12 cells are a rat adrenal pheochromocytoma clonal line that responds to NGF by stopping proliferation and extending branching neurite-like processes; after longer NGF exposure, cells develop long processes and neuronal-like ultrastructural and functional features. NGF-induced differentiation is read out mainly by neurite outgrowth, reduced proliferation, microtubule assembly, and neuronal differentiation-associated proteins such as MAPs, tau, GAP-43, and synapsin-1.
-
iPSC/hPSC-Derived Neuron Differentiation Culture
iPSC/hPSC-derived neuron differentiation culture directs pluripotent cells toward neuroectoderm and then neuronal lineages by suppressing developmental signals that maintain non-neural fates; the classic monolayer dual-SMAD approach blocks BMP and Activin/TGF-β signaling with Noggin or dorsomorphin/LDN193189 plus SB431542, producing PAX6-positive neural progenitors that can be further matured into neurons. The readout is generated by morphology, neural progenitor markers, neuronal markers, subtype markers, and functional assays: PAX6/SOX1/NESTIN indicate neural progenitor induction, βIII-tubulin/TUJ1 and MAP2 indicate neuronal differentiation, cortical programs can be assessed by FOXG1, TBR1, CTIP2, SATB2, and synaptic maturation can be assessed by synaptic proteins, calcium activity, multielectrode arrays, or patch-clamp electrophysiology.
-
Apoptosis
Apoptosis, also called programmed cell death, is generally characterized by distinct morphological characteristics.
-
TUNEL staining for apoptotic DNA fragmentation
TUNEL staining detects DNA strand breaks by using terminal deoxynucleotidyl transferase to add labeled nucleotides to exposed 3′-OH DNA termini, generating either microscopic staining in fixed cells or tissue sections, or fluorescence/cytometric signal in cell suspensions. TUNEL positivity reflects DNA fragmentation but should not be interpreted alone as definitive apoptosis, because TUNEL can also label necrotic, autolytic, mechanically damaged, or DNA-repair-associated DNA breaks.
-
Cell Cytotoxicity Assay
Cytotoxicity assays are usually based on the assessment of cell membrane damage, which can also be indirectly detected by measuring cell viability. Detection methods include MTT assay, CKK-8 assay, LDH assay and ATP assay, etc.
-
SH-SY5Y Neuronal Differentiation Culture
SH-SY5Y neuronal differentiation culture uses sequential exposure to retinoic acid and neurotrophic factors to reduce proliferative neuroblastoma-like behavior and induce neuron-like morphology, including neurite extension, neuronal marker expression, and, in RA/BDNF protocols, greater synaptic-marker expression than undifferentiated culture. Retinoic acid is commonly used as the initiating differentiation cue, while BDNF in serum-reduced or serum-free medium supports later maturation and neurotrophic-factor-dependent neuron-like survival.
-
Fluorescent plasma-membrane potential dye assay
Fluorescent plasma-membrane potential dye assays measure changes in cell membrane potential using voltage-sensitive dyes whose fluorescence changes when cells depolarize or hyperpolarize. Anionic bis-oxonol dyes such as DiBAC4(3) enter depolarized cells more readily and show increased fluorescence after intracellular binding, while hyperpolarization reduces dye accumulation and fluorescence. FMP/FLIPR membrane-potential dyes are used for faster, homogeneous microplate assays of ion-channel or receptor-mediated membrane-potential changes.
-
Mitochondrial membrane-potential and mitochondrial mass staining
Mitochondrial membrane potential staining measures the electrochemical polarization across the mitochondrial inner membrane in live cells using lipophilic cationic fluorescent probes; early rhodamine-based work showed that selective mitochondrial dye accumulation is lost when the mitochondrial transmembrane potential is dissipated. JC-1 reports mitochondrial polarization by shifting from green monomer fluorescence to red J-aggregate fluorescence as dye concentration increases within energized mitochondria; therefore, the red/green fluorescence ratio is used as a relative readout of mitochondrial membrane potential. TMRE or TMRM staining provides a single-channel relative readout because these cationic rhodamine esters accumulate in polarized mitochondria, and lower fluorescence indicates reduced mitochondrial polarization when acquisition and dye-loading conditions are controlled. Mitochondrial mass staining is commonly performed with MitoTracker Green FM or related MitoTracker dyes as
-
Apoptosis Solutions
Apoptosis is a regulated, generally non-lytic cell-death pathway that removes unwanted, damaged, infected, or abnormal cells through coordinated morphological changes, caspase activation, DNA fragmentation, and membrane remodeling. The intrinsic apoptosis pathway is controlled mainly by mitochondrial outer membrane permeabilization, BCL-2 family proteins, cytochrome c release, apoptosome formation, caspase-9 activation, and downstream executioner caspase-3/7 activation. The extrinsic apoptosis pathway is initiated by death receptors such as Fas, TNFR, and TRAIL receptors, which recruit adaptor proteins and activate caspase-8 before engaging executioner caspases or mitochondrial amplification through BID cleavage. Apoptosis is linked to many phenotypes, including cancer cell killing, tissue homeostasis, immune regulation, neurodegeneration, infection response, and treatment-induced cytotoxicity; unresolved questions include how apoptosis interacts with necroptosis, pyroptosis, ferroptos
-
Mitochondrial membrane-potential fluorescent assay
Mitochondrial membrane potential fluorescent assays estimate ΔΨm in living cells using lipophilic cationic dyes such as TMRM, TMRE, rhodamine 123, and JC-1, which accumulate in mitochondria according to membrane polarization; loss of signal after FCCP or CCCP treatment is interpreted as mitochondrial depolarization. TMRM/TMRE and rhodamine 123 are commonly used for semi-quantitative live-cell microscopy or flow cytometry, while JC-1 can report a shift from red aggregate fluorescence to green monomer fluorescence during depolarization; interpretation requires controls because dye concentration, quenching mode, cell type, dye efflux, and mitochondrial mass can affect fluorescence independently of ΔΨm.
-
Mammalian live/dead viability and cytotoxicity staining
Live/dead viability and cytotoxicity staining assays are based on the simultaneous detection of intracellular esterase activity in metabolically active (viable) cells and membrane integrity loss in non-viable cells. In commonly used dual-staining approaches, membrane-permeant fluorogenic substrates are converted by intracellular esterases into fluorescent products in live cells, while impermeant DNA-binding dyes selectively enter cells with compromised plasma membranes and label nucleic acids in dead or dying cells, enabling discrimination between viable and non-viable populations by fluorescence microscopy or flow cytometry.
-
Annexin V plus membrane-impermeant dye apoptosis staining
Annexin V-based apoptosis assays rely on the detection of phosphatidylserine (PS) externalization from the inner leaflet of the plasma membrane to the outer leaflet, an early biochemical hallmark of apoptosis. Fluorescently labeled Annexin V binds PS in a calcium-dependent manner, enabling identification of early apoptotic cells by flow cytometry or fluorescence microscopy. When combined with a membrane-impermeant DNA-binding dye (e. g. , propidium iodide), this approach allows discrimination between viable (Annexin V−/dye−), early apoptotic (Annexin V+/dye−), and late apoptotic or necrotic (Annexin V+/dye+) cell populations by assessing membrane integrity and PS exposure.
-
ROS/oxidative-stress fluorescent staining
ROS/oxidative-stress fluorescent staining uses cell-permeant fluorogenic probes that become fluorescent after oxidation inside cells or tissues; commonly used examples include DCFH-DA/DCFDA for broad cellular oxidant detection, DHE for superoxide-related signal detection, MitoSOX for mitochondrial superoxide-related signal detection, and CellROX probes for oxidative-stress-associated fluorescence readouts. The assay detects probe oxidation rather than a single ROS species unless the probe and analysis method have been chemically validated for that species. DCFH-DA enters cells, is deacetylated by intracellular esterases to DCFH, and produces fluorescent DCF after oxidation, so the readout is used as an operational measure of total cellular oxidative stress rather than a species-specific ROS measurement. DHE and MitoSOX can report superoxide-related oxidation, but red fluorescence alone can include non-specific ethidium-like oxidation products; HPLC or optimized spectral approaches are
-
hPSC directed neural induction/NPC culture
Directed neural induction of hPSCs uses inhibition of BMP and TGF-β/Activin/Nodal SMAD signaling to bias pluripotent cells toward neuroectoderm; the readout is emergence of neural plate/rosette-like cells and neural progenitor markers such as PAX6, SOX1/SOX2, and Nestin, followed by expandable NPCs that can generate neuronal lineages.
-
Patient-Derived Orthotopic Xenograft (PDOX)
Patient-derived orthotopic xenograft (PDOX) modeling implants fresh patient tumor tissue or patient-derived tumor cells into the anatomically corresponding organ or tissue site of immunodeficient mice, usually by surgical orthotopic implantation, to preserve patient tumor histology, local microenvironmental context, invasion, metastatic behavior, and treatment-response features better than subcutaneous implantation. PDOX readouts include tumor engraftment, orthotopic tumor growth, local invasion, metastasis, recurrence after resection, histologic similarity to the donor tumor, biomarker retention, molecular concordance, survival, and response or resistance to therapy. PDOX models are used for preclinical drug testing and individualized therapy evaluation, but engraftment success varies by tumor type and specimen quality.
-
PC12 NGF-induced neuronal-like differentiation
PC12 cells are a rat adrenal pheochromocytoma-derived clonal cell line that responds to nerve growth factor by stopping proliferation and extending neurites, producing a sympathetic neuron-like phenotype used to study neuronal differentiation and neurite outgrowth. NGF acts through TrkA-dependent signaling, and neurite outgrowth is associated with ERK/Akt signaling, microtubule organization, neuronal-marker expression, and increased electrophysiological neuronal features such as sodium-channel density. The main assay readout is morphological differentiation, usually measured as the percentage of neurite-bearing cells, neurite length, neurite number, or total neurite length per cell. Additional readouts include GAP-43, tyrosine hydroxylase, βIII-tubulin, neurofilament, synapsin I, synaptophysin, ERK phosphorylation, Akt phosphorylation, and sodium-channel current density.
-
Cell Viability Determination by MTT Colorimetric Assay
The following protocol uses the MTT colorimetric assay as a classic literature-established method for assessing cell viability/metabolic activity in cultured mammalian cells. MTT[3-(4,5-dimethylthiazol-2-yl)-2,5-diphenyltetrazolium bromide] is reduced by metabolically active cells to a colored formazan product; the amount of formazan is quantified spectrophotometrically and provides an indirect measure of metabolically active viable cells. Importantly, MTT reduction reflects cellular oxidoreductase/metabolic activity rather than an absolute direct count of living cells, so changes in cellular metabolism can alter the signal independently of cell number.
-
Human pluripotent stem cell neural induction and neuron differentiation
Human pluripotent stem cell neural induction can be achieved by blocking BMP and TGFβ/Activin/Nodal SMAD signaling, which suppresses non-neural differentiation and promotes early neuroectodermal identity; the expected readout is loss of pluripotency markers such as OCT4 and induction of neural markers such as PAX6, followed by neural progenitor and neuron marker acquisition during differentiation. This protocol uses dual-SMAD neural induction as the core induction method, followed by cortical neuron differentiation as a representative neuron differentiation model; published cortical protocols describe generation of cortical progenitors, temporally ordered cortical projection neurons, action-potential firing, synaptogenesis, and neural network formation over an approximately 80-day process.
-
SH-SY5Y neuronal-like differentiation
SH-SY5Y neuronal-like differentiation uses defined culture conditions to shift proliferative human neuroblastoma cells toward a neuron-like state, mainly assessed by reduced proliferation, neurite extension, neuronal-marker expression, and, in some protocols, increased dependence on neurotrophic support. Retinoic acid (RA) is commonly used for the first differentiation phase, and sequential RA followed by brain-derived neurotrophic factor (BDNF) in serum-free medium is a well-characterized approach for generating neuron-like SH-SY5Y cultures with extensive neurite outgrowth. The primary readouts are morphology-based neurite outgrowth and marker-based confirmation using proteins such as βIII-tubulin, MAP2, GAP43, synaptophysin, NeuN, NSE, TH, or related neuronal/synaptic markers, depending on the study endpoint.
-
Patient-Derived Xenograft (PDX)
Patient-derived xenograft (PDX) models are generated by engrafting primary human tumor tissue directly into immunodeficient mice, allowing in vivo propagation of patient tumor biology without initial in vitro adaptation. These models are used to preserve key histopathological and molecular characteristics of the original tumor and enable assessment of tumor growth dynamics and therapeutic response in a living organism. The biological readout is tumor engraftment and subsequent growth in the murine host, which reflects the ability of human tumor cells to survive, vascularize, and expand in an immunocompromised microenvironment.
-
Splenic/Portal-Vein Liver Metastasis Xenograft
Splenic and portal-vein liver metastasis xenograft models deliver tumor cells into the portal circulation so that cells reach the liver first and form hepatic metastatic lesions; splenic injection uses the spleen as an access route to the portal system, while direct portal-vein injection introduces cells into the portal vein without requiring splenectomy. The assay detects liver colonization, intrahepatic tumor growth, tumor distribution, treatment response, survival, and liver-metastasis microenvironment changes; readouts include bioluminescence or fluorescence imaging, gross liver nodule counts, liver weight or tumor burden, histology, and survival.
-
Subcutaneous Cell-Line-Derived Xenograft
Subcutaneous cell-line-derived xenograft (CDX) models are established by implanting cultured human cancer cell lines into immunodeficient mice, where the injected cells form localized tumors that can be monitored in vivo as a measure of tumorigenic potential, growth kinetics, and treatment response. These models are widely used in oncology research because they allow reproducible tumor formation and enable comparative assessment of tumor growth between different cell lines or genetic manipulations in a controlled in vivo microenvironment. Subcutaneous implantation of cancer cells in immunodeficient mice is a standard approach for evaluating tumor growth behavior and therapeutic response across multiple cancer types, including prostate, esophageal, pancreatic, and colon cancer models.
-
Orthotopic Cell-Line Xenograft
Orthotopic cell-line xenograft models involve implantation of human cancer cell lines into the anatomically corresponding organ of immunodeficient mice to reproduce tumor growth within a native microenvironment, enabling more clinically relevant tumor behavior compared with subcutaneous models. These models are widely used because orthotopic placement better recapitulates tumor progression, including invasion and metastatic spread, which are often underrepresented in heterotopic implantation systems. Compared with conventional xenografts, orthotopic implantation is described as more technically complex but provides improved simulation of tumor-microenvironment interactions and metastatic behavior, making it particularly valuable for translational oncology research. Surgical orthotopic implantation approaches have been emphasized as enabling faithful reproduction of clinical cancer features, including metastasis and disease progression patterns that align with the tumor’s organ of origi
-
Intraperitoneal/Peritoneal Dissemination Xenograft
Intraperitoneal (IP) or peritoneal dissemination xenograft models are based on the introduction of human cancer cells into the peritoneal cavity of immunodeficient mice, where they attach to peritoneal surfaces, form multicellular aggregates or spheroids, and progressively generate disseminated tumor nodules that mimic advanced peritoneal metastatic disease. These models are widely used to study ovarian cancer progression, tumor-microenvironment interactions, and intraperitoneal therapeutic responses, often incorporating bioluminescence or fluorescence imaging to longitudinally monitor tumor burden in vivo. The biological principle relies on the capacity of tumor cells such as SKOV3 or related ovarian carcinoma lines to survive in suspension, aggregate within ascites-like fluid, adhere to mesothelial surfaces, and invade peritoneal organs, thereby recapitulating human peritoneal carcinomatosis patterns observed in advanced disease.
Purity & Documentation
-
Data Sheet (299 KB)
-
SDS (418 KB)
- English - EN (418 KB)
- Français - FR (418 KB)
- Deutsch - DE (418 KB)
- Norwegian - NO (418 KB)
- Español - ES (418 KB)
- Swedish - SV (418 KB)
- Italian - IT (418 KB)
- Korean - KR (418 KB)
- Portuguese - PT (418 KB)
-
Handling Instructions (2659 KB)
References
Complete Stock Solution Preparation Table
Please refer to the solubility information to select the appropriate solvent. Once prepared, please aliquot and store the solution to prevent product inactivation from repeated freeze-thaw cycles.
Storage method and period of stock solution: -80°C, 1 year; -20°C, 6 months. When stored at -80°C, please use it within 1 year. When stored at -20°C, please use it within 6 months.
| Optional Solvent | Concentration Solvent Mass | 1 mg | 5 mg | 10 mg | 25 mg |
|---|---|---|---|---|---|
| DMSO | 1 mM | 5.0449 mL | 25.2245 mL | 50.4490 mL | 126.1225 mL |
| 5 mM | 1.0090 mL | 5.0449 mL | 10.0898 mL | 25.2245 mL | |
| 10 mM | 0.5045 mL | 2.5224 mL | 5.0449 mL | 12.6122 mL | |
| 15 mM | 0.3363 mL | 1.6816 mL | 3.3633 mL | 8.4082 mL | |
| 20 mM | 0.2522 mL | 1.2612 mL | 2.5224 mL | 6.3061 mL | |
| 25 mM | 0.2018 mL | 1.0090 mL | 2.0180 mL | 5.0449 mL | |
| 30 mM | 0.1682 mL | 0.8408 mL | 1.6816 mL | 4.2041 mL | |
| 40 mM | 0.1261 mL | 0.6306 mL | 1.2612 mL | 3.1531 mL | |
| 50 mM | 0.1009 mL | 0.5045 mL | 1.0090 mL | 2.5224 mL | |
| 60 mM | 0.0841 mL | 0.4204 mL | 0.8408 mL | 2.1020 mL | |
| 80 mM | 0.0631 mL | 0.3153 mL | 0.6306 mL | 1.5765 mL | |
| 100 mM | 0.0504 mL | 0.2522 mL | 0.5045 mL | 1.2612 mL |
Keywords
- 4-Hydroxybenzophenone
- 1137-42-4
- 4HBP
- Drug Metabolite
- PERK
- Eukaryotic Initiation Factor (eIF)
- NF-κB
- TNF Receptor
- Interleukin Related
- Reactive Oxygen Species (ROS)
- Apoptosis
- CHOP
- hepatocellular carcinoma cells
- ESR1
- unfolded protein response
- hippocampal neural stem cells
- XBP1s
- Cxcl1
- IRE1α
- endoplasmic reticulum stress
- Inhibitor
- inhibitor
- inhibit