



LHF418
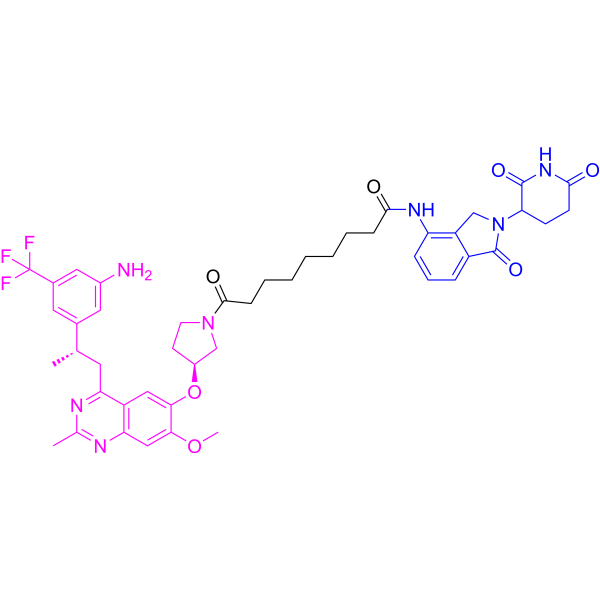
LHF418 is a SOS1 PROTAC degrader that induces the degradation of the target protein SOS1 by recruiting cereblon. LHF418 promotes the formation of the SOS1-PROTAC-CRBN ternary complex and induces SOS1 degradation in a cereblon- and proteasome-dependent manner. LHF418 inhibits EGF-induced ERK1/2 phosphorylation and the clonogenic growth of KRAS-mutant cancer cells. LHF418 can be used in studies related to SOS1-targeted protein degradation and KRAS-driven tumors.
(Pink: SOS1 ligand (HY-161452); Blue: Cereblon ligand (HY-A0003); Black: linker (HY-B0704)).
Nos produits utilisent uniquement pour la recherche. Nous ne vendons pas aux patients.
- Formule: C46H52F3N7O7
- Masse moléculaire:871.94
-
Stockage:
Please store the product under the recommended conditions in the Certificate of Analysis.

To place orders, for customer services and technical support, please contact: MedChemExpress USA
Tel: 609-228-6898 E-mail: [email protected] [email protected]


-
 Activité biologique
-
Chemical Information
- Protocole
- Pureté et documentation
- Références
-
 Help & FAQs


Voir tous les produits spécifiques à Isoform PROTACs
More

Activité biologique
Description
IC50 & Target
[1]|
SOS1 209.4 nM (DC50) |
Cellular Effect
|
Cell Line

|
Type | Value | Description | References |
|---|---|---|---|---|
| A549 | DC50 |
209.4 nM
|
SOS1 degradation in A549 human lung cancer cells assessed by immunoblotting assay after 24 h incubation.
SOS1 degradation in A549 human lung cancer cells assessed by immunoblotting assay after 24 h incubation.
|
38489998 |
| HPAF-II | DC50 |
353.9 nM
|
SOS1 degradation in HPAF-II human pancreatic cancer cells assessed by immunoblotting assay after 24 h incubation.
SOS1 degradation in HPAF-II human pancreatic cancer cells assessed by immunoblotting assay after 24 h incubation.
|
38489998 |
| MIA PaCa-2 | DC50 |
539.7 nM
|
SOS1 degradation in MIA-PACA2 human pancreatic cancer cells assessed by immunoblotting assay after 24 h incubation.
SOS1 degradation in MIA-PACA2 human pancreatic cancer cells assessed by immunoblotting assay after 24 h incubation.
|
38489998 |
In Vitro
LHF418 (10 nM-10 μM; 24 h) degrades SOS1 in a dose-dependent manner in A549 cells, with a DC50 of 209.4 nM and a Dmax of > 80%; at high concentrations of 20 μM and 30 μM, a hook effect occurs, and SOS1 degradation is incomplete[1].
LHF418 (3 μM; 0-72 h) reduces SOS1 protein levels in A549 cells in a time-dependent manner, with a T1/2 of 22.51 h fitted to the time curve; SOS1 levels decrease significantly at 24 h and continue to decline for at least 72 h[1].
LHF418 (10 nM-10 μM; 24 h) induces SOS1 degradation in KRASG12D-bearing HPAF-II cells, with a DC50 of 353.9 nM[1].
LHF418 (10 nM-10 μM; 24 h) induces SOS1 degradation in MIA-PACA2 cells carrying KRASG12C, with a DC50 of 539.7 nM[1].
LHF418 produces the highest maximum luminescence signal among the compared PROTACs in the AlphaScreen assay containing GST-SOS1 (100 nM) and His-CRBN (10 nM), which supports the formation of a strong SOS1-PROTAC-CRBN ternary complex[1].
SOS1 degradation induced by LHF418 (1 μM; 24 h) in A549 cells is blocked by the SOS1 warhead BI3406 (HY-125817) (10 μM; 1 h pre-exposure) or the CRBN ligand Lenalidomide (HY-A0003) (10 μM; 1 h pre-exposure)[1].
In A549 cells, the SOS1 degradation induced by LHF418 (1 μM; 24 h) is completely blocked by MG132 (HY-13259) (1 μM; 1 h pre-exposure) or MLN4924 (HY-70062) (0.5 μM; 1 h pre-exposure), whereas Bafilomycin (1 μM; 1 h pre-exposure) fails to restore SOS1 levels. These findings support that SOS1 degradation depends on the CRBN/ubiquitin-proteasome system rather than the lysosomal autophagy pathway[1].
LHF418 (10 nM-10 μM; 24 h) reduces SOS1 protein levels in A549 cells, but does not decrease SOS2 or GSPT1 protein levels even at the highest concentration of 10 μM[1].
LHF418 (10 nM-10 μM; 24 h; EGF 5 ng/mL, 1 h) inhibits EGF-induced ERK1/2 phosphorylation concomitant with a reduction in SOS1 levels in serum-starved A549 cells[1].
LHF418 (300 nM-30 μM; 14 days) inhibits the colony formation of MIA-PACA2 cells, and colony formation further decreases with increasing concentration[1].
MedChemExpress (MCE) has not independently confirmed the accuracy of these methods. They are for reference only. Further protocols information, click here.
-
Cell Line:A549
-
Concentration:10 nM-10 μM
-
Incubation Time:24 h
-
Result:Dose-dependently degraded SOS1.
Produced a DC50 of 209.4 nM.
Reached a Dmax of >80%.
Showed incomplete SOS1 degradation at 20 and 30 μM, consistent with a hook effect.
-
Cell Line:A549
-
Concentration:3 μM
-
Incubation Time:0-72 h
-
Result:Time-dependently reduced SOS1 protein levels.
Produced a fitted time-course T1/2 of 22.51 h.
Clearly reduced SOS1 at 24 h.
Maintained reduced SOS1 levels through 72 h.
-
Cell Line:HPAF-II (KRASG12D); MIA-PACA2 (KRASG12C)
-
Concentration:10 nM-10 μM
-
Incubation Time:24 h
-
Result:Degraded SOS1 with a DC50 of 353.9 nM.
Degraded SOS1 with a DC50 of 539.7 nM.
-
Cell Line:A549 cells
-
Concentration:LHF418: 1 μM; BI3406: 10 μM; Lenalidomide: 10 μM
-
Incubation Time:Competitor pre-exposure: 1 h; LHF418: 24 h
-
Result:SOS1 degradation was blocked by the SOS1 warhead BI3406.
SOS1 degradation was blocked by the CRBN ligand Lenalidomide.
-
Cell Line:A549 cells
-
Concentration:LHF418: 1 μM; MG132: 1 μM; MLN4924: 0.5 μM; Bafilomycin: 1 μM
-
Incubation Time:Modulator pre-exposure: 1 h; LHF418: 24 h
-
Result:SOS1 degradation was completely blocked by MG132.
SOS1 degradation was completely blocked by MLN4924.
SOS1 degradation was not rescued by Bafilomycin.
-
Cell Line:A549 cells
-
Concentration:10 nM-10 μM
-
Incubation Time:24 h
-
Result:Reduced SOS1 protein levels.
Did not reduce SOS2 protein levels at concentrations up to 10 μM.
Did not reduce GSPT1 protein levels at concentrations up to 10 μM.
-
Cell Line:A549 cells
-
Concentration:10 nM-10 μM
-
Incubation Time:24 h; EGF 5 ng/mL for 1 h
-
Result:Reduced SOS1 protein levels.
Suppressed EGF-induced ERK1/2 phosphorylation.
-
Cell Line:MIA-PACA2
-
Concentration:300 nM, 1 μM, 3 μM, 10 μM, 30 μM
-
Incubation Time:14 days
-
Result:Suppressed colony formation.
Produced progressively fewer colonies with increasing concentration.


Chemical Information
-
Masse moléculaire 871.94
-
Formule C46H52F3N7O7
-
SMILES
NC1=CC([C@@H](C)CC2=NC(C)=NC3=C2C=C(O[C@@H]4CN(C(CCCCCCCC(NC5=C6C(C(N(C7CCC(NC7=O)=O)C6)=O)=CC=C5)=O)=O)CC4)C(OC)=C3)=CC(C(F)(F)F)=C1
-
Livraison
Room temperature in continental US; may vary elsewhere.
-
Stockage
Please store the product under the recommended conditions in the Certificate of Analysis.

Protocole
-
Kinase activity and phosphorylation assays
Kinase activity assays measure the ability of kinases to transfer phosphate groups from ATP to specific substrates, while phosphorylation assays detect the presence and levels of phosphorylated proteins. Common methods include radiolabeled ATP incorporation (e. g. ,), ADP release detection via bioluminescence (e. g. ,[3]), enzyme-linked immunosorbent assays (ELISA) for phospho-specific epitopes (e. g. ,[6]), and microtiter-based formats for high-throughput screening (e. g. ,[8]). The ADP-Glo assay quantifies kinase activity by measuring ADP produced during phosphorylation using a luciferase-based system. Radiometric assays involve autoradiography or scintillation counting after incorporation of 32P-labeled ATP into substrate proteins. ELISA-based approaches rely on phospho-specific antibodies to detect activated kinases in cell lysates or purified samples.
-
Western Blot
Western blotting (WB) is a commonly used experimental method in molecular biology, biochemistry, and immunogenetics for identifying and quantifying target proteins. It combines gel electrophoresis with immunoassay, enabling researchers to analyze protein expression, post-translational modifications, and molecular weight.
-
Protocol for Kinase activity and phosphorylation assays
Kinase activity assays measure transfer of phosphate from ATP to a protein or peptide substrate, generating phosphorylated substrate, ADP, or incorporated radiolabeled phosphate as the readout; phosphorylation assays measure site-specific phosphorylation in cells or tissues as a proxy for kinase-pathway activation, inhibition, or substrate regulation. Phosphorylation can be detected by phospho-specific Western blot, immunoprecipitation kinase assay, phospho-immunofluorescence, phospho-flow cytometry, luminescent ADP detection, radiolabeled ATP incorporation, or reporter-based pathway assays, and these readouts can be applied to cancer cells, primary neurons, mouse tumors, organoids, inflammatory macrophages, ferroptosis studies, and mitophagy studies when the kinase target is biologically relevant.
-
Soft Agar Colony Formation Assay
Soft agar colony formation assay measures anchorage-independent growth, in which transformed or tumorigenic cells proliferate as colonies in a semisolid agar matrix while many non-transformed adherent cells fail to proliferate without attachment; classic studies showed that growth in semisolid medium correlates with tumorigenicity in nude mice, and later protocol papers describe the method as a stringent in vitro assay for malignant transformation. The readout is the number, size, morphology, or signal intensity of colonies formed within agar after incubation; published formats include manual colony counting after staining, 96-well or 384-well quantitative formats, DNA-binding dye detection, MTT/tetrazolium-based detection, digital image analysis, and PCR-based marker detection from soft agar cultures.


Pureté et documentation
Références

Calculators
Concentration (start) × Volume (start) = Concentration (final) × Volume (final)


LHF418 Related Classifications
HY-161450 Related Classifications
 Powered by Bioz