



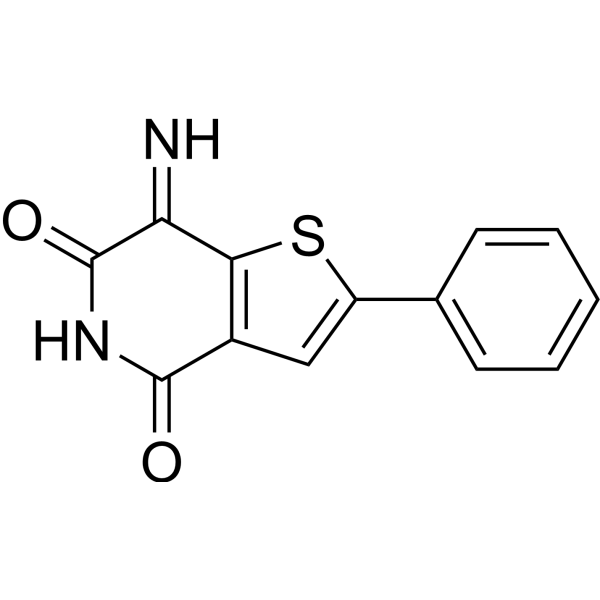
JMS-053
Based on 3 publication(s) in Google Scholar
JMS-053 is an efficient and reversible PTP4A3 inhibitor, with an IC50 value of 18 nM. JMS-053 demonstrates broad PTP4A inhibitory activity with IC50s of 50 nM and 53 nM for PTP4A1 and PTP4A2, respectively. JMS-053 exhibits IC50 values of 92.6 nM and 207.6 nM for CDC25B and DUSP3, respectively. JMS-053 can effectively inhibit the activity of PTP4A3, inhibit tumor cell proliferation and migration through multiple mechanisms such as interfering with RhoA and STAT3/p38 signaling pathway. JMS-053 can be used for the study of cancers such as ovarian cancer, breast cancer and colon cancer.
연구목적의 판매만을 진행합니다. 환자를 대상으로 한 판매는 하지 않습니다.
- Purity : 98.0%
- CAS No.: 1954650-11-3
- 화학식: C13H8N2O2S
- 분자량:256.28
-
보관:Powder -20°C, 3 years , 4°C, 2 years ; In solvent -80°C, 6 months , -20°C, 1 month

To place orders, for customer services and technical support, please contact: MedChemExpress USA
Tel: 609-228-6898 E-mail: [email protected] [email protected]


-
 Biological Activity
-
Chemical Information
-
용액&용해도
- Protocol
- 순도&문서
- References
-
 Help & FAQs


Publications Citing Use of MedChemExpress (MCE) JMS-053
More

Biological Activity
제품 설명
IC50 & Target
[3]|
STAT3 |
Cellular Effect
|
Cell Line

|
Type | Value | Description | References |
|---|---|---|---|---|
| MDA-MB-231 | EC50 |
42.7 μM
Compound: 1; JMS-053
|
Cytotoxicity against human MDA-MB-231 cells assessed as reduction in cell viability measured after 72 hrs by CellTiter-Glo assay
Cytotoxicity against human MDA-MB-231 cells assessed as reduction in cell viability measured after 72 hrs by CellTiter-Glo assay
|
[PMID: 34089839] |
In Vitro
JMS-053 (48 h) exhibits antiproliferative activity against MDA-MB-231 (IC50 = 32.67 μM; cytotoxicity: EC50 = 42.7 μM), Hs578T (IC50 = 8.48 μM), OVCAR4 (IC50 = 4.42 μM), Kuramochi (IC50 = 13.25 μM), A2780 (IC50 = 0.6 μM)[1][2][4].
JMS-053 (0.1-5 μM, 14 d) exhibits concentration-dependent inhibition of clone formation in PTP4A3 fl/fl cells, but has no inhibition in PTP4A3 -/- cells[5].
JMS-053 (0 nM-10 μM, 0-2 h) does not increased the level of ROS in OVCAR4 cells and no typical characteristics of oxidative stress is observed[1].
JMS-053 (5 μM, 0-24 h) normalizes trans-endothelial electrical resistance (TEER) after vascular endothelial growth factor (VEGF) or lipopolysaccharide (LPS) challenge in MVEC cells[2].
JMS-053 (0.1-40 μM, 15-24 h) inhibits the migration of HeyA8 cells, OVCAR4 WT cells and PTP4A3 fl/fl cells, but cannot in OVCAR4 RES cells and PTP4A3 -/- cells[2][3][5].
JMS-053 (0.1-1 μM) inhibits serum-induced RhoA activation in a concentration-dependent manner in HeyA8 cells[2].
JMS-053 (1.5-40 μM, 7 min-24 h) rapidly downregulates STAT3 activation by inhibiting PTP4A3, while rapidly upregulating the phosphorylation of SHP-2 phosphatase and p38 kinase in OVCAR4 WT cells[3].
JMS-053 (85.4 μM, 2 h) cannot activate the endoplasmatic reticulum (ER) stress/unfolded protein response (UPR) signaling pathway[4].
JMS-053 (1-5 μM) significantly reduces PTP4A3 fl/fl cell adhesion index and significantly inhibits the activation of RhoA induced by PDGF-β[5].
MedChemExpress (MCE) has not independently confirmed the accuracy of these methods. They are for reference only.
-
Cell Line:HeyA8 cells
-
Concentration:0.75, 1.25, 2.5 μM
-
Incubation Time:15 h
-
Result:Inhibited the migration of HeyA8 cells in a concentration-dependent manner.
-
Cell Line:OVCAR4 WT and OVCAR4 RES cells
-
Concentration:4.5 and 40 μM
-
Incubation Time:24 h
-
Result:Effectively inhibited the cell migration stimulated by IL-6 in OVCAR4 WT cells, but not in OVCAR4 RES cells.
-
Cell Line:OVCAR4 WT and OVCAR4 RES cells
-
Concentration:1.5, 4.5, 40 μM
-
Incubation Time:7, 15, 30 min, 1, 2, 4, 6 and 24 h
-
Result:Significantly reduced pY705-STAT3 in OVCAR4 WT cells.
Significantly increased the phosphorylation of SHP-2 at the Y580 and Y542 sites and the total level of SHP-2 protein remained unchanged in OVCAR4 WT cells.
Rapidly increased p38 phosphorylation in OVCAR4 WT cells.
Significantly weakened or eliminated the signal response, and the levels of p-p38 and pY705-STAT3 remained almost unchanged in OVCAR4 RES cells.
-
Cell Line:PTP4A3 fl/fl cells and PTP4A3 -/- cells
-
Concentration:PTP4A3 fl/fl cells, but has no inhibition in PTP4A3 -/- cells
-
Incubation Time:16 h
-
Result:Effectively inhibited the cell migration stimulated by IL-6 in PTP4A3 fl/fl cells, but not in PTP4A3 -/- cells.
In Vivo
MedChemExpress (MCE) has not independently confirmed the accuracy of these methods. They are for reference only.
-
Animal Model:HeyA8-MDR cells xenograft models established in female athymic nude mice[1]
-
Dosage:10 mg/kg
-
Administration:intraperitoneal injection (i.p.), once daily for 5 consecutive days, followed by a 2-day break and then a 4-day continuous administration
-
Result:Reduced the average tumor weight by 45% compared to the control group with no significant difference in weight.
- BrdU Incorporation Assay
- Cell migration
- Somatic Cell Culture
- CFSE Dye Dilution Proliferation Assay
- Dye-dilution cell tracking and proliferation staining
- CCK-8/WST-8 Cell Proliferation Assay
- Protocol for Cell Cycle
- Cell Counting-Based Growth Curve Assay
- Colony Formation (Clonogenic) Assay
- Breast Cancer Modeling
- Cell Viability Determination by MTT Colorimetric Assay
- EdU Incorporation Assay (Click Chemistry-Based DNA Synthesis Measurement)
- Ki-67 Immunostaining Proliferation Assay
- PCNA Immunodetection Proliferation Assay
- Protocol for Cell Counting and Cell Density Analysis
- MTT Cell Proliferation Assay


Chemical Information
-
CAS No. 1954650-11-3
-
Appearance Solid
-
분자량 256.28
-
화학식 C13H8N2O2S
-
Color Light brown to brown
-
SMILES
O=C1C(C=C(C2=CC=CC=C2)S3)=C3C(C(N1)=O)=N
-
선적
Room temperature in continental US; may vary elsewhere.
-
보관
Powder -20°C 3 years 4°C 2 years In solvent -80°C 6 months -20°C 1 month


Publications (3)
-
Journal Impact Factor
-
Most Recent
-
FASEB J
Genome-Wide CRISPR-Cas9 Knockout Screening Identifies Genes Modulating Cisplatin-Induced Cytotoxicity in Renal Proximal Tubule Epithelial Cells. [Abstract]2025 Jul 15;39(13):e70780. PMID: 40632661 -
-
bioRxiv
Phosphatase activity is dispensable for PRL-3-mediated oncogenesis and tumor progression. [Abstract]2025 May 18:2025.05.14.654016. PMID: 40463094


용액&용해도
In Vitro:
DMSO : 10 mg/mL (39.02 mM; ultrasonic and warming and heat to 60°C; Hygroscopic DMSO has a significant impact on the solubility of product, please use newly opened DMSO)
Please refer to the solubility information to select the appropriate solvent. Once prepared, please aliquot and store the solution to prevent product inactivation from repeated freeze-thaw cycles.
Storage method and period of stock solution: -80°C, 6 months; -20°C, 1 month. When stored at -80°C, please use it within 6 months. When stored at -20°C, please use it within 1 month.
Please refer to the solubility information to select the appropriate solvent. Once prepared, please aliquot and store the solution to prevent product inactivation from repeated freeze-thaw cycles.
Storage method and period of stock solution: -80°C, 6 months; -20°C, 1 month. When stored at -80°C, please use it within 6 months. When stored at -20°C, please use it within 1 month.
Concentration (start) × Volume (start) = Concentration (final) × Volume (final)
In Vivo:
Select the appropriate dissolution method based on your experimental animal and administration route.
- For the following dissolution methods, please ensure to first prepare a clear stock solution using an In Vitro approach and then sequentially add co-solvents:
- To ensure reliable experimental results, the clarified stock solution can be appropriately stored based on storage conditions. As for the working solution for In Vivo experiments, it is recommended to prepare freshly and use it on the same day.
- The percentages shown for the solvents indicate their volumetric ratio in the final prepared solution. If precipitation or phase separation occurs during preparation, heat and/or sonication can be used to aid dissolution.
Add each solvent one by one: 10% DMSO 90% (20% SBE-β-CD in Saline)
Solubility: 1 mg/mL (3.90 mM); Suspended solution; Need ultrasonic
This protocol yields a suspended solution of 1 mg/mL. Suspended solution can be used for oral and intraperitoneal injection.
Taking 1 mL working solution as an example, add 100 μL DMSO stock solution (10.0 mg/mL) to 900 μL 20% SBE-β-CD in Saline, and mix evenly.
Preparation of 20% SBE-β-CD in Saline (4°C, storage for one week): 2 g SBE-β-CD powder is dissolved in 10 mL Saline, completely dissolve until clear.
In Vivo Dissolution Calculator
Please enter the basic information of animal experiments:
-
-
-
-
Recommended: Prepare an additional quantity of animals to account for potential losses during experiments.
Please enter your animal formula composition:
-
%DMSO +
Recommended: Keep the proportion of DMSO in working solution below 2% if your animal is weak.
-
%+
-
+%Tween-80 + +
-
%Saline +
The co-solvents required include: DMSO, . All of co-solvents are available by MedChemExpress (MCE). , Tween 80. All of co-solvents are available by MedChemExpress (MCE).
Working solution concentration: 0.22 mg/mL
Method for preparing stock solution: mg drug dissolved in μL DMSO. Stock solution concentration: mg/mL.
1. Take μL DMSO stock solution;
2. Add μL .
μL , mix evenly;
3. Then add μL Tween 80, mix evenly;
4. Then add μL
Please ensure that the stock solution in the first step is dissolved to a clear state, and add co-solvents in sequence. You can use ultrasonic heating (ultrasonic cleaner, recommended frequency 20-40 kHz), vortexing, etc. to assist dissolution.


순도&문서
-
Data Sheet (283 KB)
-
SDS (251 KB)
- English - EN (251 KB)
- Français - FR (251 KB)
- Deutsch - DE (251 KB)
- Norwegian - NO (251 KB)
- Español - ES (251 KB)
- Swedish - SV (251 KB)
- Italian - IT (251 KB)
- Korean - KR (251 KB)
- Portuguese - PT (251 KB)
-
Handling Instructions (2659 KB)
References
[1]. Lazo JS, et, al. Next-Generation Cell-Active Inhibitors of the Undrugged Oncogenic PTP4A3 Phosphatase. J Pharmacol Exp Ther. 2019 Dec;371(3):652-662. [Content Brief]
[2]. McQueeney KE, et al. Targeting ovarian cancer and endothelium with an allosteric PTP4A3 phosphatase inhibitor. Oncotarget. 2017 Dec 30;9(9):8223-8240. [Content Brief]
[3]. Lazo JS, Isbell KN, Vasa SA, Llaneza DC, Rastelli EJ, Wipf P, Sharlow ER. Disruption of Ovarian Cancer STAT3 and p38 Signaling with a Small-Molecule Inhibitor of PTP4A3 Phosphatase. J Pharmacol Exp Ther. 2023 Mar;384(3):429-438. doi: 10.1124/jpet.122.001401. Epub 2023 Jan 10. PMID: 36627205; PMCID: PMC9976793. [Content Brief]
[4]. Rastelli EJ, et al. Synthesis and evaluation of bifunctional PTP4A3 phosphatase inhibitors activating the ER stress pathway. Bioorg Med Chem Lett. 2021 Aug 15;46:128167. [Content Brief]
[5]. McQueeney KE, et al. A chemical genetics approach identifies PTP4A3 as a regulator of colon cancer cell adhesion. FASEB J. 2018 Oct;32(10):5661-5673. doi: 10.1096/fj.201701446R. Epub 2018 May 10. PMID: 29746167; PMCID: PMC6133700. [Content Brief]


Complete Stock Solution Preparation Table
Please refer to the solubility information to select the appropriate solvent. Once prepared, please aliquot and store the solution to prevent product inactivation from repeated freeze-thaw cycles.
Storage method and period of stock solution: -80°C, 6 months; -20°C, 1 month. When stored at -80°C, please use it within 6 months. When stored at -20°C, please use it within 1 month.
| Optional Solvent | Concentration Solvent Mass | 1 mg | 5 mg | 10 mg | 25 mg |
|---|---|---|---|---|---|
| DMSO | 1 mM | 3.9020 mL | 19.5099 mL | 39.0198 mL | 97.5496 mL |
| 5 mM | 0.7804 mL | 3.9020 mL | 7.8040 mL | 19.5099 mL | |
| 10 mM | 0.3902 mL | 1.9510 mL | 3.9020 mL | 9.7550 mL | |
| 15 mM | 0.2601 mL | 1.3007 mL | 2.6013 mL | 6.5033 mL | |
| 20 mM | 0.1951 mL | 0.9755 mL | 1.9510 mL | 4.8775 mL | |
| 25 mM | 0.1561 mL | 0.7804 mL | 1.5608 mL | 3.9020 mL | |
| 30 mM | 0.1301 mL | 0.6503 mL | 1.3007 mL | 3.2517 mL |


JMS-053 Related Classifications
HY-135457 Related Classifications
 Powered by Bioz