



IBG1

Based on 1 Customer Validation
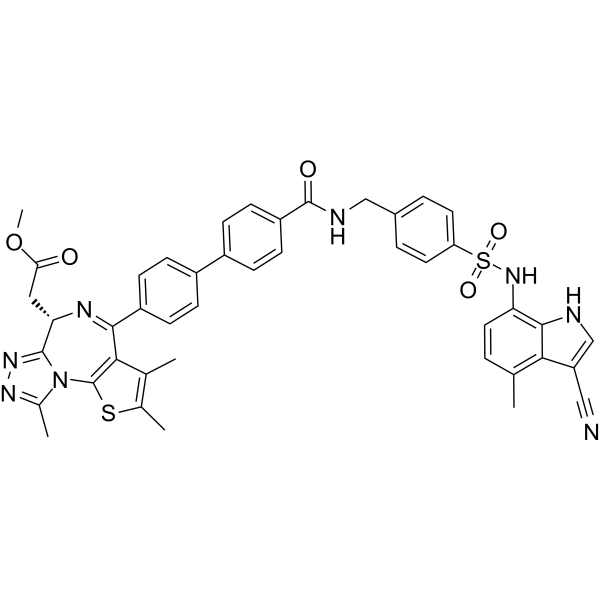
IBG1 is a bivalent molecular glue degrader targeting BRD2/BRD4, with IC50 values of 12.8 nM and 462 nM, respectively, and an EC50 of 44 nM. By binding to the adjacent BD1 and BD2 bromodomains of BRD2 and BRD4, IBG1 stabilizes the ternary complex formed with DCAF16, thereby driving CRL-mediated ubiquitination and proteasomal degradation. IBG1 induces cancer cell apoptosis and inhibits cancer cell growth in a DCAF16-dependent manner, and downregulates MYC expression through DCAF16-independent BET bromodomain inhibition. IBG1 can be used in research of various cancers including prostate cancer.
For research use only. We do not sell to patients.
- Purity : 99.88%
- CAS No.: 2684292-71-3
- Formula: C44H38N8O5S2
- Molecular Weight:822.95
-
Storage:
-20°C, protect from light, stored under nitrogen
* In solvent : -80°C, 6 months; -20°C, 1 month (protect from light, stored under nitrogen)

To place orders, for customer services and technical support, please contact: MedChemExpress USA
Tel: 609-228-6898 E-mail: [email protected] [email protected]


-
 Biological Activity
-
Chemical Information
-
Solvent & Solubility
- Protocols
- Purity & Documentation
- References
-
 Help & FAQs




Biological Activity
Description
IC50 & Target
[1]|
BRD2 12.8 nM (IC50) |
BRD4 462 nM (IC50) |
In Vitro
IBG1 (0.01-1 μM; 22 h) potently degrades BRD4 in both PSMA-negative PC3 and PSMA-positive PC3-PIP human prostate adenocarcinoma cells with a sub-nanomolar DC50[2].
IBG1 selectively stabilizes the BRD4-DCAF16 ternary complex over BRD3-DCAF16 via BRD4 residue G386, with binding free energy changes from mutations matching experimentally observed degradation selectivity[3].
IBG1 acts as an intramolecular bivalent glue to bridge BRD4's BD1 and BD2 bromodomains, stabilizing a BRD4:DCAF16 interaction (Kd = 1.5 μM) with high cooperativity to drive selective degradation of BRD4 and BRD2[4].
IBG1 (0.01-1 μM; 22 h) potently degrades BRD4 with sub-nanomolar potency in PC3 and PC3-PIP prostate cancer cells[5].
IBG1 (16 h) does not covalently modify DCAF16 in the presence or absence of recombinant BRD4_tandem[6].
IBG1 (1 μM; 16 h) induces BRD4 degradation in DCAF16-knockout K562 cells expressing wild-type DCAF16, DCAF16(C58S), or DCAF16(A53R), but not in cells expressing DCAF16(C177S) or DCAF16(C179S)[6].
IBG1 (0.001-10 μM; 16 h) induces dose-dependent degradation of BRD4tandem-eGFP in DCAF16-knockout K562 cells expressing wild-type DCAF16 or DCAF16C58S, but not in cells expressing DCAF16C177S or DCAF16C179S[6].
IBG1 enhances the intrinsic affinity between BRD4 and DCAF16, binds at the DCAF16/BRD4 BD1/BD2 interface to form a stable ternary complex with DDB1, and acts as an intramolecular bivalent glue to degrade BRD4 via DCAF16-mediated recruitment to the E3 ligase complex[7].
IBG1 (0.1-1000 nM; 6 h) potently degrades BRD2 and BRD4, but not BRD3, in HEK293 cells[8].
IBG1 (1 nM; 6 h) selectively downregulates BRD4 and BRD2 in KBM7 cells[8].
IBG1 (0.01-1 μM; 25 h) induces rapid, concentration-dependent degradation of BRD4 in BromoTag-HiBiT-BRD4 knock-in HEK293 cells, an effect abrogated by MLN4924 pre-treatment[8].
IBG1 (0.01-1 μM; 6 h) induces concentration-dependent ubiquitination of BRD4 in LgBiT-transfected HiBiT-BromoTag-BRD4 knock-in HEK293 cells, an effect blocked by NEDD8-activating enzyme inhibitor but not by bromodomain and extra-terminal motif inhibitor or vascular endothelial growth factor receptor inhibitor pre-treatment[8].
IBG1 (0.1-1000 nM; 6 h) degrades BRD2 and BRD4 in both wild-type and DCAF15-knockout HCT-116 cells, demonstrating DCAF15-independent activity[8].
IBG1 (1 nM; 6 h)-mediated BRD4 degradation in KBM7 iCas9 BRD4-BFP reporter cells requires the CRL4-DCAF16 complex, but not DCAF15[8].
Resistance to IBG1 (58 nM; 6 days)-induced cell death in HCT-116 cells is mediated by the CRL4-DCAF16 complex component DCAF16 and the ubiquitin-conjugating enzyme UBE2G1[8].
IBG1 promotes formation of a stable ternary complex between BRD4Tandem and DCAF16-DDB1(ΔBPB)-DDA1 with a Kd of 567 nM, as measured by ITC[8].
IBG1 (increasing concentrations; 30 min) promotes dose-dependent formation of the BRD4Tandem-DCAF16 ternary complex with an EC50 of 44 nM, as measured by TR-FRET[8].
IBG1 (1 μM; 30 min) enhances the intrinsic interaction between BRD4Tandem and DCAF16 (Kd = 712 nM in presence of IBG1 vs. 1 μM in absence), while no interaction occurs between DCAF16 and isolated BRD4 bromodomains[8].
IBG1 (ex vivo; 50 min) stabilizes the formation of a ternary complex between BRD4Tandem and DCAF16-DDB1(ΔBPB)-DDA1, as shown by SEC co-elution, while isolated BRD4 bromodomains do not form a stable complex with DCAF16 in the presence of IBG1[8].
IBG1 (increasing concentrations) exhibits significantly higher binding affinity to BRD4Tandem in the presence of DCAF16 (IC50 = 12.8 nM vs. 462 nM alone), while no such enhancement occurs with isolated BRD4BD1[8].
IBG1 (1 nM; 6 h) selectively degrades BRD2Tandem and BRD4Tandem, but not BRD3Tandem or isolated BRD4 bromodomains, in KBM7 reporter cells, with BRD4BD2 being the key determinant of selectivity over BRD3[8].
MedChemExpress (MCE) has not independently confirmed the accuracy of these methods. They are for reference only.
-
Cell Line:human prostate adenocarcinoma PC3 (PSMA-negative), PC3-PIP (PSMA-positive)
-
Concentration:0.01-1 μM
-
Incubation Time:22 h
-
Result:Induced potent BRD4 degradation with a sub-nanomolar DC50.
Showed far greater degradation activity than non-cleavable PSMA-IBG conjugates IBG-N1 and IBG-N2, which only showed minimal degradation at concentrations up to 1 μM.
-
Cell Line:human prostate adenocarcinoma PC3 (PSMA-negative), PC3-PIP (PSMA-overexpressing)
-
Concentration:0.01-1 μM
-
Incubation Time:22 h
-
Result:Induced sub-nanomolar BRD4 degradation in both cell lines.
-
Cell Line:DCAF16-knockout K562 cells transduced with HA-DCAF16 mutants (wild-type, C58S, C177S, C179S, A53R)
-
Concentration:1 μM
-
Incubation Time:16 h
-
Result:Induced BRD4 degradation in cells expressing wild-type DCAF16, DCAF16(C58S), or DCAF16(A53R).
Failed to induce BRD4 degradation in cells expressing DCAF16 mutants C177S and C179S.
-
Cell Line:HEK293 cells
-
Concentration:0.1-1000 nM
-
Incubation Time:6 h
-
Result:Induced degradation of BRD2 and BRD4 (long and short isoforms) in a concentration-dependent manner.
Caused no detectable degradation of BRD3.
-
Cell Line:wild-type and DCAF15-knockout HCT-116 cells
-
Concentration:0.1-1000 nM
-
Incubation Time:6 h
-
Result:Induced degradation of BRD2 and BRD4 (short isoform) in both wild-type and DCAF15-knockout HCT-116 cells.
Showed no difference in degradation efficiency between the two cell lines.
- RNA extraction experimental
- Detection of Apoptosis
- TUNEL staining for apoptotic DNA fragmentation
- Annexin V plus membrane-impermeant dye apoptosis staining
- Protocol for Cell Counting and Cell Density Analysis
- Somatic Cell Culture
- Apoptosis Solutions
- CCK-8/WST-8 Cell Proliferation Assay
- Cell Counting-Based Growth Curve Assay
- MTT Cell Proliferation Assay
- Cell Viability Determination by MTT Colorimetric Assay


Chemical Information
-
CAS No. 2684292-71-3
-
Appearance Solid
-
Molecular Weight 822.95
-
Formula C44H38N8O5S2
-
Color White to yellow
-
SMILES
CC1=C(C)SC2=C1C(C3=CC=C(C4=CC=C(C=C4)C(NCC5=CC=C(C=C5)S(NC6=C7C(C(C#N)=CN7)=C(C=C6)C)(=O)=O)=O)C=C3)=N[C@@H](CC(OC)=O)C8=NN=C(C)N28
-
Shipping
Room temperature in continental US; may vary elsewhere.
-
Storage
-20°C, protect from light, stored under nitrogen
* In solvent : -80°C, 6 months; -20°C, 1 month (protect from light, stored under nitrogen)


Solvent & Solubility
In Vitro:
DMSO : 100 mg/mL (121.51 mM; Need ultrasonic; Hygroscopic DMSO has a significant impact on the solubility of product, please use newly opened DMSO)
Please refer to the solubility information to select the appropriate solvent. Once prepared, please aliquot and store the solution to prevent product inactivation from repeated freeze-thaw cycles.
Storage method and period of stock solution: -80°C, 6 months; -20°C, 1 month (protect from light, stored under nitrogen). When stored at -80°C, please use it within 6 months. When stored at -20°C, please use it within 1 month.
Please refer to the solubility information to select the appropriate solvent. Once prepared, please aliquot and store the solution to prevent product inactivation from repeated freeze-thaw cycles.
Storage method and period of stock solution: -80°C, 6 months; -20°C, 1 month (protect from light, stored under nitrogen). When stored at -80°C, please use it within 6 months. When stored at -20°C, please use it within 1 month.
Concentration (start) × Volume (start) = Concentration (final) × Volume (final)


Purity & Documentation
-
Data Sheet (297 KB)
-
SDS (394 KB)
- English - EN (394 KB)
- Français - FR (394 KB)
- Deutsch - DE (394 KB)
- Norwegian - NO (394 KB)
- Español - ES (394 KB)
- Swedish - SV (394 KB)
- Italian - IT (394 KB)
- Korean - KR (394 KB)
- Portuguese - PT (394 KB)
-
Handling Instructions (2659 KB)
References
[6]. Li YD, et al. Template-assisted covalent modification underlies activity of covalent molecular glues. Nature chemical biology. 2024 Dec;20(12):1640-1649. [Content Brief]
[8]. Hsia O, et al. Targeted protein degradation via intramolecular bivalent glues. Nature. 2024 Mar;627(8002):204-211. [Content Brief]


Complete Stock Solution Preparation Table
Please refer to the solubility information to select the appropriate solvent. Once prepared, please aliquot and store the solution to prevent product inactivation from repeated freeze-thaw cycles.
Storage method and period of stock solution: -80°C, 6 months; -20°C, 1 month (protect from light, stored under nitrogen). When stored at -80°C, please use it within 6 months. When stored at -20°C, please use it within 1 month.
| Optional Solvent | Concentration Solvent Mass | 1 mg | 5 mg | 10 mg | 25 mg |
|---|---|---|---|---|---|
| DMSO | 1 mM | 1.2151 mL | 6.0757 mL | 12.1514 mL | 30.3785 mL |
| 5 mM | 0.2430 mL | 1.2151 mL | 2.4303 mL | 6.0757 mL | |
| 10 mM | 0.1215 mL | 0.6076 mL | 1.2151 mL | 3.0379 mL | |
| 15 mM | 0.0810 mL | 0.4050 mL | 0.8101 mL | 2.0252 mL | |
| 20 mM | 0.0608 mL | 0.3038 mL | 0.6076 mL | 1.5189 mL | |
| 25 mM | 0.0486 mL | 0.2430 mL | 0.4861 mL | 1.2151 mL | |
| 30 mM | 0.0405 mL | 0.2025 mL | 0.4050 mL | 1.0126 mL | |
| 40 mM | 0.0304 mL | 0.1519 mL | 0.3038 mL | 0.7595 mL | |
| 50 mM | 0.0243 mL | 0.1215 mL | 0.2430 mL | 0.6076 mL | |
| 60 mM | 0.0203 mL | 0.1013 mL | 0.2025 mL | 0.5063 mL | |
| 80 mM | 0.0152 mL | 0.0759 mL | 0.1519 mL | 0.3797 mL | |
| 100 mM | 0.0122 mL | 0.0608 mL | 0.1215 mL | 0.3038 mL |


IBG1 Related Classifications
HY-153459 Related Classifications
 Powered by Bioz