



KT-474
Based on 3 publication(s) in Google Scholar
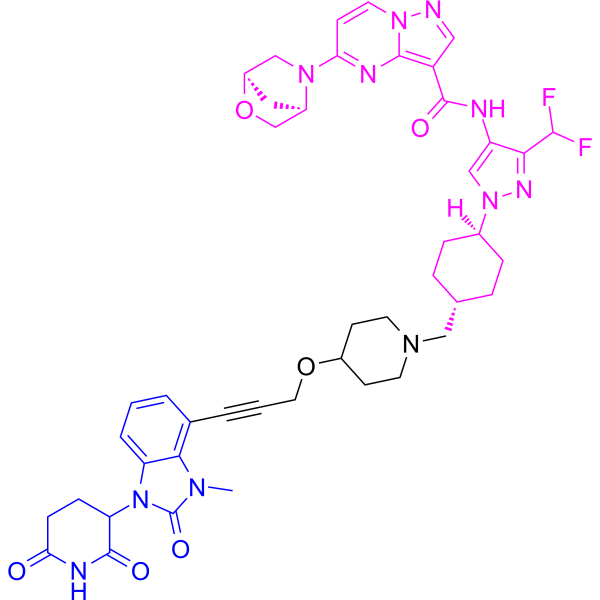
KT-474 (KYM-001; PROTAC IRAK4 degrader-7) is an orally active PROTAC IRAK4 degrader with anti-tumor effects. KT-474 inhibits the cell cycle and induces apoptosis. KT-474 induces tumor regression in a xenograft model of MYD88-mutated ABC DLBCL.
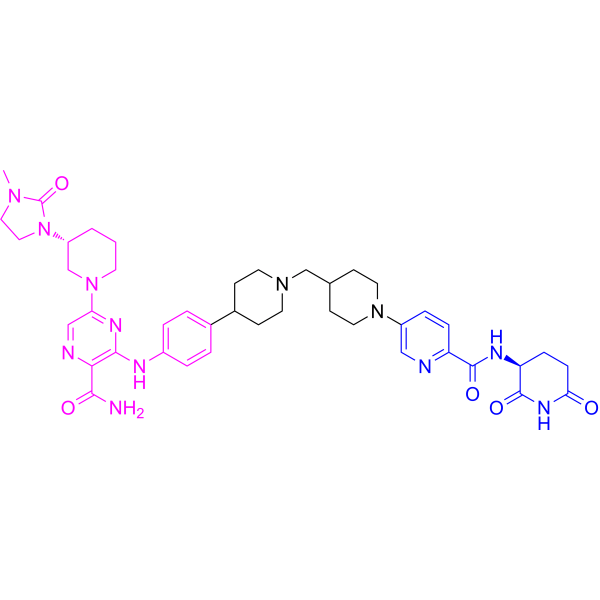
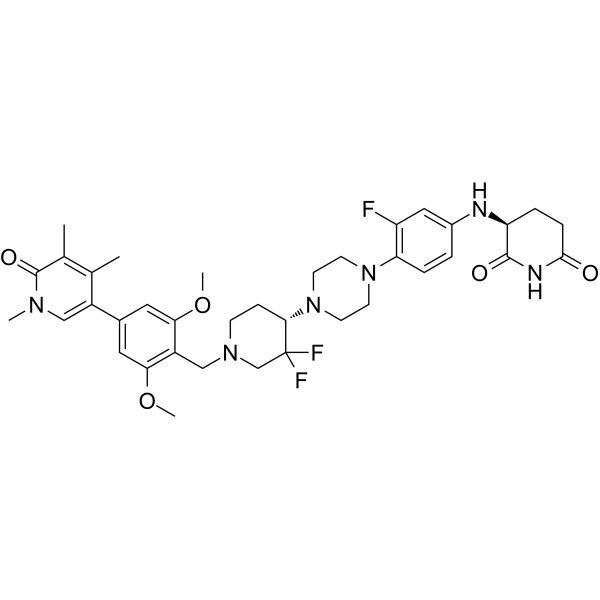
(Pink: IRAK4 ligand (HY-145484); Blue: Cereblon ligand (HY-45512); Black: linker).
Nur für Forschungszwecke. Wir verkaufen nicht an Patienten.
- Reinheit : 99.41%
- CAS. Nr.: 2432994-31-3
- Formel: C44H49F2N11O6
- Molecular Weight:865.93
-
Speicherung:Powder -20°C, 3 years ; In solvent -80°C, 6 months , -20°C, 1 month

To place orders, for customer services and technical support, please contact: MedChemExpress USA
Tel: 609-228-6898 E-mail: [email protected] [email protected]


-
 Biologische Aktivität
-
Chemical Information
-
Lösungsmittel & Löslichkeit
- Protokoll
- Reinheit & Dokumentation
- Verweise
-
 Help & FAQs


-
HY-19836
ZimlovisertibIRAK4 Inhibitor -
HY-130604
DT2216PROTAC BCL-XL Degrader -
HY-153342
LuxdegalutamidePROTAC -
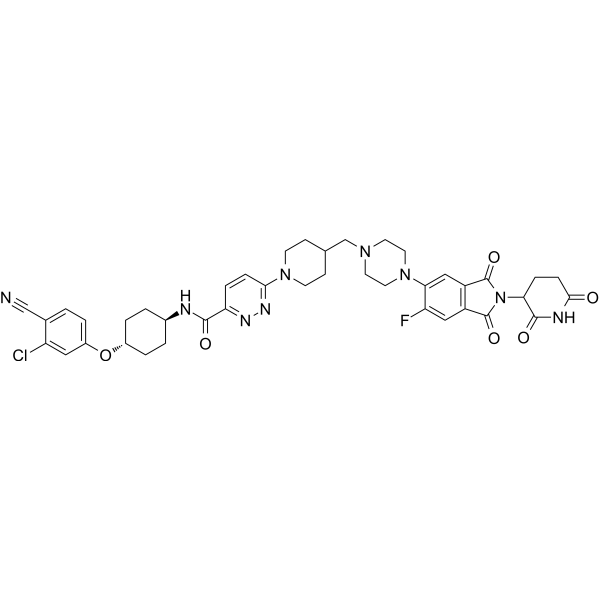
HY-138641
BavdegalutamideAR PROTAC Degrader -
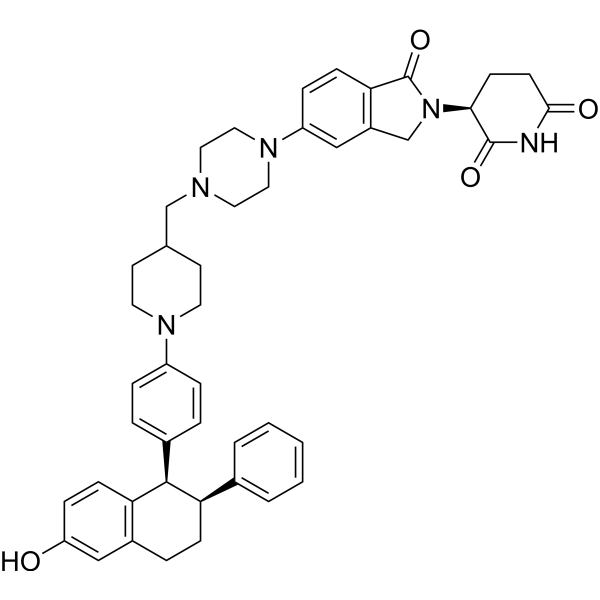
HY-138642
VepdegestrantPROTAC ER Degrader -
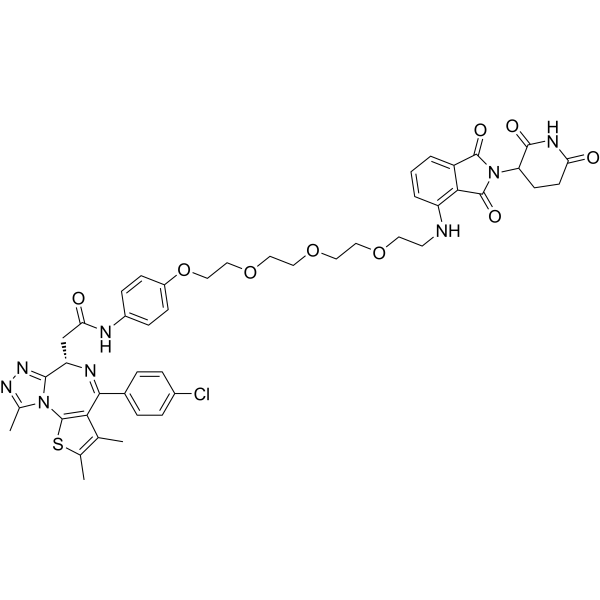
HY-16954
ARV-825PROTAC BRD2/BRD3/BRD4 Degrader -
HY-153321
BexobrutidegBTK Degrader -
HY-153367
FHD-609BRD9 PROTAC Degrader -
HY-158101
BMS-986365PROTAC AR Degrader -
HY-135317
EmavusertibIRAK4 Inhibitor -
HY-139374
ZabedosertibIRAK4 Inhibitor -
HY-145925B
CFT8634BRD9 PROTAC Degrader
Publications Citing Use of MedChemExpress (MCE) KT-474
MoreAlle PROTACs Isoform-spezifische Produkte anzeigen
More

Biologische Aktivität
Beschreibung
IC50 & Target
|
IRAK4 |
In Vitro
KT-474 (1-100 nM) inhibits Resiquimod (HY-13740)-induced and lipopolysaccharide (HY-D1056)-induced IL-6 and IL-8 production by PBMCs[2].
KT-474 (10-100 nM) inhibits NF-kB activation (phospho-p65) in CpG-B stimulated B cells[2].
KYM-001 (48-72 h) inhibits cell cycle and induces apoptosis in ABC DLBCL, with preferential activity in MYD88-mutant vs MYD88-WT cell lines[3].
MedChemExpress (MCE) has not independently confirmed the accuracy of these methods. They are for reference only.
In Vivo
MedChemExpress (MCE) has not independently confirmed the accuracy of these methods. They are for reference only.
- Detection of Apoptosis
- TUNEL staining for apoptotic DNA fragmentation
- Flow cytometric DNA-content cell-cycle staining
- Annexin V plus membrane-impermeant dye apoptosis staining
- BrdU Incorporation Assay
- Patient-Derived Xenograft (PDX)
- Apoptosis Solutions
- Protocol for Cell Cycle
- Splenic/Portal-Vein Liver Metastasis Xenograft
- Subcutaneous Cell-Line-Derived Xenograft
- Orthotopic Cell-Line Xenograft
- Intraperitoneal/Peritoneal Dissemination Xenograft


Chemical Information
-
CAS. Nr. 2432994-31-3
-
Appearance Solid
-
Molecular Weight 865.93
-
Formel C44H49F2N11O6
-
Color Off-white to yellow
-
SMILES
O=C1N(C(CCC2=O)C(N2)=O)C3=CC=CC(C#CCOC(CC4)CCN4C[C@H]5CC[C@@](N(N=C6C(F)F)C=C6NC(C7=C(N=C(N8[C@@H](CO9)C[C@@H]9C8)C=C%10)N%10N=C7)=O)([H])CC5)=C3N1C
-
Synonyms
KYM-001; PROTAC IRAK4 degrader-7
-
Versand
Room temperature in continental US; may vary elsewhere.
-
Speicherung
Powder -20°C 3 years In solvent -80°C 6 months -20°C 1 month


Publications (3)
-
Journal Impact Factor
-
Most Recent
-
Anal Chem
Hydrogen/Deuterium Exchange for Chiral Stability Assessment in Acidic Methine-Containing Compounds. [Abstract]2025 Dec 2;97(47):26097-26107. PMID: 41243541 -
-


Lösungsmittel & Löslichkeit
In Vitro:
DMSO : 100 mg/mL (115.48 mM; Need ultrasonic; Hygroscopic DMSO has a significant impact on the solubility of product, please use newly opened DMSO)
Please refer to the solubility information to select the appropriate solvent. Once prepared, please aliquot and store the solution to prevent product inactivation from repeated freeze-thaw cycles.
Storage method and period of stock solution: -80°C, 6 months; -20°C, 1 month. When stored at -80°C, please use it within 6 months. When stored at -20°C, please use it within 1 month.
Please refer to the solubility information to select the appropriate solvent. Once prepared, please aliquot and store the solution to prevent product inactivation from repeated freeze-thaw cycles.
Storage method and period of stock solution: -80°C, 6 months; -20°C, 1 month. When stored at -80°C, please use it within 6 months. When stored at -20°C, please use it within 1 month.
Konzentration (Stammlösung) × Volumen (Stammlösung) = Konzentration (Ziellösung) × Volumen (Ziellösung)
In Vivo:
Select the appropriate dissolution method based on your experimental animal and administration route.
- For the following dissolution methods, please ensure to first prepare a clear stock solution using an In Vitro approach and then sequentially add co-solvents:
- To ensure reliable experimental results, the clarified stock solution can be appropriately stored based on storage conditions. As for the working solution for In Vivo experiments, it is recommended to prepare freshly and use it on the same day.
- The percentages shown for the solvents indicate their volumetric ratio in the final prepared solution. If precipitation or phase separation occurs during preparation, heat and/or sonication can be used to aid dissolution.
Add each solvent one by one: 10% DMSO 40% PEG300 5% Tween-80 45% Saline
Solubility: ≥ 2.5 mg/mL (2.89 mM); Clear solution
This protocol yields a clear solution of ≥ 2.5 mg/mL (saturation unknown).
Taking 1 mL working solution as an example, add 100 μL DMSO stock solution (25.0 mg/mL) to 400 μL PEG300, and mix evenly; then add 50 μL Tween-80 and mix evenly; then add 450 μL Saline to adjust the volume to 1 mL.
Preparation of Saline: Dissolve 0.9 g sodium chloride in ddH₂O and dilute to 100 mL to obtain a clear Saline solution.
Add each solvent one by one: 10% DMSO 90% (20% SBE-β-CD in Saline)
Solubility: ≥ 2.5 mg/mL (2.89 mM); Clear solution
This protocol yields a clear solution of ≥ 2.5 mg/mL (saturation unknown).
Taking 1 mL working solution as an example, add 100 μL DMSO stock solution (25.0 mg/mL) to 900 μL 20% SBE-β-CD in Saline, and mix evenly.
Preparation of 20% SBE-β-CD in Saline (4°C, storage for one week): 2 g SBE-β-CD powder is dissolved in 10 mL Saline, completely dissolve until clear.
In Vivo Dissolution Calculator
Please enter the basic information of animal experiments:
-
-
-
-
Recommended: Prepare an additional quantity of animals to account for potential losses during experiments.
Please enter your animal formula composition:
-
%DMSO +
Recommended: Keep the proportion of DMSO in working solution below 2% if your animal is weak.
-
%+
-
+%Tween-80 + +
-
%Saline +
The co-solvents required include: DMSO, . All of co-solvents are available by MedChemExpress (MCE). , Tween 80. All of co-solvents are available by MedChemExpress (MCE).
Working solution concentration: 0.22 mg/mL
Method for preparing stock solution: mg drug dissolved in μL DMSO. Stock solution concentration: mg/mL.
1. Take μL DMSO stock solution;
2. Add μL .
μL , mix evenly;
3. Then add μL Tween 80, mix evenly;
4. Then add μL
Please ensure that the stock solution in the first step is dissolved to a clear state, and add co-solvents in sequence. You can use ultrasonic heating (ultrasonic cleaner, recommended frequency 20-40 kHz), vortexing, etc. to assist dissolution.


Reinheit & Dokumentation
-
Data Sheet (275 KB)
-
SDS (394 KB)
- English - EN (394 KB)
- Français - FR (394 KB)
- Deutsch - DE (394 KB)
- Norwegian - NO (394 KB)
- Español - ES (394 KB)
- Swedish - SV (394 KB)
- Italian - IT (394 KB)
- Korean - KR (394 KB)
- Portuguese - PT (394 KB)
-
Handling Instructions (2659 KB)
Verweise


Complete Stock Solution Preparation Table
Please refer to the solubility information to select the appropriate solvent. Once prepared, please aliquot and store the solution to prevent product inactivation from repeated freeze-thaw cycles.
Storage method and period of stock solution: -80°C, 6 months; -20°C, 1 month. When stored at -80°C, please use it within 6 months. When stored at -20°C, please use it within 1 month.
| Optional Solvent | Concentration Solvent Mass | 1 mg | 5 mg | 10 mg | 25 mg |
|---|---|---|---|---|---|
| DMSO | 1 mM | 1.1548 mL | 5.7741 mL | 11.5483 mL | 28.8707 mL |
| 5 mM | 0.2310 mL | 1.1548 mL | 2.3097 mL | 5.7741 mL | |
| 10 mM | 0.1155 mL | 0.5774 mL | 1.1548 mL | 2.8871 mL | |
| 15 mM | 0.0770 mL | 0.3849 mL | 0.7699 mL | 1.9247 mL | |
| 20 mM | 0.0577 mL | 0.2887 mL | 0.5774 mL | 1.4435 mL | |
| 25 mM | 0.0462 mL | 0.2310 mL | 0.4619 mL | 1.1548 mL | |
| 30 mM | 0.0385 mL | 0.1925 mL | 0.3849 mL | 0.9624 mL | |
| 40 mM | 0.0289 mL | 0.1444 mL | 0.2887 mL | 0.7218 mL | |
| 50 mM | 0.0231 mL | 0.1155 mL | 0.2310 mL | 0.5774 mL | |
| 60 mM | 0.0192 mL | 0.0962 mL | 0.1925 mL | 0.4812 mL | |
| 80 mM | 0.0144 mL | 0.0722 mL | 0.1444 mL | 0.3609 mL | |
| 100 mM | 0.0115 mL | 0.0577 mL | 0.1155 mL | 0.2887 mL |


KT-474 Related Classifications
HY-145483 Related Classifications
 Powered by Bioz