



Lactacystin
Based on 9 publication(s) in Google Scholar
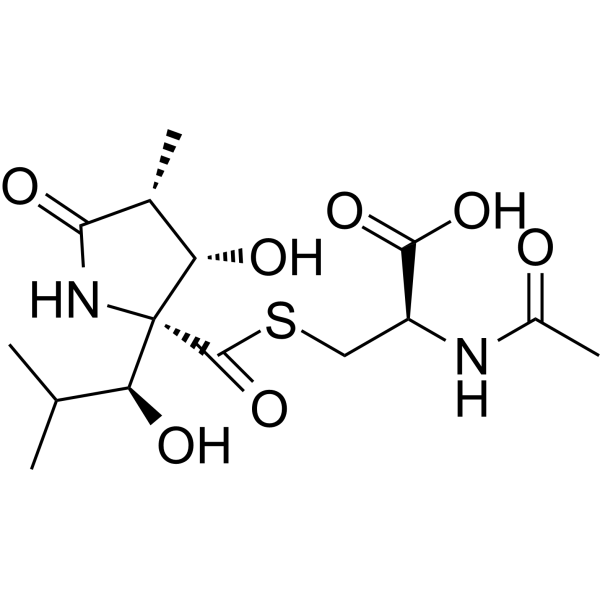
Lactacystin is a potent, orally active, irreversible, cell-permeable, selective 20S proteasome inhibitor (IC50 = 4.8 μM). Lactacystin also inhibits the lysosomal enzyme cathepsin A. Lactacystin inhibits cell growth and induces apoptosisand cell cycle arrest, and has antiviral and antioxidative activity. Lactacystin induces neurite outgrowth and hypertension. Lactacystin has the potential for the research of cancer, Neurological Disease, hypertension and Malaria, and so on[2] [6] .
For research use only. We do not sell to patients.
- Purity : 99.21%
- CAS No.: 133343-34-7
- Formula: C15H24N2O7S
- Molecular Weight:376.43
-
Storage:Powder -20°C, 3 years ; In solvent -80°C, 6 months , -20°C, 1 month

To place orders, for customer services and technical support, please contact: MedChemExpress USA
Tel: 609-228-6898 E-mail: [email protected] [email protected]


-
 Biological Activity
-
Chemical Information
-
Solvent & Solubility
- Protocols
- Purity & Documentation
- References
-
 Help & FAQs


-
HY-10227
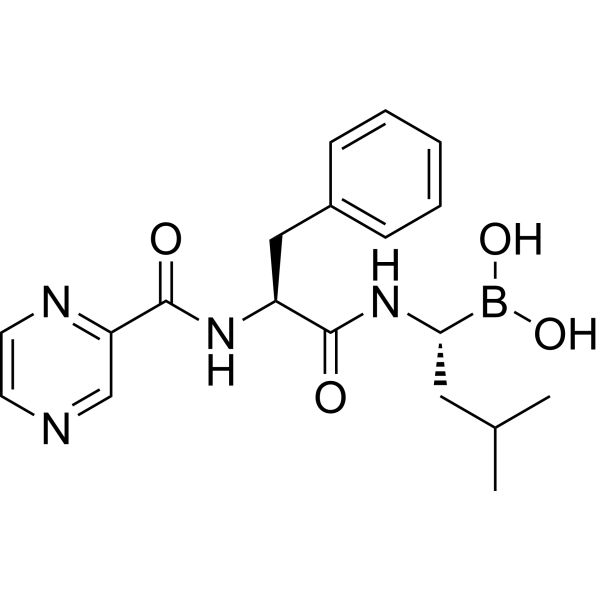
BortezomibProteasome Inhibitor -
HY-13259
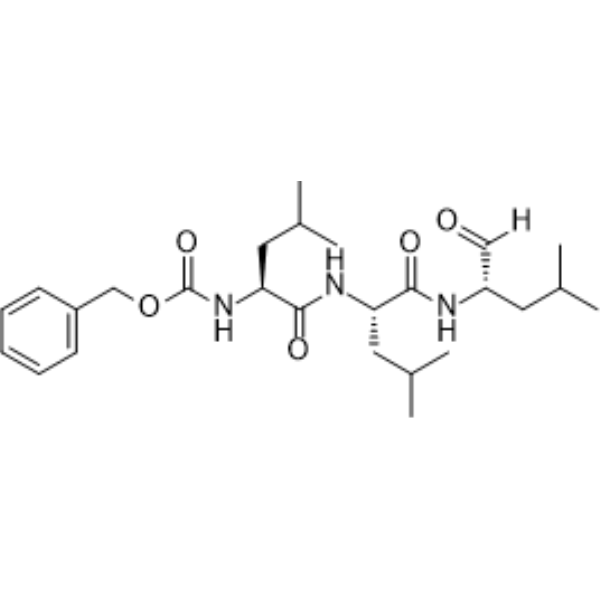
MG-132Proteasome Inhibitor -
HY-10455
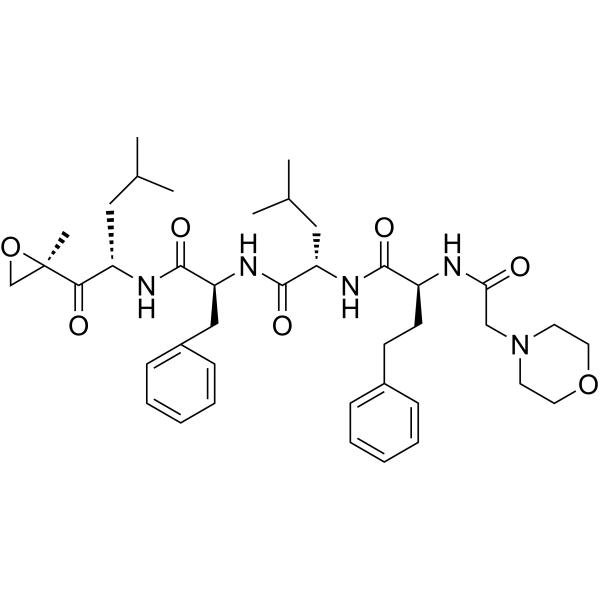
CarfilzomibProteasome Inhibitor -
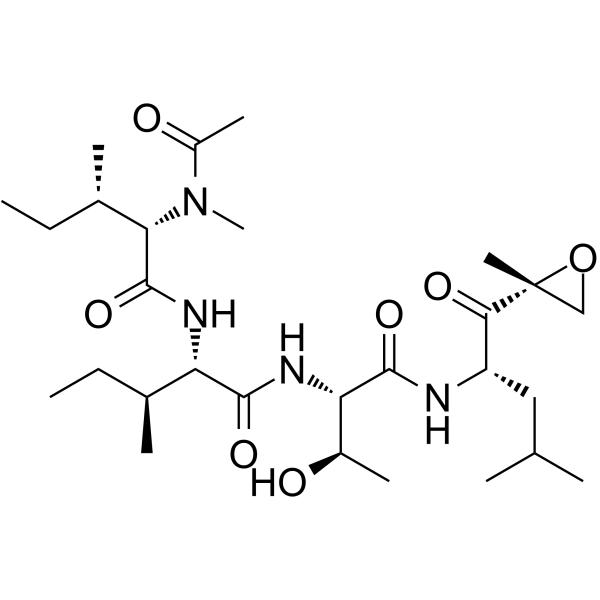
HY-13821
EpoxomicinProteasome Inhibitor -
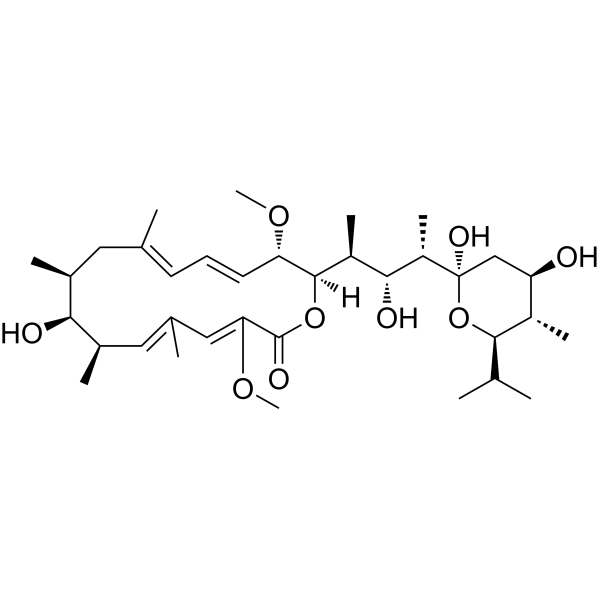
HY-100558
Bafilomycin A1V-ATPase Inhibitor -
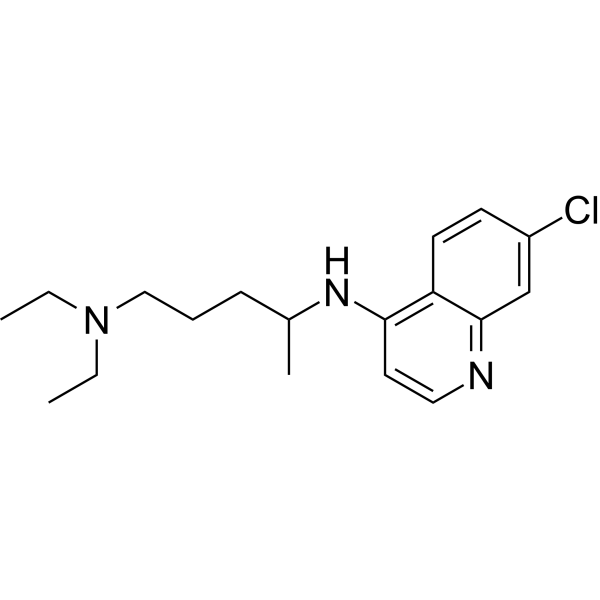
HY-17589A
ChloroquineAntimalarial Agent -
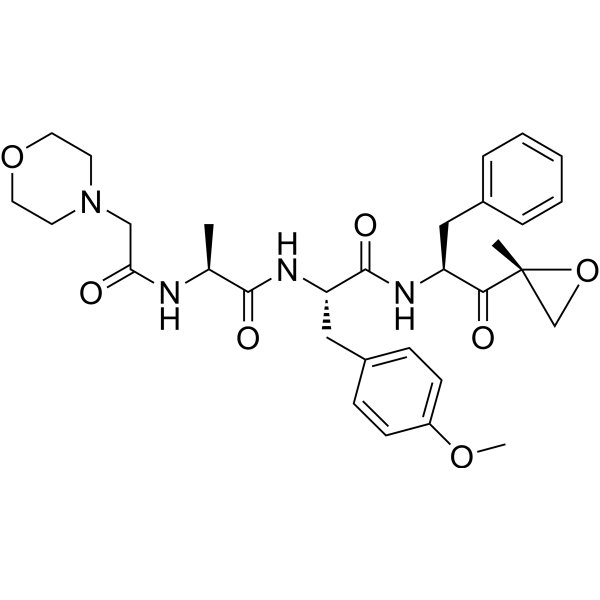
HY-13207
ONX-0914Proteasome Inhibitor -
HY-B1756
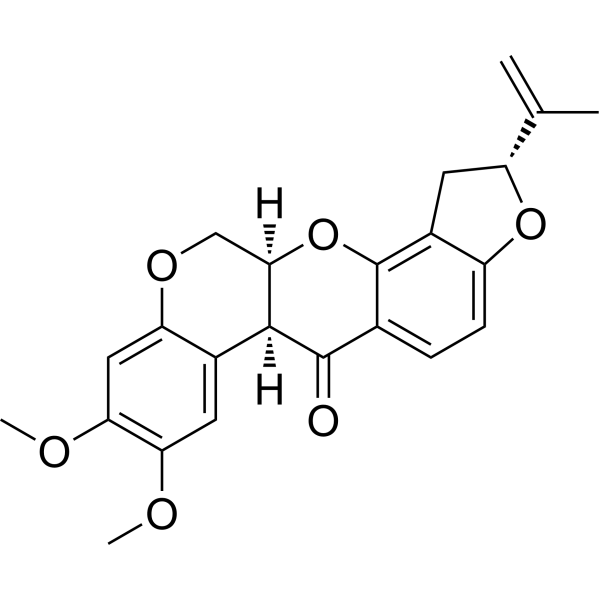
RotenoneMitochondrial Complex I Inhibitor -
HY-19312
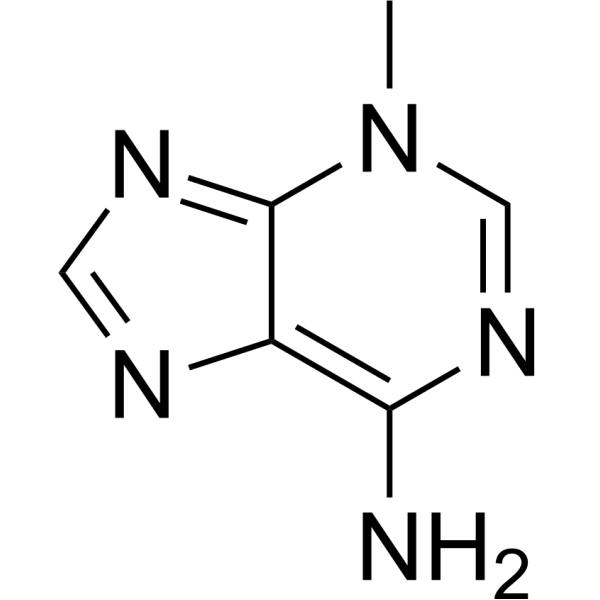
3-MethyladenineAutophagy/PI3K Inhibitor -
HY-10985
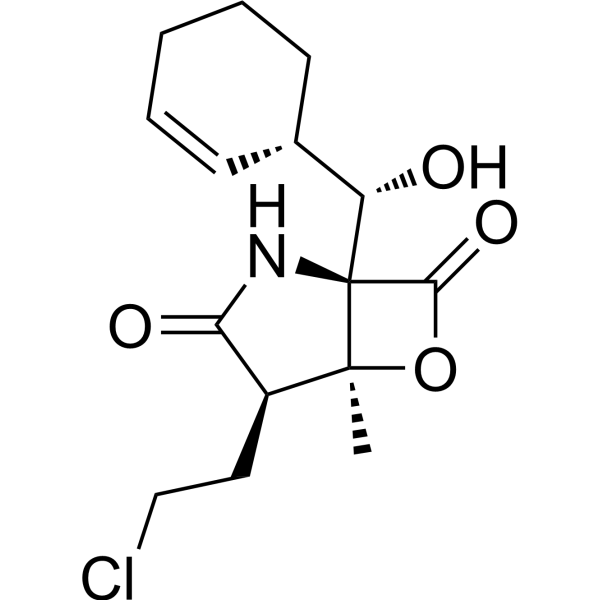
MarizomibProteasome Inhibitor -
HY-108552
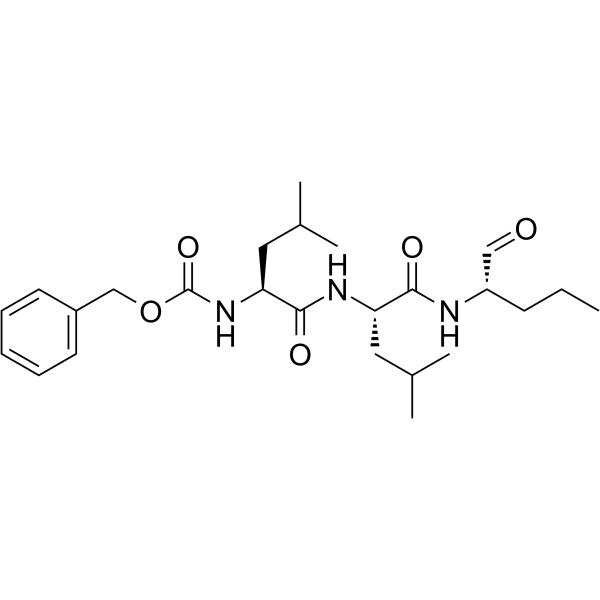
MG-115Proteasome Inhibitor -
HY-10453
IxazomibProteasome Inhibitor
Publications Citing Use of MedChemExpress (MCE) Lactacystin
More- Cell Mol Immunol. 2026 Apr;23(4):349-366. [Abstract]
- Autophagy. 2025 Sep;21(9):1945-1961. [Abstract]
- Adv Sci (Weinh). 2025 Jul 11:e05479. [Abstract]
- Cell Death Dis. 2024 Sep 6;15(9):655. [Abstract]
- Cell Mol Gastroenterol Hepatol. 2023;15(2):307-325. [Abstract]
- iScience. 2023 Feb 27;26(3):106271. [Abstract]
- Curr Issues Mol Biol. 2026 Aug 2;48(8):788.
- Vet Microbiol. 2025 Aug:307:110602. [Abstract]
- bioRxiv. 2026 Mar 26.
 Customer Validation & Images

-
WB
-
WB
-
WB
-
WB
-
WB
All Cathepsin Isoforms
More

Biological Activity
Description
IC50 & Target
IC50: 4.8 μM (proteasome)[1]
Cellular Effect
|
Cell Line

|
Type | Value | Description | References |
|---|---|---|---|---|
| DLD-1 | IC50 |
0.07 μM
Compound: Lactacystin
|
Inhibition of chymotrypsin-like activity of 20S proteasome in human DLD1 cells transfected with 4Ub-Luc gene using Succinyl-Leu-Leu-Val-Tyr-AMC as substrate after 6 hrs by spectrofluorometric analysis
Inhibition of chymotrypsin-like activity of 20S proteasome in human DLD1 cells transfected with 4Ub-Luc gene using Succinyl-Leu-Leu-Val-Tyr-AMC as substrate after 6 hrs by spectrofluorometric analysis
|
[PMID: 22206869] |
| DLD-1 | IC50 |
0.3 μM
Compound: Lactacystin
|
Inhibition of peptide-glutamyl-peptide-hydrolyzing activity of 20S proteasome in human DLD1 cells transfected with 4Ub-Luc gene using Z-Leu-Leu-Glu-AMC as substrate after 6 hrs by spectrofluorometric analysis
Inhibition of peptide-glutamyl-peptide-hydrolyzing activity of 20S proteasome in human DLD1 cells transfected with 4Ub-Luc gene using Z-Leu-Leu-Glu-AMC as substrate after 6 hrs by spectrofluorometric analysis
|
[PMID: 22206869] |
| MDA-MB-468 | IC50 |
0.37 μM
Compound: Lactacystin
|
Inhibition of chymotrypsin-like activity of proteasome beta5 subunit in human MDA-MB-468 cells using Suc-Leu-Leu-Val-Tyr-AMC as substrate after 2 hrs by fluorescence assay
Inhibition of chymotrypsin-like activity of proteasome beta5 subunit in human MDA-MB-468 cells using Suc-Leu-Leu-Val-Tyr-AMC as substrate after 2 hrs by fluorescence assay
|
[PMID: 23547706] |
| NCI-H23 | IC50 |
5.23 μM
Compound: Lactacystin
|
Cytotoxicity against human NCI-H23 cells after 72 hrs by CellTiter 96 AQueous one solution cell proliferation assay
Cytotoxicity against human NCI-H23 cells after 72 hrs by CellTiter 96 AQueous one solution cell proliferation assay
|
[PMID: 30964987] |
| NCI-H727 | IC50 |
>100 μM
Compound: Lactacystin
|
Cytotoxicity against human NCI-H727 cells after 72 hrs by CellTiter 96 AQueous one solution cell proliferation assay
Cytotoxicity against human NCI-H727 cells after 72 hrs by CellTiter 96 AQueous one solution cell proliferation assay
|
[PMID: 30964987] |
| U-251 | IC50 |
3481 nM
Compound: 4
|
Inhibition of SAP130 in VEGF-stimulated human U251 cells by PLAP reporter gene assay
Inhibition of SAP130 in VEGF-stimulated human U251 cells by PLAP reporter gene assay
|
[PMID: 17643112] |
| WiDr | IC50 |
>10000 nM
Compound: 4
|
Inhibition of SAP130 mediated cell growth in human WiDr cells
Inhibition of SAP130 mediated cell growth in human WiDr cells
|
[PMID: 17643112] |
In Vitro
Lactacystin (up to 25.6 µM, 1 h) has no cytotoxicity to HeLa or SH-SY5Y cells, and decreases RVP infection by 63.8% in HeLa and by 74.5% in SH-SY5Y cells[2].
Lactacystin (2.5 μM) in combination with Parthenolide (HY-N0141) (5 μM) causes a synergistic increase in the apoptotic fraction of the drug-resistant L1210 cells[3].
Lactacystin (2.5, 5 and 10 µM, 24 h) inhibits the proliferation (IC50 value of 10 μ M) and increases the apoptotic in C6 cells[4].
Lactacystin (10 μM, 24 h) increases Cisplatin (HY-17394)-induced ER stress-associated apoptosis in Hela cells[5].
Lactacystin (7.5 μM, 4-48 h) increased reactive oxygen species and GSH levels in HT-29 cells[6].
Lactacystin (1, 2.5, 5 μM, 24 h) induces stellation in astrocytes from neonatal rat cortex[7].
Lactacystin (10μM, 8-24 h) induces apoptosis, G2/M cell cycle arrest in the PC12 cells[10].
MedChemExpress (MCE) has not independently confirmed the accuracy of these methods. They are for reference only.
-
Cell Line:C6 cells
-
Concentration:0, 2.5, 5, 10 µM
-
Incubation Time:24 h
-
Result:Suppressed cell growth and viability to 28.9%, and increased the apoptotic in C6 cells.
-
Cell Line:PC12
-
Concentration:5, 10, 20 µM
-
Incubation Time:24 h
-
Result:Declined cell viability in a concentration-dependent manner (79.47% at 5 mM, 49.31% at 10 μM and 31.20% at 20 μM.
-
Cell Line:PC12
-
Concentration:10 μM
-
Incubation Time:4, 8, 16, 24h
-
Result:Increased significantly apoptotic in a time-dependent manner from 8 to 24 h (14.10% at 8 h, 24.90% at 16 h and 39.41% at 24 h).
-
Cell Line:PC12
-
Concentration:10 μM
-
Incubation Time:4, 8, 16, 24h
-
Result:Reduced in the number of cells in the G2-phase (from 17.45% to 30.94%, 31.80% and 32.18%, respectively.) of the cell cycle for 8, 16 and 24h.
-
Cell Line:C6 cells, HT-29 cells
-
Concentration:0, 2.5, 5, and 10 µM (C6 cells), 7.5 μM in HT-29 cells
-
Incubation Time:24-48 h
-
Result:Increased the mRNA in the ratio of Bax to Bcl-2 in C6cells.
Increased the expression of GGT, GCLC, xCT and Nrf2 in HT-29 cells.
In Vivo
Please do not refer to only one article to determine the experimental conditions. It is recommended to determine the optimal experimental conditions (animal strain, age, dosage, frequency and cycle, detection time and indicators, etc.) through preliminary experiments before the formal experiment.
Lactacystin (2 μg for ICV) induces a Parkinson’s disease-like motor phenotype 5-7 days after injection in young and adult mice[8].
Lactacystin (1.0 ug or 5.0? μg/20g for 7days) results in significantly smaller tumor and promotes apoptosis than control in C6 orthotopic xenograft tumor models[4].
Lactacystin (5 mg/kg/day, dissolved in drinking water, six weeks) induces model of hypertension in male adult Wistar rats[9].
MedChemExpress (MCE) has not independently confirmed the accuracy of these methods. They are for reference only.
-
Animal Model:Male C57Bl/6RccHsd mice with 8-9 weeks (young) and 12-14 months (adult) old[2]
-
Dosage:2 µg
-
Administration:Microinjection
-
Result:Induced a Parkinson’s disease-like motor phenotype 5-7 days after injection in young and adult mice.
-
Animal Model:Male C57Bl/6RccHsd mice[8]
-
Dosage:2 μg, 7days
-
Administration:Intracerebroventricular injection (ICV)
-
Result:Induced spontaneous contralateral rotating behavior.
-
Animal Model:C6 orthotopic xenograft tumor models[4]
-
Dosage:1.0 µg or 5.0 µg/20g for 7days
-
Administration:Intravenous injection (i.p.)
-
Result:Reduced the tumor volume.
Showed polygonal condensed nuclei with brown Tunnel staining indicating apoptosis in tumor tissue.
Increased the mRNA and protein level in the ratio of Bax to Bcl-2 in tumor tissue.
- Research Protocol for Infectious Diseases
- BrdU Incorporation Assay
- Somatic Cell Culture
- CCK-8/WST-8 Cell Proliferation Assay
- Protocol for Cell Cycle
- Cell differentiation
- Research Protocol for Cardiovascular Diseases
- Cell Counting-Based Growth Curve Assay
- PC12 NGF-induced neuronal-like differentiation
- Research Protocol for Neurological Diseases
- Cell Viability Determination by MTT Colorimetric Assay
- PC12 NGF-Induced Neuronal Differentiation Culture
- Flow cytometric DNA-content cell-cycle staining
- SH-SY5Y Neuronal Differentiation Culture
- Protocol for Cell Counting and Cell Density Analysis
- SH-SY5Y neuronal-like differentiation
- Lysosome and acidic-vesicle live-cell staining
- MTT Cell Proliferation Assay


Chemical Information
-
CAS No. 133343-34-7
-
Appearance Solid
-
Molecular Weight 376.43
-
Formula C15H24N2O7S
-
Color White to off-white
-
SMILES
O=C(O)[C@H](CSC([C@]([C@@H](O)[C@H]1C)([C@@H](O)C(C)C)NC1=O)=O)NC(C)=O
-
Structure Classification
-
Initial Source
Streptomyces OM-6519
-
Shipping
Room temperature in continental US; may vary elsewhere.
-
Storage
Powder -20°C 3 years In solvent -80°C 6 months -20°C 1 month


Publications (9)
-
Journal Impact Factor
-
Most Recent
-
Cell Mol Immunol
Oncolytic virus M1 reinvigorates CD8+ T-cell immunity against glioblastoma through B-cell-dependent antigen cross-presentation in the spleen. [Abstract]2026 Apr;23(4):349-366. PMID: 41781696 -
Autophagy
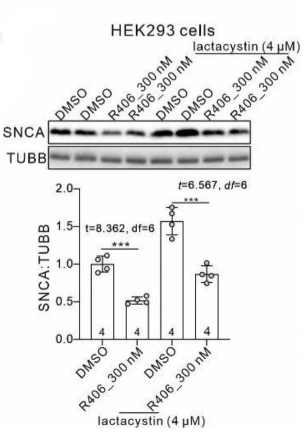
R406 and its structural analogs reduce SNCA/α-synuclein levels via autophagic degradation. [Abstract]2025 Sep;21(9):1945-1961. PMID: 40143425
Lactacystin purchased from MedChemExpress. Usage Cited in: Autophagy. 2025 Sep;21(9):1945-1961. [Abstract]
Representative western blots and quantifications of SNCA in R406-treated cultured primary neurons with or without the proteasome inhibitor Lactacystin (4 μM; 24 h) in HEK293 cells.
-
Adv Sci (Weinh)
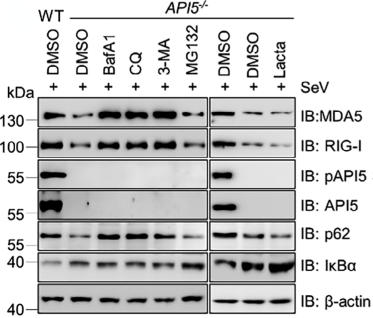
API5 Phosphorylation Promotes Antiviral Immunity by Inhibiting Degradation of Cytosolic RNA Sensor RLRs. [Abstract]2025 Jul 11:e05479. PMID: 40641422
Lactacystin purchased from MedChemExpress. Usage Cited in: Adv Sci (Weinh). 2025 Jul 11:e05479. [Abstract]
Immunoblot analysis of extracts of API5−/− A549 cells treated with bafilomycin A1 (BafA1; 200 nm), chloroquine (CQ; 50 μM), 3-methyladenine (3-MA; 10 mm), MG132 (10 μM) or Lactacystin (Lacta; 10 μm) for 6 h followed by infected with SeV for 12 h.
-
Cell Death Dis
2024 Sep 6;15(9):655. PMID: 39242574
Lactacystin purchased from MedChemExpress. Usage Cited in: Cell Death Dis. 2024 Sep 6;15(9):655. [Abstract]
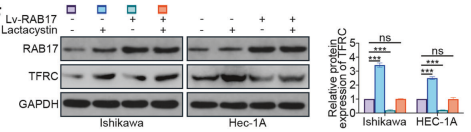
Ishikawa and HEC-1A cells were transfected with Lv-NC or Lv-RAB17. The cells were then treated with the Lactacystin proteasome inhibitor (10 mmol) for 12 h, and Western blot analysis was performed with anti-RAB17 and anti-TFRC antibodies.
-
Cell Mol Gastroenterol Hepatol
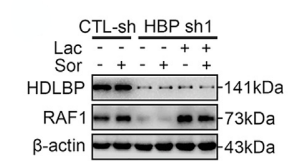
HDLBP promotes hepatocellular carcinoma proliferation and sorafenib resistance by suppressing Trim71-dependent RAF1 degradation. [Abstract]2023;15(2):307-325. PMID: 36244648
Lactacystin purchased from MedChemExpress. Usage Cited in: Cell Mol Gastroenterol Hepatol. 2023;15(2):307-325. [Abstract]
Huh7 cells were transfected with CTL-sh or HBP sh1 for 24 hours. Then, the cells were treated with 1 mmol sorafenib and Lactacystin (Lac, 10 mmol) for 12 hours, and immunoblotting was performed with anti-RAF1 and anti-HDLBP antibodies.
-
iScience
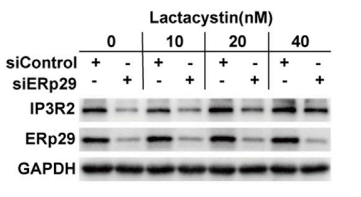
Non-canonical function of DPP4 promotes cognitive impairment through ERp29-associated mitochondrial calcium overload in diabetes. [Abstract]2023 Feb 27;26(3):106271. PMID: 36936785
Lactacystin purchased from MedChemExpress. Usage Cited in: iScience. 2023 Feb 27;26(3):106271. [Abstract]
Western blot analysis for IP3R2 and ERp29 in primary hippocampal neurons transfected with control siRNA (siControl) or ERp29 siRNA for 48h and treated with Lactacystin (0, 10, 20, 40 nM; 48 h) at the indicated dose.
-
-
Vet Microbiol
The ubiquitin-proteasome system is essential for efficient propagation of Pseudorabies virus. [Abstract]2025 Aug:307:110602. PMID: 40517584 -


Solvent & Solubility
In Vitro:
DMSO : 20 mg/mL (53.13 mM; Need ultrasonic and warming; Hygroscopic DMSO has a significant impact on the solubility of product, please use newly opened DMSO)
Please refer to the solubility information to select the appropriate solvent. Once prepared, please aliquot and store the solution to prevent product inactivation from repeated freeze-thaw cycles.
Storage method and period of stock solution: -80°C, 6 months; -20°C, 1 month. When stored at -80°C, please use it within 6 months. When stored at -20°C, please use it within 1 month.
Please refer to the solubility information to select the appropriate solvent. Once prepared, please aliquot and store the solution to prevent product inactivation from repeated freeze-thaw cycles.
Storage method and period of stock solution: -80°C, 6 months; -20°C, 1 month. When stored at -80°C, please use it within 6 months. When stored at -20°C, please use it within 1 month.
Concentration (start) × Volume (start) = Concentration (final) × Volume (final)


Purity & Documentation
-
Data Sheet (292 KB)
-
SDS (252 KB)
- English - EN (252 KB)
- Français - FR (252 KB)
- Deutsch - DE (252 KB)
- Norwegian - NO (252 KB)
- Español - ES (252 KB)
- Swedish - SV (252 KB)
- Italian - IT (252 KB)
- Korean - KR (252 KB)
- Portuguese - PT (252 KB)
-
Handling Instructions (2659 KB)
References
[1]. Csizmadia V, et al. Effect of proteasome inhibitors with different chemical structures on the ubiquitin-proteasomesystem in vitro. Vet Pathol. 2010 Mar;47(2):358-67. [Content Brief]
[2]. Shaobo Wang, et al. The ubiquitin-proteasome system is essential for the productive entry of Japanese encephalitis virus. Virology. 2016 Nov;498:116-127. [Content Brief]
[3]. Ann H Cory, et al. Lactacystin, a proteasome inhibitor, potentiates the apoptotic effect of parthenolide, an inhibitor of NFkappaB activation, on drug-resistant mouse leukemia L1210 cells. Anticancer Res 2002 Nov-Dec;22(6C):3805-9. [Content Brief]
[4]. Haifeng Wang, et al. The proteasome inhibitor lactacystin exerts its therapeutic effects on glioma via apoptosis: an in vitro and in vivo study. J Int Med Res. 2013 Feb;41(1):72-81. [Content Brief]
[5]. Ye Xu, et al. Proteasome inhibitor lactacystin enhances cisplatin cytotoxicity by increasing endoplasmic reticulum stress-associated apoptosis in HeLa cells. Mol Med Rep. 2015 Jan;11(1):189-95. [Content Brief]
[6]. Nils-Erik Huseby, et al. The proteasome inhibitor lactacystin enhances GSH synthesis capacity by increased expression of antioxidant components in an Nrf2-independent, but p38 MAPK-dependent manner in rat colorectal carcinoma cells. Free Radic Res. 2016;50(1):1-13. https://pubmed.ncbi.nlm.nih.gov/26530909/ [Content Brief]
[7]. Qing-Guo Ren, et al. Lactacystin stimulates stellation of cultured rat cortical astrocytes. Neurochem Res. 2009 May;34(5):859-66. [Content Brief]
[8]. Savolainen MH, et al. Nigral injection of a proteasomal inhibitor, lactacystin, induces widespread glial cell activationand shows various phenotypes of Parkinson's disease in young and adult mouse. Exp Brain Res. 2017 Jul;235(7):2189-2202. [Content Brief]
[9]. Fedor Simko, et al. Lactacystin-Induced Model of Hypertension in Rats: Effects of Melatonin and Captopril. Int J Mol Sci. 2017 Jul 25;18(8):1612. [Content Brief]
[10]. Zhentao Zhang, et al. Cell cycle events mediate lactacystin-induced apoptotic death of neuronal PC12 cells. Cell Biol Int. 2010 Dec;34(12):1181-7. [Content Brief]


Complete Stock Solution Preparation Table
Please refer to the solubility information to select the appropriate solvent. Once prepared, please aliquot and store the solution to prevent product inactivation from repeated freeze-thaw cycles.
Storage method and period of stock solution: -80°C, 6 months; -20°C, 1 month. When stored at -80°C, please use it within 6 months. When stored at -20°C, please use it within 1 month.
| Optional Solvent | Concentration Solvent Mass | 1 mg | 5 mg | 10 mg | 25 mg |
|---|---|---|---|---|---|
| DMSO | 1 mM | 2.6565 mL | 13.2827 mL | 26.5654 mL | 66.4134 mL |
| 5 mM | 0.5313 mL | 2.6565 mL | 5.3131 mL | 13.2827 mL | |
| 10 mM | 0.2657 mL | 1.3283 mL | 2.6565 mL | 6.6413 mL | |
| 15 mM | 0.1771 mL | 0.8855 mL | 1.7710 mL | 4.4276 mL | |
| 20 mM | 0.1328 mL | 0.6641 mL | 1.3283 mL | 3.3207 mL | |
| 25 mM | 0.1063 mL | 0.5313 mL | 1.0626 mL | 2.6565 mL | |
| 30 mM | 0.0886 mL | 0.4428 mL | 0.8855 mL | 2.2138 mL | |
| 40 mM | 0.0664 mL | 0.3321 mL | 0.6641 mL | 1.6603 mL | |
| 50 mM | 0.0531 mL | 0.2657 mL | 0.5313 mL | 1.3283 mL |


Lactacystin Related Classifications
HY-16594 Related Classifications
 Powered by Bioz