



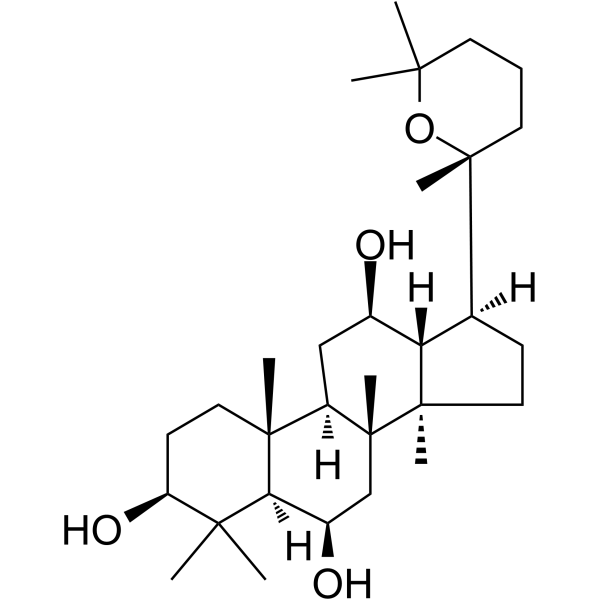
Panaxatriol
Based on 3 publication(s) in Google Scholar
Panaxatriol is an orally active dammarane-type tetracyclic triterpene sapogenin. Panaxatriol enhances the phosphorylation levels of Akt, insulin receptor and p70S6K in skeletal muscle. Panaxatriol reduces the mRNA expression level of Atrogin1 in skeletal muscle. Panaxatriol induces apoptosis, pre-G1 cell cycle arrest and increased intracellular ROS levels in prostate cancer cells, decreases mitochondrial membrane potential, inhibits cell migration and reduces colony formation. Panaxatriol can be used in research related to insulin resistance, myocardial ischemia/reperfusion injury and prostate cancer[1][2][3].
For research use only. We do not sell to patients.
- Purity : 99.93%
- CAS No.: 32791-84-7
- Formula: C30H52O4
- Molecular Weight:476.73
-
Storage:Powder -20°C, 3 years , 4°C, 2 years ; In solvent -80°C, 2 years , -20°C, 1 year

To place orders, for customer services and technical support, please contact: MedChemExpress USA
Tel: 609-228-6898 E-mail: [email protected] [email protected]


-
 Biological Activity
-
Chemical Information
-
Solvent & Solubility
- Protocols
- Purity & Documentation
- References
-
 Help & FAQs



Publications Citing Use of MedChemExpress (MCE) Panaxatriol
More Customer Validation & Images

-
RT-PCR

-
WB

-
Histological Imaging/Staining

-
Cell Imaging/Staining

-
In Vivo Efficacy Study


Biological Activity
Description
In Vitro
Panaxatriol (15-60 μM; 48-72 h) exhibits concentration-dependent cytotoxicity against DU-15 human prostate cancer cells, with an IC50 of 30 μM[3].
Panaxatriol (15-60 μM; 6 days) concentration-dependently suppresses colony formation by DU-15 human prostate cancer cells[3].
Panaxatriol (15-60 μM; 48 h) concentration-dependently induces apoptosis in DU-15 human prostate cancer cells, as detected by DAPI staining[3].
Panaxatriol (15-60 μM; 72 h) concentration-dependently increases intracellular ROS production in DU-15 human prostate cancer cells[3].
Panaxatriol (15-60 μM; 72 h) concentration-dependently reduces mitochondrial membrane potential in DU-15 human prostate cancer cells[3].
Panaxatriol (15-60 μM; 24 h) concentration-dependently induces sub-G1 cell cycle arrest in DU-15 human prostate cancer cells, with 24.8% of cells arrested at 60 μM[3].
Panaxatriol (30 μM; 48 h) inhibits the migration of DU-15 human prostate cancer cells in an in vitro wound healing assay[3].
MedChemExpress (MCE) has not independently confirmed the accuracy of these methods. They are for reference only. Further protocols information, click here.
-
Cell Line:DU-15 human prostate cancer cells
-
Concentration:10 μM; 15 μM; 30 μM; 50 μM; 100 μM
-
Incubation Time:48 h; 72 h
-
Result:Exerted concentration-dependent cytotoxic effects on DU-15 cells, with an IC50 of 30 μM.
-
Cell Line:DU-15 human prostate cancer cells
-
Concentration:15 μM; 30 μM; 60 μM
-
Incubation Time:24 h
-
Result:Induced sub-G1 cell cycle arrest in a concentration-dependent manner, with sub-G1 cell fractions reaching 10.4% at 15 μM, 17.3% at 30 μM, and 24.8% at 60 μM.
-
Cell Line:DU-15 human prostate cancer cells
-
Concentration:30 μM
-
Incubation Time:48 h
-
Result:Suppressed the migratory capability of DU-15 cells.
In Vivo
Pretreatment with panaxatriol (5 mg/kg; p.o.; daily; 7 days) markedly ameliorates ischemia/reperfusion-induced myocardial damage in isolated rat hearts, as demonstrated by preserved cardiac contractile function, reduced myocardial enzyme leakage, attenuated oxidative stress, and delayed time to contracture[2].
MedChemExpress (MCE) has not independently confirmed the accuracy of these methods. They are for reference only.
-
Animal Model:KK-Ay/Ta Jcl (KKAy) (6-week-old male, spontaneous insulin-resistant model)[1]
-
Dosage:0.2% (in standard diet)
-
Administration:p.o.; daily; 6 weeks
-
Result:Significantly reduced blood glucose.
Increased soleus muscle Akt phosphorylation to 1.5 arbitrary units (AU), normalized to GAPDH.
Increased p70S6K phosphorylation to 1.5 AU, normalized to GAPDH.
Reduced Atrogin1 mRNA expression levels.
Reduced HOMA-R to 10.3 when combined with aerobic exercise.
Increased soleus muscle mass to 16.3 mg.
Increased soleus myofiber cross-sectional area (CSA) significantly higher than exercise alone when combined with aerobic exercise.
Increased Akt phosphorylation to 2.3 AU when combined with aerobic exercise.
-
Animal Model:Sprague-Dawley (male, 250-300 g, myocardial ischemia/reperfusion injury model via 30 min global ischemia + 30 min reperfusion after 7-day pretreatment)[2]
-
Dosage:5 mg/kg
-
Administration:p.o.; once daily; 7 consecutive days
-
Result:Increased post-reperfusion left ventricular developed pressure to 68.1 mmHg.
Reached a post-reperfusion double product of 12.8.
Significantly increased time to contracture compared with the vehicle-treated group.
Significantly lowered malondialdehyde (MDA) levels compared with the vehicle-treated group.
Significantly elevated reduced glutathione (GSH) levels compared with the vehicle-treated group.


Chemical Information
-
CAS No. 32791-84-7
-
Appearance Solid
-
Molecular Weight 476.73
-
Formula C30H52O4
-
Color White to off-white
-
SMILES
C[C@@]1(CC[C@@H]2O)[C@](C[C@H]3O)([H])[C@](C[C@@H](O)[C@@]1([H])C2(C)C)(C)[C@@]4(C)[C@@]3([H])[C@]([C@](CCC5)(C)OC5(C)C)([H])CC4
-
Structure Classification
-
Initial Source
-
Shipping
Room temperature in continental US; may vary elsewhere.
-
Storage
Powder -20°C 3 years 4°C 2 years In solvent -80°C 2 years -20°C 1 year


Publications (3)
-
Journal Impact Factor
-
Most Recent
-
J Adv Res
Panaxatriol exerts anti-senescence effects and alleviates osteoarthritis and cartilage repair fibrosis by targeting UFL1. [Abstract]2025 Aug:74:493-511. PMID: 39442872
Panaxatriol purchased from MedChemExpress. Usage Cited in: J Adv Res. 2025 Aug:74:493-511. [Abstract]
qRT-PCR was used to detect the mRNA level of anabolism markers (SOX9, COL2, ACAN) and catabolism markers (MMP13, ADAMTS-4, COL10) treated with Panaxatriol (1, 5, 10 μM) for 7 days.
Panaxatriol purchased from MedChemExpress. Usage Cited in: J Adv Res. 2025 Aug:74:493-511. [Abstract]
Western blot was used to detect the protein level of COL2, ACAN and MMP13 treated with Panaxatriol (1, 5, 10 μM) for 7 days.
Panaxatriol purchased from MedChemExpress. Usage Cited in: J Adv Res. 2025 Aug:74:493-511. [Abstract]
Representative images of H&E stained, safranin O/Fast green stained and immunofluorescence stained sections of human cartilage explants treated with Panaxatriol (1, 5, 10 μM) for 7 days.
Panaxatriol purchased from MedChemExpress. Usage Cited in: J Adv Res. 2025 Aug:74:493-511. [Abstract]
Representative images of SA-beta-gal staining C28/I2 cells treated with 10 ng/mL IL-1β or a series concentration of Panaxatriol (1, 5, 10 μM) for 2 days.
Panaxatriol purchased from MedChemExpress. Usage Cited in: J Adv Res. 2025 Aug:74:493-511. [Abstract]
Three-dimensional micro-CT images of subchondral bone in the groups treated with Panaxatriol (20 μM, intraarticular injection).
-
Acta Pharmacol Sin
Ginsenoside (20)S-APPT induces ferroptosis in hepatocellular carcinoma and cholangiocarcinoma by targeting FSP1. [Abstract]2025 Jun 23. PMID: 40550962 -
Planta Med
Discovery and characterization of panaxatriol as a novel thrombin inhibitor from Panax notoginseng using combination of computational and experimental approach. [Abstract]2024 Aug;90(10):801-809. PMID: 38838717


Solvent & Solubility
In Vitro:
DMSO : 25 mg/mL (52.44 mM; Need ultrasonic; Hygroscopic DMSO has a significant impact on the solubility of product, please use newly opened DMSO)
Please refer to the solubility information to select the appropriate solvent. Once prepared, please aliquot and store the solution to prevent product inactivation from repeated freeze-thaw cycles.
Storage method and period of stock solution: -80°C, 2 years; -20°C, 1 year. When stored at -80°C, please use it within 2 years. When stored at -20°C, please use it within 1 year.
Please refer to the solubility information to select the appropriate solvent. Once prepared, please aliquot and store the solution to prevent product inactivation from repeated freeze-thaw cycles.
Storage method and period of stock solution: -80°C, 2 years; -20°C, 1 year. When stored at -80°C, please use it within 2 years. When stored at -20°C, please use it within 1 year.
Concentration (start) × Volume (start) = Concentration (final) × Volume (final)
In Vivo:
Select the appropriate dissolution method based on your experimental animal and administration route.
- For the following dissolution methods, please ensure to first prepare a clear stock solution using an In Vitro approach and then sequentially add co-solvents:
- To ensure reliable experimental results, the clarified stock solution can be appropriately stored based on storage conditions. As for the working solution for In Vivo experiments, it is recommended to prepare freshly and use it on the same day.
- The percentages shown for the solvents indicate their volumetric ratio in the final prepared solution. If precipitation or phase separation occurs during preparation, heat and/or sonication can be used to aid dissolution.
Add each solvent one by one: 10% DMSO 40% PEG300 5% Tween-80 45% Saline
Solubility: ≥ 2.5 mg/mL (5.24 mM); Clear solution
This protocol yields a clear solution of ≥ 2.5 mg/mL (saturation unknown).
Taking 1 mL working solution as an example, add 100 μL DMSO stock solution (25.0 mg/mL) to 400 μL PEG300, and mix evenly; then add 50 μL Tween-80 and mix evenly; then add 450 μL Saline to adjust the volume to 1 mL.
Preparation of Saline: Dissolve 0.9 g sodium chloride in ddH₂O and dilute to 100 mL to obtain a clear Saline solution.
Add each solvent one by one: 10% DMSO 90% (20% SBE-β-CD in Saline)
Solubility: ≥ 2.5 mg/mL (5.24 mM); Clear solution
This protocol yields a clear solution of ≥ 2.5 mg/mL (saturation unknown).
Taking 1 mL working solution as an example, add 100 μL DMSO stock solution (25.0 mg/mL) to 900 μL 20% SBE-β-CD in Saline, and mix evenly.
Preparation of 20% SBE-β-CD in Saline (4°C, storage for one week): 2 g SBE-β-CD powder is dissolved in 10 mL Saline, completely dissolve until clear.
In Vivo Dissolution Calculator
Please enter the basic information of animal experiments:
-
-
-
-
Recommended: Prepare an additional quantity of animals to account for potential losses during experiments.
Please enter your animal formula composition:
-
%DMSO +
Recommended: Keep the proportion of DMSO in working solution below 2% if your animal is weak.
-
%+
-
+%Tween-80 + +
-
%Saline +
The co-solvents required include: DMSO, . All of co-solvents are available by MedChemExpress (MCE). , Tween 80. All of co-solvents are available by MedChemExpress (MCE).
Working solution concentration: 0.22 mg/mL
Method for preparing stock solution: mg drug dissolved in μL DMSO. Stock solution concentration: mg/mL.
1. Take μL DMSO stock solution;
2. Add μL .
μL , mix evenly;
3. Then add μL Tween 80, mix evenly;
4. Then add μL
Please ensure that the stock solution in the first step is dissolved to a clear state, and add co-solvents in sequence. You can use ultrasonic heating (ultrasonic cleaner, recommended frequency 20-40 kHz), vortexing, etc. to assist dissolution.

Protocols
-
RNA extraction experimental
By lysing cells, releasing RNA, and removing impurities such as proteins and DNA, high-purity RNA products are finally obtained. The commonly used traditional method is the guanidine isothiocyanate/phenol/chloroform method (Trizol), which is suitable for a variety of animal materials including animal tissues, microorganisms, cultured cells, etc., and most plant materials.
-
Cell migration
Cell migration is a method that plays an important role in wound healing, cell differentiation, embryonic development, etc.
-
Apoptosis
Apoptosis, also called programmed cell death, is generally characterized by distinct morphological characteristics.
-
TUNEL staining for apoptotic DNA fragmentation
TUNEL staining detects DNA strand breaks by using terminal deoxynucleotidyl transferase to add labeled nucleotides to exposed 3′-OH DNA termini, generating either microscopic staining in fixed cells or tissue sections, or fluorescence/cytometric signal in cell suspensions. TUNEL positivity reflects DNA fragmentation but should not be interpreted alone as definitive apoptosis, because TUNEL can also label necrotic, autolytic, mechanically damaged, or DNA-repair-associated DNA breaks.
-
Flow cytometric DNA-content cell-cycle staining
Flow cytometric DNA-content cell-cycle staining measures the fluorescence intensity of DNA-bound fluorochromes in single cells or nuclei to estimate DNA content distributions, allowing assignment of populations to G0/G1, S, and G2/M phases by DNA histogram deconvolution. Propidium iodide (PI) intercalates into DNA, and PI fluorescence is proportional to cellular DNA content when staining is performed under conditions that make DNA accessible and minimize non-DNA signal. Cells with G2/M DNA content are expected to show approximately twice the fluorescence intensity of G0/G1 cells, while S-phase cells occupy intermediate fluorescence values. PI-based DNA-content analysis can also detect cells with fractional DNA content, often reported as sub-G1, when DNA fragmentation and extraction during staining reduce retained DNA signal in apoptotic cells. DAPI is an alternative DNA fluorochrome for univariate DNA-content analysis, while bivariate approaches combining DNA content with proliferation
-
Chemotaxis Gradient Chamber Assay 1
The chemotaxis gradient chamber assay is based on the principle of observing directional cell migration in response to a stable, linear or quasi-linear concentration gradient of a chemoattractant formed between two fluid reservoirs separated by a narrow observation chamber. Cells placed within the chamber respond to the gradient by polarized movement toward higher chemoattractant concentrations, allowing quantification of chemotactic behavior in real time under microscopy. The classic Zigmond chamber design enables simultaneous visualization of gradient formation and individual cell trajectories, making it suitable for studying leukocyte chemotaxis and other motile cell types in vitro.
-
Research Protocol for Endocrine Diseases
Endocrine diseases often arise from disrupted hormone production, hormone signaling, or target-tissue responsiveness; for diabetes-focused endocrine disease models, insulin signaling regulates glucose uptake, hepatic glucose output, lipid metabolism, and β-cell compensation. Type 2 diabetes develops through interacting defects in insulin resistance, β-cell dysfunction, adipose inflammation, hepatic glucose overproduction, altered incretin signaling, and ectopic lipid metabolism. A major unresolved question is whether endocrine dysfunction is driven primarily by target-tissue insulin resistance, intrinsic β-cell failure, immune/inflammatory stress, or combined multi-organ failure that differs by disease stage.
-
Under-Agarose Cell Migration Assay
The under-agarose cell migration assay is a classical in vitro chemotaxis method designed to evaluate directed cell movement through a semi-solid agarose matrix toward soluble chemoattractant gradients, enabling visualization and quantification of leukocyte or motile cell migration in a confined 2D-like environment. In this system, cells and chemoattractants are placed in separate wells cut into an agarose gel, allowing diffusion-driven gradient formation that guides directional migration, which is typically assessed by measuring migration distance, cell morphology changes, and accumulation toward the chemoattractant source. This assay has been widely used to study neutrophil and leukocyte chemotaxis as a simple alternative to filter-based migration systems and allows direct microscopic observation of migrating cells under near-physiological confinement conditions.
-
Fluorescent plasma-membrane potential dye assay
Fluorescent plasma-membrane potential dye assays measure changes in cell membrane potential using voltage-sensitive dyes whose fluorescence changes when cells depolarize or hyperpolarize. Anionic bis-oxonol dyes such as DiBAC4(3) enter depolarized cells more readily and show increased fluorescence after intracellular binding, while hyperpolarization reduces dye accumulation and fluorescence. FMP/FLIPR membrane-potential dyes are used for faster, homogeneous microplate assays of ion-channel or receptor-mediated membrane-potential changes.
-
Transwell/Boyden Chamber Migration Assay
The Transwell/Boyden chamber migration assay measures cell movement through a porous membrane separating an upper and lower chamber, usually after a chemoattractant gradient is established by placing cells in the upper chamber and chemoattractant-containing medium in the lower chamber. The readout is generated by quantifying cells that traverse the membrane and appear on the lower membrane surface or in the lower chamber, depending on whether the cell type is adherent or non-adherent. This assay reflects chemotactic or haptotactic migration rather than matrix invasion unless an extracellular-matrix barrier is added to the membrane.
-
Mitochondrial membrane-potential and mitochondrial mass staining
Mitochondrial membrane potential staining measures the electrochemical polarization across the mitochondrial inner membrane in live cells using lipophilic cationic fluorescent probes; early rhodamine-based work showed that selective mitochondrial dye accumulation is lost when the mitochondrial transmembrane potential is dissipated. JC-1 reports mitochondrial polarization by shifting from green monomer fluorescence to red J-aggregate fluorescence as dye concentration increases within energized mitochondria; therefore, the red/green fluorescence ratio is used as a relative readout of mitochondrial membrane potential. TMRE or TMRM staining provides a single-channel relative readout because these cationic rhodamine esters accumulate in polarized mitochondria, and lower fluorescence indicates reduced mitochondrial polarization when acquisition and dye-loading conditions are controlled. Mitochondrial mass staining is commonly performed with MitoTracker Green FM or related MitoTracker dyes as
-
Apoptosis Solutions
Apoptosis is a regulated, generally non-lytic cell-death pathway that removes unwanted, damaged, infected, or abnormal cells through coordinated morphological changes, caspase activation, DNA fragmentation, and membrane remodeling. The intrinsic apoptosis pathway is controlled mainly by mitochondrial outer membrane permeabilization, BCL-2 family proteins, cytochrome c release, apoptosome formation, caspase-9 activation, and downstream executioner caspase-3/7 activation. The extrinsic apoptosis pathway is initiated by death receptors such as Fas, TNFR, and TRAIL receptors, which recruit adaptor proteins and activate caspase-8 before engaging executioner caspases or mitochondrial amplification through BID cleavage. Apoptosis is linked to many phenotypes, including cancer cell killing, tissue homeostasis, immune regulation, neurodegeneration, infection response, and treatment-induced cytotoxicity; unresolved questions include how apoptosis interacts with necroptosis, pyroptosis, ferroptos
-
3D Collagen/Hydrogel Matrix Migration Assay
The 3D collagen/hydrogel matrix migration assay is based on embedding cells within or on top of a fibrillar collagen type I-rich three-dimensional matrix to model in vivo-like extracellular matrix (ECM) architecture, enabling analysis of cell migration through a physically and biochemically relevant scaffold. In contrast to 2D migration systems, cells in 3D matrices interact with fibrillar collagen networks, requiring coordinated adhesion remodeling and proteolytic or non-proteolytic deformation mechanisms to move through confined spaces, thereby providing a more physiologically relevant readout of invasive and migratory behavior in tissue-like environments. Cell movement in 3D collagen matrices is typically quantified by tracking single-cell trajectories, invasion depth, or matrix penetration over time, reflecting combined effects of cytoskeletal dynamics, cell-ECM adhesion turnover, and ECM remodeling. These systems are widely used to study tumor cell invasion and stromal cell motili
-
Soft Agar Colony Formation Assay
Soft agar colony formation assay measures anchorage-independent growth, in which transformed or tumorigenic cells proliferate as colonies in a semisolid agar matrix while many non-transformed adherent cells fail to proliferate without attachment; classic studies showed that growth in semisolid medium correlates with tumorigenicity in nude mice, and later protocol papers describe the method as a stringent in vitro assay for malignant transformation. The readout is the number, size, morphology, or signal intensity of colonies formed within agar after incubation; published formats include manual colony counting after staining, 96-well or 384-well quantitative formats, DNA-binding dye detection, MTT/tetrazolium-based detection, digital image analysis, and PCR-based marker detection from soft agar cultures.
-
Cell-Exclusion Zone Migration Assay
The Cell-Exclusion Zone (CEZ) migration assay is an in vitro 2D cell migration method in which a defined cell-free area is created using removable physical barriers such as silicone stoppers, allowing cells to be seeded around the barrier and subsequently migrate into the cleared zone after barrier removal. This approach enables quantification of collective cell migration by monitoring repopulation of the initially cell-free region over time using microscopy-based imaging. Compared with scratch-based wound healing assays, barrier-based exclusion methods are designed to avoid mechanical damage to the extracellular matrix and reduce injury-induced effects on boundary cells, thereby improving interpretability of migration behavior in vitro. The assay readout is typically the progressive reduction in the cell-free area or the number of cells invading the exclusion zone, reflecting coordinated cell motility relevant to physiological processes such as wound healing, epithelial repair, and ca
-
Chemotaxis Gradient Chamber Assay 2
Chemotaxis gradient chamber assays measure directional cell migration in response to a soluble chemical gradient by imaging cells as they move across a defined observation region; the readout is generated from time-lapse cell trajectories, displacement toward the gradient, forward migration index, trajectory plots, rose/polar plots, and statistical tests of non-random directionality. The Dunn chamber is a direct-viewing glass chamber in which cells migrate across a bridge between control and chemoattractant wells, allowing observation of cells in a linear concentration gradient; related direct-viewing formats include the Insall chamber, which supports defined unidirectional gradients and high numerical-aperture microscopy, and the μ-Slide Chemotaxis chamber, which supports long-term live-cell imaging and gradient characterization with fluorescent dye.
-
RT-PCR
Reverse transcription technology uses RNA as a template to synthesize DNA. RT-PCR is simple, specific and sensitive, and can be used to detect gene expression levels and expression differences in cells; detect RNA virus content; clone cDNA sequences of specific genes.
-
Western Blot
Western blotting (WB) is a commonly used experimental method in molecular biology, biochemistry, and immunogenetics for identifying and quantifying target proteins. It combines gel electrophoresis with immunoassay, enabling researchers to analyze protein expression, post-translational modifications, and molecular weight.
-
Scratch/Wound-Healing Migration Assay
The scratch/wound-healing migration assay measures collective migration of adherent cells into an experimentally created cell-free gap in a confluent monolayer. The readout is generated by imaging the gap immediately after scratching and at later time points, then quantifying reduction in wound area, wound width, or percentage closure as cells move into the denuded region. Gap closure reflects cell migration but may also include cell proliferation, so interpretation should distinguish migration-focused conditions from proliferation-driven closure when possible, such as by using short assay windows, serum-controlled conditions, cell counting, or proliferation controls reported in published protocols.
-
Mitochondrial membrane-potential fluorescent assay
Mitochondrial membrane potential fluorescent assays estimate ΔΨm in living cells using lipophilic cationic dyes such as TMRM, TMRE, rhodamine 123, and JC-1, which accumulate in mitochondria according to membrane polarization; loss of signal after FCCP or CCCP treatment is interpreted as mitochondrial depolarization. TMRM/TMRE and rhodamine 123 are commonly used for semi-quantitative live-cell microscopy or flow cytometry, while JC-1 can report a shift from red aggregate fluorescence to green monomer fluorescence during depolarization; interpretation requires controls because dye concentration, quenching mode, cell type, dye efflux, and mitochondrial mass can affect fluorescence independently of ΔΨm.
-
Annexin V plus membrane-impermeant dye apoptosis staining
Annexin V-based apoptosis assays rely on the detection of phosphatidylserine (PS) externalization from the inner leaflet of the plasma membrane to the outer leaflet, an early biochemical hallmark of apoptosis. Fluorescently labeled Annexin V binds PS in a calcium-dependent manner, enabling identification of early apoptotic cells by flow cytometry or fluorescence microscopy. When combined with a membrane-impermeant DNA-binding dye (e. g. , propidium iodide), this approach allows discrimination between viable (Annexin V−/dye−), early apoptotic (Annexin V+/dye−), and late apoptotic or necrotic (Annexin V+/dye+) cell populations by assessing membrane integrity and PS exposure.
-
BrdU Incorporation Assay
Bromodeoxyuridine (BrdU) incorporation assay is based on the principle that BrdU, a thymidine analog, is incorporated into newly synthesized DNA during the S phase of the cell cycle, thereby serving as a marker of DNA replication and cellular proliferation. Incorporated BrdU can be detected using anti-BrdU antibodies following DNA denaturation, enabling visualization or quantification of proliferating cells through immunochemical detection methods such as immunofluorescence or immunohistochemistry.
-
ROS/oxidative-stress fluorescent staining
ROS/oxidative-stress fluorescent staining uses cell-permeant fluorogenic probes that become fluorescent after oxidation inside cells or tissues; commonly used examples include DCFH-DA/DCFDA for broad cellular oxidant detection, DHE for superoxide-related signal detection, MitoSOX for mitochondrial superoxide-related signal detection, and CellROX probes for oxidative-stress-associated fluorescence readouts. The assay detects probe oxidation rather than a single ROS species unless the probe and analysis method have been chemically validated for that species. DCFH-DA enters cells, is deacetylated by intracellular esterases to DCFH, and produces fluorescent DCF after oxidation, so the readout is used as an operational measure of total cellular oxidative stress rather than a species-specific ROS measurement. DHE and MitoSOX can report superoxide-related oxidation, but red fluorescence alone can include non-specific ethidium-like oxidation products; HPLC or optimized spectral approaches are
-
Neural Crest/Neuronal Cell Migration Explant Assay
Neural crest (NC) and neuronal cell migration explant assays are in vitro systems in which neural tube-derived tissues are cultured to allow premigratory or newly emigrated neural crest cells to undergo epithelial-to-mesenchymal transition (EMT), migrate away from the explant, and form a measurable radial outgrowth that reflects migratory capacity and environmental responsiveness. These assays typically quantify migration by measuring the expansion of cell outgrowth from neural tube or neural plate border explants over time, often comparing early and later timepoints to derive a migration index such as a radius ratio, which reflects net cell dispersal from the explant core. Neural tube explant cultures preserve key aspects of neural crest behavior, including EMT, migration, and early differentiation, making them suitable for assessing intrinsic migratory ability and extrinsic cue dependence. However, studies emphasize that migratory outgrowth from neural tube explants may include non-n
-
Protocol for Cell Cycle
Cell-cycle analysis by flow cytometry measures DNA content in single cells to estimate the fraction of cells in G0/G1, S, and G2/M phases. Propidium iodide intercalates into DNA, and after RNA removal with RNase, fluorescence intensity reflects cellular DNA content: 2N cells are assigned to G0/G1, cells between 2N and 4N to S phase, and 4N cells to G2/M. DNA-content analysis alone cannot reliably separate G0 from G1 or G2 from M. Ki-67 can distinguish quiescent G0 cells from cycling cells, EdU or BrdU incorporation marks active DNA synthesis in S phase, and phospho-histone H3 staining identifies mitotic cells within the 4N population.
-
Colony Formation (Clonogenic) Assay
The clonogenic (colony formation) assay measures the ability of a single cell to retain reproductive viability and form a macroscopic colony, typically defined as a cluster derived from one progenitor cell after a defined growth period. This assay is widely used to evaluate cell survival after exposure to ionizing radiation or cytotoxic treatments and is considered a standard method in radiation biology for generating dose-response relationships of reproductive cell death. Colony formation reflects long-term proliferative capacity rather than short-term metabolic activity, and survival is quantified by comparing treated versus untreated conditions based on colony number and derived survival fractions.
-
Research Protocol for Metabolic Diseases
AMP-activated protein kinase, AMPK, is a conserved cellular energy sensor that responds to reduced cellular energy status and coordinates metabolism by increasing ATP-generating catabolic pathways while suppressing ATP-consuming anabolic processes. In metabolic disease research, the AMPK pathway is experimentally relevant because it regulates hepatic lipid synthesis, fatty acid oxidation, glucose production, skeletal-muscle glucose disposal, mTORC1-linked biosynthesis, autophagy, mitochondrial homeostasis, and whole-body energy balance. The central pathway logic is that energy stress, metformin, exercise-like stimulation, or direct AMPK activators increase AMPKα Thr172 phosphorylation and downstream substrate phosphorylation, including ACC and RAPTOR. Phosphorylation of ACC suppresses lipogenesis and supports fatty acid oxidation, whereas phosphorylation of RAPTOR suppresses mTORC1 signaling and links cellular energy status to growth and protein synthesis control. The pathway is linked
-
Real Time qPCR (Q-PCR)
Real-time quantitative PCR (qPCR) quantifies an amplifiable nucleic-acid target by monitoring fluorescence during PCR cycling rather than measuring product only after amplification. The increase in fluorescence tracks accumulation of PCR product, and the quantification cycle (Cq; historically also Ct/CP) is related to the initial amount of target: samples containing more starting target generally reach the defined fluorescence threshold in fewer cycles.
-
Kinase activity and phosphorylation assays
Kinase activity assays measure the ability of kinases to transfer phosphate groups from ATP to specific substrates, while phosphorylation assays detect the presence and levels of phosphorylated proteins. Common methods include radiolabeled ATP incorporation (e. g. ,), ADP release detection via bioluminescence (e. g. ,[3]), enzyme-linked immunosorbent assays (ELISA) for phospho-specific epitopes (e. g. ,[6]), and microtiter-based formats for high-throughput screening (e. g. ,[8]). The ADP-Glo assay quantifies kinase activity by measuring ADP produced during phosphorylation using a luciferase-based system. Radiometric assays involve autoradiography or scintillation counting after incorporation of 32P-labeled ATP into substrate proteins. ELISA-based approaches rely on phospho-specific antibodies to detect activated kinases in cell lysates or purified samples.
-
Protocol for Kinase activity and phosphorylation assays
Kinase activity assays measure transfer of phosphate from ATP to a protein or peptide substrate, generating phosphorylated substrate, ADP, or incorporated radiolabeled phosphate as the readout; phosphorylation assays measure site-specific phosphorylation in cells or tissues as a proxy for kinase-pathway activation, inhibition, or substrate regulation. Phosphorylation can be detected by phospho-specific Western blot, immunoprecipitation kinase assay, phospho-immunofluorescence, phospho-flow cytometry, luminescent ADP detection, radiolabeled ATP incorporation, or reporter-based pathway assays, and these readouts can be applied to cancer cells, primary neurons, mouse tumors, organoids, inflammatory macrophages, ferroptosis studies, and mitophagy studies when the kinase target is biologically relevant.


Purity & Documentation
-
Data Sheet (288 KB)
-
SDS (396 KB)
- English - EN (396 KB)
- Français - FR (396 KB)
- Deutsch - DE (396 KB)
- Norwegian - NO (396 KB)
- Español - ES (396 KB)
- Swedish - SV (396 KB)
- Italian - IT (396 KB)
- Korean - KR (396 KB)
- Portuguese - PT (396 KB)
-
Handling Instructions (2659 KB)
References
[1]. Takamura Y, et al. Effects of Aerobic Exercise Combined with Panaxatriol Derived from Ginseng on Insulin Resistance and Skeletal Muscle Mass in Type 2 Diabetic Mice. J Nutr Sci Vitaminol (Tokyo). 2017;63(5):339-348. [Content Brief]
[2]. Kim TH, et al. The effects of ginseng total saponin, panaxadiol and panaxatriol on ischemia/reperfusion injury in isolated rat heart. Food Chem Toxicol. 2010;48(6):1516-1520. [Content Brief]
[3]. Yu R, et al. Potential antitumor effects of panaxatriol against DU-15 human prostate cancer cells is mediated via mitochondrial mediated apoptosis, inhibition of cell migration and sub-G1 cell cycle arrest. J BUON. 2018;23(1):200-204. [Content Brief]


Complete Stock Solution Preparation Table
Please refer to the solubility information to select the appropriate solvent. Once prepared, please aliquot and store the solution to prevent product inactivation from repeated freeze-thaw cycles.
Storage method and period of stock solution: -80°C, 2 years; -20°C, 1 year. When stored at -80°C, please use it within 2 years. When stored at -20°C, please use it within 1 year.
| Optional Solvent | Concentration Solvent Mass | 1 mg | 5 mg | 10 mg | 25 mg |
|---|---|---|---|---|---|
| DMSO | 1 mM | 2.0976 mL | 10.4881 mL | 20.9762 mL | 52.4406 mL |
| 5 mM | 0.4195 mL | 2.0976 mL | 4.1952 mL | 10.4881 mL | |
| 10 mM | 0.2098 mL | 1.0488 mL | 2.0976 mL | 5.2441 mL | |
| 15 mM | 0.1398 mL | 0.6992 mL | 1.3984 mL | 3.4960 mL | |
| 20 mM | 0.1049 mL | 0.5244 mL | 1.0488 mL | 2.6220 mL | |
| 25 mM | 0.0839 mL | 0.4195 mL | 0.8390 mL | 2.0976 mL | |
| 30 mM | 0.0699 mL | 0.3496 mL | 0.6992 mL | 1.7480 mL | |
| 40 mM | 0.0524 mL | 0.2622 mL | 0.5244 mL | 1.3110 mL | |
| 50 mM | 0.0420 mL | 0.2098 mL | 0.4195 mL | 1.0488 mL |


Panaxatriol Related Classifications
HY-N0597 Related Classifications
 Powered by Bioz