



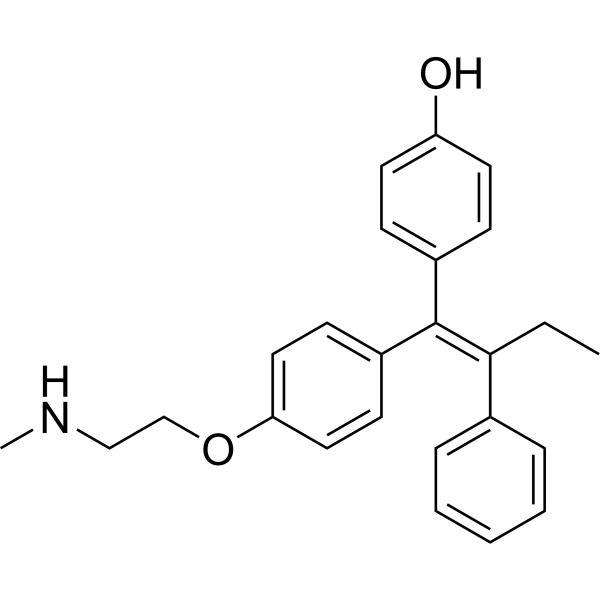
Endoxifen (Z-isomer)
Based on 3 publication(s) in Google Scholar
Endoxifen Z-isomer is an orally active selective PKCβ1 inhibitor with an IC50 of 360 nM against human PKCβ1. Endoxifen Z-isomer also acts as an estrogen receptor modulator and antiestrogen. Endoxifen Z-isomer binds to and blocks ERα, ERβ and PKCβ1, inhibits estrogen and PI3K/AKT/mTORC1 signaling pathways, suppresses the expression of genes associated with cell cycle, cell proliferation and extracellular matrix remodeling, and induces apoptosis, reactive oxygen species (ROS) production and hypoxic features. Endoxifen Z-isomer inhibits tumor growth in breast tumor and glioblastoma models, reduces bone turnover and blood lipid levels, and does not require metabolism via CYP2D6. Endoxifen Z-isomer can be used in research related to ER+ breast cancer, invasive breast cancer, glioblastoma multiforme, type I bipolar disorder, desmoid tumor, gynecological malignancies, melanoma and hormone receptor-positive solid tumors.
For research use only. We do not sell to patients.
- Purity : 99.19%
- CAS No.: 112093-28-4
- Formula: C25H27NO2
- Molecular Weight:373.49
-
Storage:Powder -20°C, 3 years , 4°C, 2 years ; In solvent -80°C, 6 months , -20°C, 1 month

To place orders, for customer services and technical support, please contact: MedChemExpress USA
Tel: 609-228-6898 E-mail: [email protected] [email protected]


-
 Biological Activity
-
Chemical Information
-
Solvent & Solubility
- Protocols
- Purity & Documentation
- References
-
 Help & FAQs


-
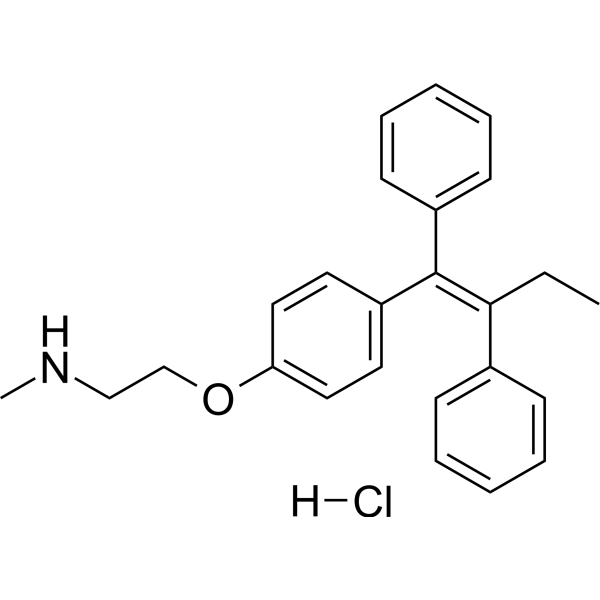
HY-129099A
N-Desmethyltamoxifen hydrochloridePKC Inhibitor -
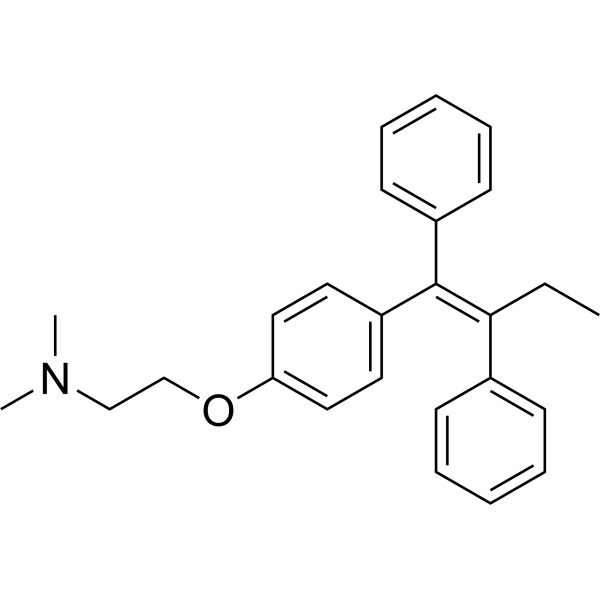
HY-13757AR
Tamoxifen (Standard)Estrogen Receptor Modulator -
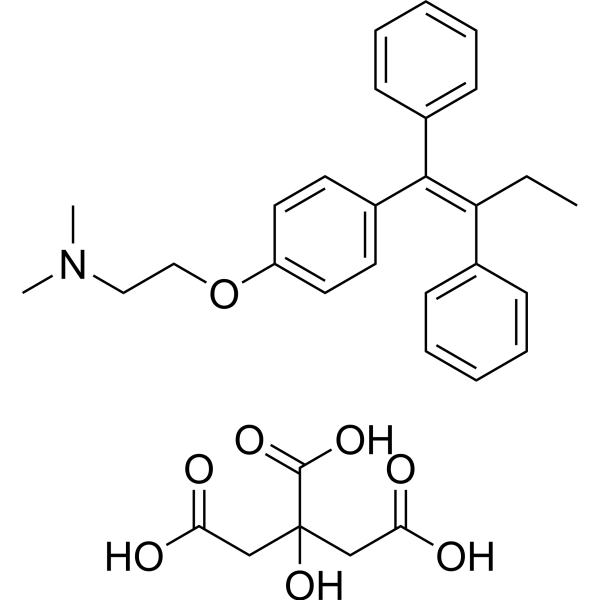
HY-13757
Tamoxifen CitrateEstrogen Receptor Modulator -
HY-B0141
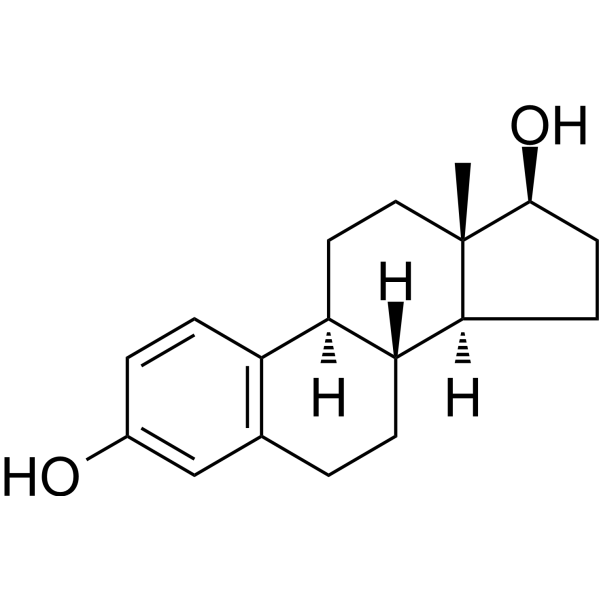
EstradiolHuman Endogenous Metabolite -
HY-10426
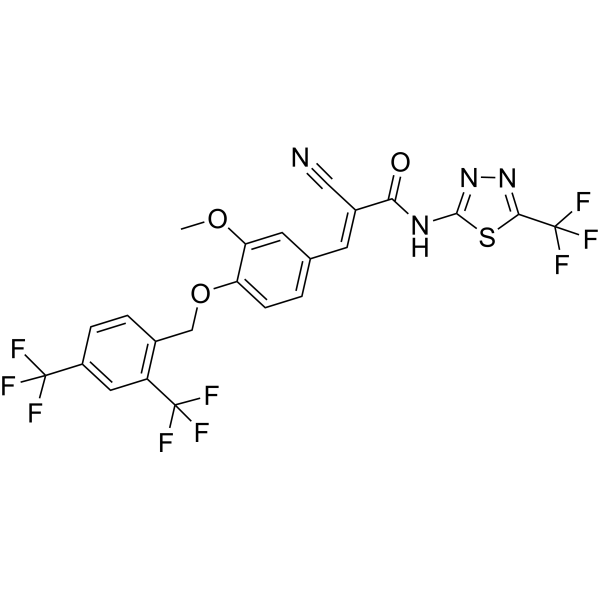
XCT790ERRα Inverse Agonist -
HY-B0216
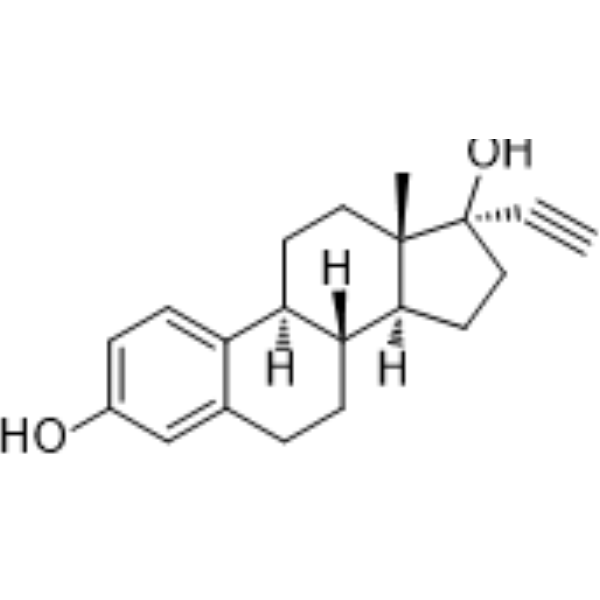
EthinylestradiolEndogenous Metabolite -
HY-B0234
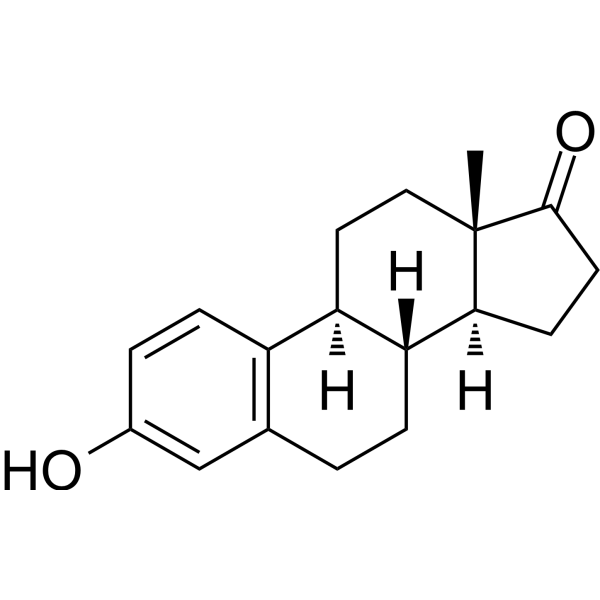
EstroneEndogenous Metabolite -
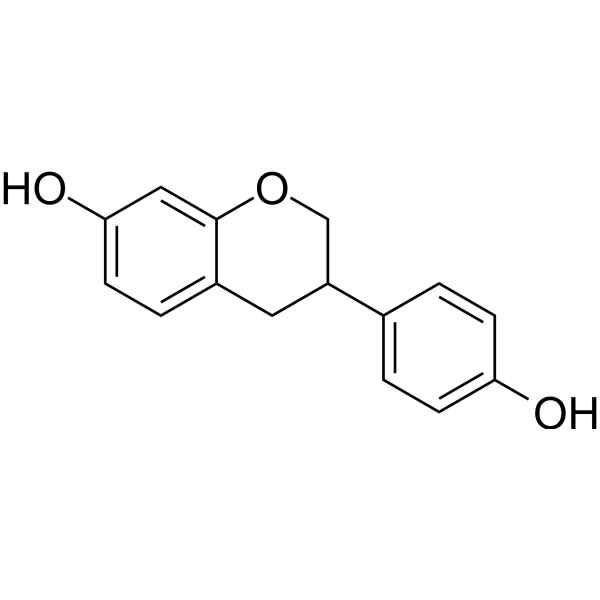
HY-100583A
(±)-EquolNonsteroidal Estrogen -
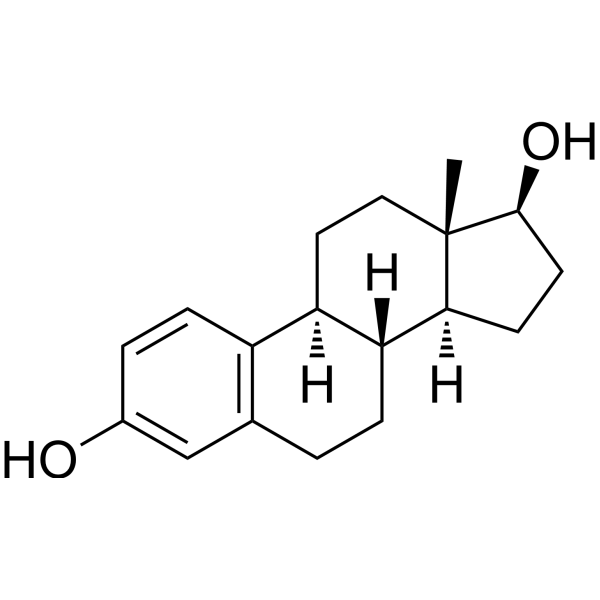
HY-B0141R
Estradiol (Standard) -
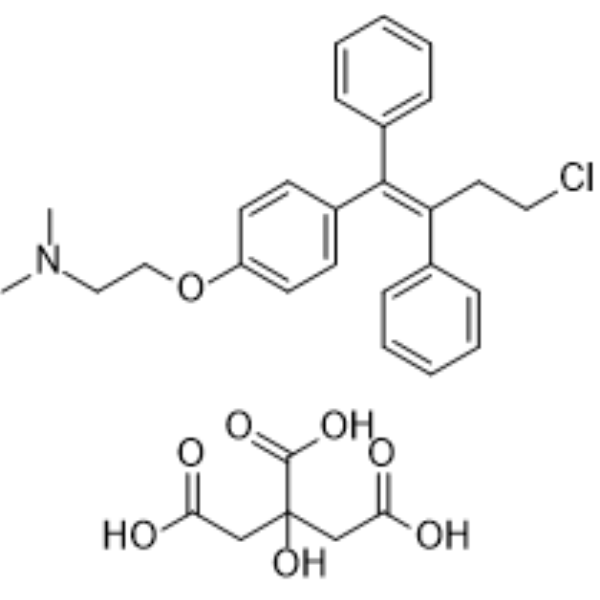
HY-B0005
Toremifene citrateApoptosis Inducer -
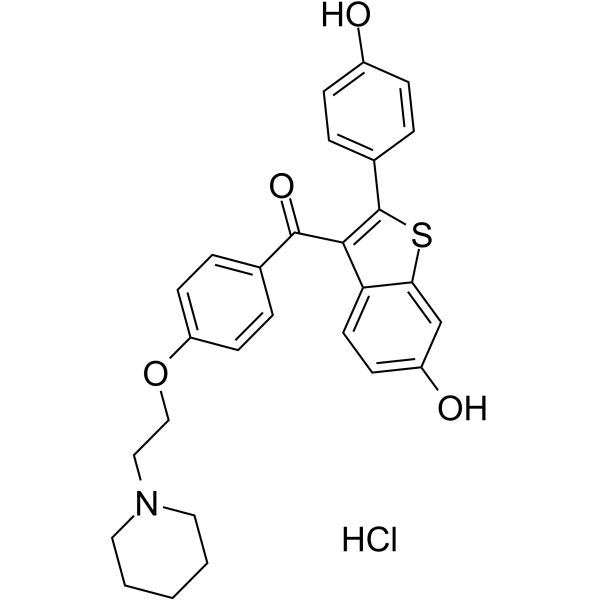
HY-13738A
Raloxifene hydrochlorideEstrogen Receptor Modulator -
HY-B0412
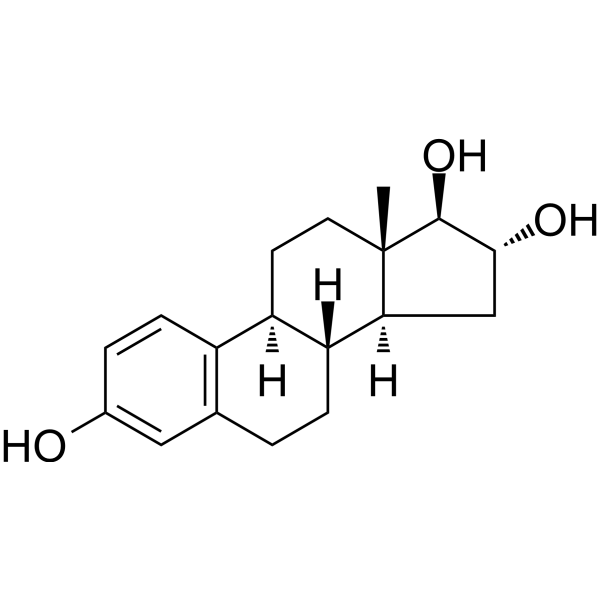
EstriolEstrogen
Publications Citing Use of MedChemExpress (MCE) Endoxifen (Z-isomer)
More

Biological Activity
Description
|
Human PKCβI 360 nM (IC50) |
ERα |
ERβ |
PI3K |
Akt |
mTORC1 |
Cellular Effect
|
Cell Line

|
Type | Value | Description | References |
|---|---|---|---|---|
| HeLa | IC50 |
3.05 μM
Compound: Endoxifen
|
Inhibition of Ebolavirus glycoprotein/matrix protein VP40 entry in human HeLa cells after 4.5 hrs beta-lactamase reporter assay
Inhibition of Ebolavirus glycoprotein/matrix protein VP40 entry in human HeLa cells after 4.5 hrs beta-lactamase reporter assay
|
[PMID: 29624387] |
| MCF-10A | IC50 |
>10 μM
Compound: Endoxifen
|
Antiproliferative activity against human MCF-10A cells assessed as reduction in cell viability after 72 hrs by cell counter method
Antiproliferative activity against human MCF-10A cells assessed as reduction in cell viability after 72 hrs by cell counter method
|
[PMID: 34364162] |
| MCF7 | IC50 |
0.1 μM
Compound: Endoxifen
|
Antiproliferative activity against human MCF7 cells assessed as reduction in cell viability after 72 hrs by cell counter method
Antiproliferative activity against human MCF7 cells assessed as reduction in cell viability after 72 hrs by cell counter method
|
[PMID: 34364162] |
In Vitro
Endoxifen Z-isomer (concentrations matching CYP2D6 extensive metabolizers) is a potent antiestrogen that induces cell-cycle arrest and apoptosis pathways in MCF7 human ER+ breast cancer cells, and completely blocks estrogen-stimulated gene expression unlike Tamoxifen (HY-13757A) and its other metabolites[3].
Endoxifen Z-isomer (0.08-20 μM; 8 days) potently reduces cell proliferation and induces apoptosis in CRT435 GBM cells, with 20 μM endoxifen alone and in combination with 150 μM TMZ (Temozolomide) (HY-17364) demonstrating significantly greater activity than 250 μM TMZ alone[4].
Endoxifen Z-isomer (2.5-10 μM; 48 h) induces significant dose-dependent apoptosis in estrogen-deprived ERα+/HER2- MCF7AC1 breast cancer cells, with the strongest effect observed at 10 μM[7].
Endoxifen Z-isomer (0.01-5 μM; 72 h) induces significant apoptosis in estrogen-deprived ERα+/HER2- T47D-LTED breast cancer cells, while lower concentrations (0.01, 0.1 μM) do not[7].
Endoxifen Z-isomer (5 μM; 24 h) attenuates AKTSer473 phosphorylation and induces PARP cleavage in estrogen-deprived ERα+/HER2- T47D-LTED breast cancer cells[7].
Endoxifen Z-isomer (5 μM; 48 h incubation, after 48 h cumate pretreatment where applicable) has its apoptosis-inducing effect significantly diminished by overexpression of constitutively active AKT in estrogen-deprived ERα+/HER2- MCF7AC1caAKT breast cancer cells[7].
Endoxifen Z-isomer (10 nM-10000 nM; 7 days) potently inhibits the proliferation of AI-sensitive MCF7AC1 human breast cancer cells in both the presence and absence of Androstenedione[6].
Endoxifen Z-isomer (10 nM-10000 nM; 7 days) potently inhibits the proliferation of Letrozole (HY-14248)-resistant MCF7LR human breast cancer cells in both the presence and absence of Androstenedione[6].
Endoxifen Z-isomer (7 days) potently inhibits the proliferation of ER+ human breast cancer cells regardless of HER2 status[6].
Endoxifen Z-isomer (>5 μM; 7 days) inhibits the proliferation of ER−/HER2− MDA-MB-231, MDA-MB-468, and BT20 human breast cancer cells at concentrations greater than 5 μM[6].
Endoxifen Z-isomer (2.5-10 μM; 48 h) significantly reduces cell viability in estrogen-deprived ERα+/HER2- MCF7AC1 breast cancer cells, with the strongest effect observed at 10 μM[7].
Endoxifen Z-isomer (0.01-5 μM; 24 h) has a minimal impact on the total proteome of estrogen-deprived ERα+/HER2- MCF7AC1 breast cancer cells but induces robust, concentration-dependent changes to the phosphoproteome at 5 μM, with downregulated phosphosites enriched in the PI3K-AKT signaling pathway[7].
Endoxifen Z-isomer (0.01-5 μM; 24 h) attenuates AKTSer473 phosphorylation and AKT substrate phosphorylation in estrogen-deprived ERα+/HER2- MCF7AC1 breast cancer cells, while lower concentrations (0.01, 0.1 μM) increase AKTThr308 phosphorylation without altering AKTSer473 or AKT substrate phosphorylation[7].
Endoxifen Z-isomer (~0.0002-50 μM) potently inhibits purified PKCβ1 kinase activity in vitro with an IC50 of 360 nM[7].
Endoxifen Z-isomer (0.01-5 μM; 2 h pretreatment, followed by 20 min 200 nM PMA stimulation) reduces total PKCβ1 protein levels and attenuates PMA-stimulated AKTSer473 phosphorylation and AKT substrate phosphorylation in serum-starved ERα+/HER2- MCF7AC1 breast cancer cells, while lower concentrations (0.01, 0.1 μM) do not elicit these effects[7].
Endoxifen Z-isomer (100-1000 nM) inhibits estrogen-induced proliferation in wild-type and ESR1-mutant ER-positive breast cancer cells, with maximum inhibition of ER transcription and estrogen-induced stimulation occurring at concentrations between 100 and 1000 nM, and higher concentrations required for cells with ESR1 mutations or exposed to estradiol concentrations mimicking premenopausal or postmenopausal settings[9].
Endoxifen Z-isomer (0.1-5 μM; 1 h) inhibits p-Akt and total Akt protein expression in serum-starved MCF7LR human breast cancer cells after 1 hour of treatment[6].
MedChemExpress (MCE) has not independently confirmed the accuracy of these methods. They are for reference only. Further protocols information, click here.
-
Cell Line:CRT435 glioblastoma multiforme (GBM) cell line
-
Concentration:0.08-20 μM; 20 μM in combination with 150 μM TMZ
-
Incubation Time:8 days
-
Result:Reduced cell proliferation with a mean difference (Δ) of 269.7 compared to vehicle control, a more pronounced effect than 250 μM TMZ alone (Δ = 142.6).
Reduced cell proliferation with a Δ of 272.8 compared to vehicle control when combined with 150 μM TMZ; both 20 μM endoxifen alone and the combination showed significantly greater inhibition of proliferation than 250 μM TMZ alone (Δ = 127.1 and Δ = 130.2, respectively).
Induced cell death with a Δ of -283181.9 compared to vehicle control, a stronger effect than 250 μM TMZ alone (Δ = -192842.7).
Induced apoptosis with a Δ of -536528.8 compared to vehicle control when combined with 150 μM TMZ, a significantly greater effect than 250 μM TMZ alone (Δ = 343686.2) and comparable to the positive control (10% DMSO, Δ = -581979.3).
-
Cell Line:Aromatase-expressing MCF7AC1 (AI-sensitive) human breast cancer cells
-
Concentration:10 nM-10000 nM (presence of androstenedione); 10 nM-10000 nM (absence of androstenedione)
-
Incubation Time:7 days (presence of androstenedione); 7 days (absence of androstenedione)
-
Result:Potently inhibited MCF7AC1 cell growth, with activity superior to tamoxifen and similar to fulvestrant.
Reduced cell growth to near 0% of control at 10000 nM in the presence of androstenedione.
Reduced cell growth to near 0% of control at 10000 nM in the absence of androstenedione.
-
Cell Line:Letrozole-resistant MCF7LR human breast cancer cells
-
Concentration:10 nM-10000 nM (presence of androstenedione); 10 nM-10000 nM (absence of androstenedione)
-
Incubation Time:7 days (presence of androstenedione); 7 days (absence of androstenedione)
-
Result:Potently inhibited MCF7LR cell growth, with activity superior to tamoxifen and similar to fulvestrant.
Reduced cell growth to near 0% of control at 10000 nM in the presence of androstenedione.
Reduced cell growth to near 0% of control at 10000 nM in the absence of androstenedione.
-
Cell Line:ER−/HER2− human breast cancer cells (MDA-MB-231, MDA-MB-468, BT20)
-
Concentration:>5 μM (presence of estrogen); >5 μM (absence of estrogen)
-
Incubation Time:7 days (presence of estrogen); 7 days (absence of estrogen)
-
Result:Exhibited antiproliferative activity at concentrations >5 μM, with a pattern of activity similar to tamoxifen and 4-hydroxytamoxifen, both in the presence and absence of estrogen.
-
Cell Line:Serum-starved MCF7LR human breast cancer cells
-
Concentration:0.1 μM; 5 μM
-
Incubation Time:1 h
-
Result:Effectively inhibited both p-Akt and total Akt protein levels relative to ethanol control at 5 μM.
Did not induce p-Akt levels, unlike letrozole, tamoxifen, and 4-hydroxytamoxifen treatments.
-
Cell Line:Estrogen-deprived ERα+/HER2- MCF7AC1 breast cancer cells
-
Concentration:0.01-10 μM
-
Incubation Time:48 h
-
Result:Reduced cell viability to ~55% of control at 10 μM.
Reduced cell viability to ~75% of control at 7.5 μM.
Reduced cell viability to ~85% of control at 5 μM.
Did not significantly affect cell viability at concentrations below 2.5 μM.
-
Cell Line:Estrogen-deprived ERα+/HER2- MCF7AC1 breast cancer cells
-
Concentration:0.01-10 μM
-
Incubation Time:48 h
-
Result:Induced ~80% apoptosis at 10 μM.
Induced ~75% apoptosis at 7.5 μM.
Induced ~50% apoptosis at 5 μM.
Did not significantly induce apoptosis at concentrations below 2.5 μM.
-
Cell Line:Estrogen-deprived ERα+/HER2- MCF7AC1 breast cancer cells
-
Concentration:0.01 μM; 0.1 μM; 5 μM
-
Incubation Time:24 h
-
Result:Reduced pAKTSer473 levels to 50% of control at 5 μM, with no significant effect at 0.01 μM and 0.1 μM.
Increased pAKTThr308 levels to 221% of control at 0.01 μM and 0.1 μM, with no significant effect at 5 μM.
Reduced phosphorylation of AKT substrates only at 5 μM.
-
Cell Line:serum-starved ERα+/HER2- MCF7AC1 breast cancer cells
-
Concentration:0.01 μM; 0.1 μM; 5 μM
-
Incubation Time:2 h pretreatment, followed by 1 h 100 nM insulin stimulation
-
Result:Blocked insulin-stimulated pAKTSer473 and pAKTThr308 phosphorylation at 5 μM, with no effect at 0.01 μM and 0.1 μM.
Diminished insulin-stimulated phosphorylation of AKT substrates at 5 μM, with no effect at lower concentrations.
-
Cell Line:serum-starved ERα+/HER2- MCF7AC1 breast cancer cells
-
Concentration:0.01-5 μM
-
Incubation Time:2 h pretreatment, followed by 20 min 200 nM PMA stimulation
-
Result:Reduced total PKCβ1 levels to 29% of control at 5 μM, with no significant effect at 0.01 μM and 0.1 μM.
Attenuated PMA-stimulated pAKTSer473 phosphorylation and AKT substrate phosphorylation at 5 μM, with no effect at lower concentrations.
Had minimal to no effect on PMA-stimulated pPKCβ1Ser661 phosphorylation at all tested concentrations.
-
Cell Line:estrogen-deprived ERα+/HER2- T47D-LTED breast cancer cells
-
Concentration:0.01-5 μM
-
Incubation Time:72 h
-
Result:Induced significant apoptosis reaching ~50% at 5 μM.
Did not significantly induce apoptosis at 0.01 μM and 0.1 μM.
-
Cell Line:estrogen-deprived ERα+/HER2- T47D-LTED breast cancer cells
-
Concentration:0.01-5 μM
-
Incubation Time:24 h
-
Result:Reduced pAKTSer473 levels to 61% of control at 5 μM, with no significant effect at 0.01 μM and 0.1 μM.
Increased cleaved PARP levels to 1.58-fold of control at 5 μM, with no significant effect at lower concentrations.
-
Cell Line:estrogen-deprived ERα+/HER2- MCF7AC1caAKT breast cancer cells (with cumate-induced constitutively active AKT expression)
-
Concentration:5 μM
-
Incubation Time:48 h incubation, after 48 h cumate pretreatment where applicable
-
Result:Induced significant apoptosis reaching ~90% by 48 hours in the absence of cumate.
Induced significantly less apoptosis reaching ~45% by 48 hours with no significant difference vs control in the presence of cumate (active AKT overexpression).
In Vivo
Endoxifen Z-isomer (5 mg/kg; s.c.; daily; via extended-release pellet replaced every 90 days) combined with Ulipristal acetate (HY-16508) (16.7 mg/kg/day; s.c.; daily; via extended-release pellet replaced every 30 days) shows no improvement in breast cancer preventive efficacy compared to endoxifen monotherapy; this combination fails to significantly prolong tumor latency, decrease tumor burden, or suppress the expression of critical poor-prognosis genes[2].
Endoxifen Z-isomer (50 mg/kg; p.o.; daily; 4 weeks) demonstrates superior antitumor activity against Letrozole-resistant ER+ breast cancer xenografts, with potent suppression of proliferation marker Ki-67, ERα target genes, and Akt signaling[6].
Endoxifen Z-isomer (25-75 mg/kg; p.o.; daily; 28 days), administered as monotherapy or in combination with TMZ, does not significantly reduce tumor volume in a subcutaneous CRT435 GBM PDX athymic nude mouse model, despite being well tolerated[4].
Endoxifen Z-isomer (25-75 mg/kg; p.o.; daily; 4 weeks) exhibits superior antitumor activity against AI-sensitive ER+ breast cancer xenografts, with the 75 mg/kg dose also outperforming letrozole[6].
Endoxifen Z-isomer (50 mg/kg; p.o.; 5 days a week) exhibits potent, prolonged antitumor activity against Letrozole-resistant ER+ breast cancer xenografts[6].
Endoxifen Z-isomer (10-50 mg/kg) at 10 mg/kg and 50 mg/kg exerts beneficial skeletal effects and modulates uterine gene expression in intact and ovariectomized Sprague-Dawley rats[7].
MedChemExpress (MCE) has not independently confirmed the accuracy of these methods. They are for reference only.
-
Animal Model:C3(1)-TAg (FVB/NJ × FVB/C3(1)-TAg) (female, 8 weeks old)[2]
-
Dosage:5 mg/kg
-
Administration:s.c.; daily; via extended-release pellet replaced every 90 days
-
Result:Produced a tumor penetrance of 92% (11/12 mice) with a significant increase in tumor latency to 111 days compared to untreated controls.
Reduced median tumor burden by 76% to 0.273 cm3 and reduced median tumor multiplicity by 63% to 3 tumors per animal compared to controls.
Reduced mammary intraepithelial neoplasia (MIN) multiplicity in tumor-bearing glands by 43% to 4 lesions per gland, and had the highest proportion of mice with at least one tumor-free gland (92%, 11/12 mice).
Induced a nonsignificant 17% decline in pHH3 labeling index (cell proliferation marker) in MIN lesions (7.2 vs. 8.7) and 23% decrease in benign tissue (7 vs. 9.1) compared to controls.
Significantly downregulated 39% (43/111) of a panel of target genes, including 24 genes unique to endoxifen therapy; these genes mapped to downregulated biological pathways including cell cycle, oocyte meiosis, E2F transcription factor network, cytokine-cytokine receptor interaction, EGF/EGFR signaling pathway, and integrated breast cancer pathway.
Also significantly downregulated genes associated with poor breast cancer prognosis (Col11a1, Il17b, Pdgfa, Tnfrsf11a).
Median plasma endoxifen concentration was 8.7 ng/mL (22.4 nM).
-
Animal Model:C3(1)-TAg (FVB/NJ × FVB/C3(1)-TAg) (female, 8 weeks old)[2]
-
Dosage:5 mg/kg/day endoxifen + 16.7 mg/kg/day ulipristal acetate
-
Administration:s.c.; daily; endoxifen via extended-release pellet replaced every 90 days, ulipristal acetate via extended-release pellet replaced every 30 days
-
Result:Produced a tumor penetrance of 88% (7/8 mice) with a nonsignificant increase in tumor latency to 108 days and nonsignificant 59% reduction in median tumor burden to 0.45 cm3 compared to controls.
Did not significantly affect tumor multiplicity (9 vs. 8 tumors per animal) or MIN multiplicity in tumor-bearing glands (6 vs. 7 lesions per gland).
Induced a reduction in pHH3 labeling index in tumor-free glands, which was significantly less effective than endoxifen monotherapy.
Modulated 32% (36/111) of a panel of target genes, with 75% overlap with endoxifen-modulated genes; unlike endoxifen monotherapy, it did not repress several genes associated with poor prognosis (Dbc1, Il17b, Il24, Pdgfa, Serpina5, Tnfrsf11a).
Median plasma endoxifen concentration was 12 ng/mL (31.3 nM), significantly higher than in mice treated with tamoxifen alone.
-
Animal Model:athymic nude mice (female, 6-12 weeks old, average weight ~26 g, implanted subcutaneously with CRT435 patient-derived xenograft tumor)[4]
-
Dosage:25 mg/kg; 50 mg/kg; 75 mg/kg
-
Administration:p.o.; daily; 28 days
-
Result:Did not produce significant tumor growth reduction compared to vehicle control group.
Did not produce significant tumor regression when combined with intratumoral TMZ compared to vehicle control group.
Showed no significant impact on mouse body weight over the 28-day study period.
-
Animal Model:BALB/c athymic nude mice (4-6-week-old, ovariectomized female, subcutaneous xenograft of MCF7AC1 aromatase-expressing ER+ breast cancer cells, supplemented with 1.4-mg 90-day-release estrogen pellets)[6]
-
Dosage:25 mg/kg; 75 mg/kg
-
Administration:p.o.; daily; 4 weeks
-
Result:Significantly reduced tumor volumes compared to control and tamoxifen at 4 weeks.
Yielded plasma concentrations of 11.8 ng/mL (25 mg/kg) and 391.3 ng/mL (75 mg/kg) at 2 weeks.
Significantly reduced murine body weight at 4 weeks (75 mg/kg dose).
Was superior to letrozole at 75 mg/kg dose.
-
Animal Model:Athymic nude mice (ovariectomized female, subcutaneous xenograft of letrozole-resistant MCF7LR ER+ breast cancer cells derived from MCF7AC1 tumors)[6]
-
Dosage:50 mg/kg
-
Administration:p.o.; daily; 4 weeks
-
Result:Significantly reduced tumor volume compared to tamoxifen.
Significantly suppressed nuclear Ki-67 expression compared to letrozole-treated MCF7LR tumors.
Downregulated ERα target genes AREG (-3.2 fold), PGR (-4.8 fold, p = 4.34×10⁻⁸), and TFF1 (-6.8 fold).
Reduced p-Akt protein levels in tumor tissue.
-
Animal Model:Athymic nude mice (6-7-week-old, ovariectomized female, subcutaneous xenograft of MCF7LR ER+ breast cancer cells, supplemented with 100 μg/day androstenedione 5 days a week)[6]
-
Dosage:50 mg/kg
-
Administration:p.o.; 5 days a week
-
Result:Potently inhibited tumor growth over 9 weeks (63 days), with antitumor activity superior to letrozole and exemestane (p = 0.03), and not significantly different from exemestane plus everolimus or fulvestrant.
Reduced mean tumor volume compared to letrozole, which failed to inhibit growth, and delayed tumor growth beyond the 23-week time point seen with exemestane plus everolimus.
Significantly reduced body weight, which was mitigated by oral nutritional supplement.


Chemical Information
-
CAS No. 112093-28-4
-
Appearance Solid
-
Molecular Weight 373.49
-
Formula C25H27NO2
-
Color White to off-white
-
SMILES
OC1=CC=C(/C(C2=CC=C(OCCNC)C=C2)=C(C3=CC=CC=C3)\CC)C=C1
-
Shipping
Room temperature in continental US; may vary elsewhere.
-
Storage
Powder -20°C 3 years 4°C 2 years In solvent -80°C 6 months -20°C 1 month


Publications (3)
-
Journal Impact Factor
-
Most Recent
-
Sci Rep
Preliminary results using a kit to measure tamoxifen and metabolites concentrations in capillary blood samples from women with breast cancer. [Abstract]2022 Jan 31;12(1):1643. PMID: 35102224 -
J Chromatogr B Analyt Technol Biomed Life Sci
Simultaneous determination of 11 oral targeted antineoplastic drugs and 2 active metabolites by LC-MS/MS in human plasma and its application to therapeutic drug monitoring in cancer patients. [Abstract]2024 Apr 15:1237:124100. PMID: 38547701 -


Solvent & Solubility
In Vitro:
DMSO : 83.33 mg/mL (223.11 mM; Need ultrasonic; Hygroscopic DMSO has a significant impact on the solubility of product, please use newly opened DMSO)
Please refer to the solubility information to select the appropriate solvent. Once prepared, please aliquot and store the solution to prevent product inactivation from repeated freeze-thaw cycles.
Storage method and period of stock solution: -80°C, 6 months; -20°C, 1 month. When stored at -80°C, please use it within 6 months. When stored at -20°C, please use it within 1 month.
Please refer to the solubility information to select the appropriate solvent. Once prepared, please aliquot and store the solution to prevent product inactivation from repeated freeze-thaw cycles.
Storage method and period of stock solution: -80°C, 6 months; -20°C, 1 month. When stored at -80°C, please use it within 6 months. When stored at -20°C, please use it within 1 month.
Concentration (start) × Volume (start) = Concentration (final) × Volume (final)
In Vivo:
Select the appropriate dissolution method based on your experimental animal and administration route.
- For the following dissolution methods, please ensure to first prepare a clear stock solution using an In Vitro approach and then sequentially add co-solvents:
- To ensure reliable experimental results, the clarified stock solution can be appropriately stored based on storage conditions. As for the working solution for In Vivo experiments, it is recommended to prepare freshly and use it on the same day.
- The percentages shown for the solvents indicate their volumetric ratio in the final prepared solution. If precipitation or phase separation occurs during preparation, heat and/or sonication can be used to aid dissolution.
Add each solvent one by one: 10% DMSO 40% PEG300 5% Tween-80 45% Saline
Solubility: ≥ 2.5 mg/mL (6.69 mM); Clear solution
This protocol yields a clear solution of ≥ 2.5 mg/mL (saturation unknown).
Taking 1 mL working solution as an example, add 100 μL DMSO stock solution (25.0 mg/mL) to 400 μL PEG300, and mix evenly; then add 50 μL Tween-80 and mix evenly; then add 450 μL Saline to adjust the volume to 1 mL.
Preparation of Saline: Dissolve 0.9 g sodium chloride in ddH₂O and dilute to 100 mL to obtain a clear Saline solution.
In Vivo Dissolution Calculator
Please enter the basic information of animal experiments:
-
-
-
-
Recommended: Prepare an additional quantity of animals to account for potential losses during experiments.
Please enter your animal formula composition:
-
%DMSO +
Recommended: Keep the proportion of DMSO in working solution below 2% if your animal is weak.
-
%+
-
+%Tween-80 + +
-
%Saline +
The co-solvents required include: DMSO, . All of co-solvents are available by MedChemExpress (MCE). , Tween 80. All of co-solvents are available by MedChemExpress (MCE).
Working solution concentration: 0.22 mg/mL
Method for preparing stock solution: mg drug dissolved in μL DMSO. Stock solution concentration: mg/mL.
1. Take μL DMSO stock solution;
2. Add μL .
μL , mix evenly;
3. Then add μL Tween 80, mix evenly;
4. Then add μL
Please ensure that the stock solution in the first step is dissolved to a clear state, and add co-solvents in sequence. You can use ultrasonic heating (ultrasonic cleaner, recommended frequency 20-40 kHz), vortexing, etc. to assist dissolution.

Protocols
-
RNA extraction experimental
By lysing cells, releasing RNA, and removing impurities such as proteins and DNA, high-purity RNA products are finally obtained. The commonly used traditional method is the guanidine isothiocyanate/phenol/chloroform method (Trizol), which is suitable for a variety of animal materials including animal tissues, microorganisms, cultured cells, etc., and most plant materials.
-
Collagen: Sirius Red Staining
Sirius Red or picrosirius red staining is a histochemical method for visualizing collagen-rich extracellular matrix in tissue sections, and collagen fibers are detected as red-stained structures under bright-field microscopy with enhanced birefringence under polarized light. Picrosirius red is useful for assessing total collagen organization, distribution, and fibrosis burden, but polarized color should not be interpreted as a definitive collagen type I versus type III readout because color is affected by fiber orientation, thickness, and packing.
-
Somatic Cell Culture
A method of simulating the in vivo environment in vitro to maintain the cell growth, differentation and main functions.
-
ECM-Embedded Organoid (Matrigel/Dome) Culture
ECM-embedded organoid dome culture embeds epithelial stem cells, crypts, organoid fragments, or tumor-derived epithelial cells in a basement-membrane-like hydrogel such as Matrigel, allowing 3D growth, self-organization, lumen formation, budding or cystic morphogenesis, and lineage maintenance under defined niche-factor-containing medium. The primary readouts are organoid establishment efficiency, growth, morphology, passaging capacity, lineage-marker expression, and, when fluorescently labeled lines are used, microscopy- or flow-cytometry-based quantification of population behavior in 3D culture.
-
Breast Cancer Modeling
Breast cancer is a heterogeneous cancer, and it has been distinguished into four subtypes: luminal A, luminal B, HER2-positive and basal-like. Molecular mutations, epigenetic alterations, hormone exposure and immune microenvironment are related to the progression of breast cancer.
-
Apoptosis
Apoptosis, also called programmed cell death, is generally characterized by distinct morphological characteristics.
-
TUNEL staining for apoptotic DNA fragmentation
TUNEL staining detects DNA strand breaks by using terminal deoxynucleotidyl transferase to add labeled nucleotides to exposed 3′-OH DNA termini, generating either microscopic staining in fixed cells or tissue sections, or fluorescence/cytometric signal in cell suspensions. TUNEL positivity reflects DNA fragmentation but should not be interpreted alone as definitive apoptosis, because TUNEL can also label necrotic, autolytic, mechanically damaged, or DNA-repair-associated DNA breaks.
-
Cell Cytotoxicity Assay
Cytotoxicity assays are usually based on the assessment of cell membrane damage, which can also be indirectly detected by measuring cell viability. Detection methods include MTT assay, CKK-8 assay, LDH assay and ATP assay, etc.
-
Flow cytometric DNA-content cell-cycle staining
Flow cytometric DNA-content cell-cycle staining measures the fluorescence intensity of DNA-bound fluorochromes in single cells or nuclei to estimate DNA content distributions, allowing assignment of populations to G0/G1, S, and G2/M phases by DNA histogram deconvolution. Propidium iodide (PI) intercalates into DNA, and PI fluorescence is proportional to cellular DNA content when staining is performed under conditions that make DNA accessible and minimize non-DNA signal. Cells with G2/M DNA content are expected to show approximately twice the fluorescence intensity of G0/G1 cells, while S-phase cells occupy intermediate fluorescence values. PI-based DNA-content analysis can also detect cells with fractional DNA content, often reported as sub-G1, when DNA fragmentation and extraction during staining reduce retained DNA signal in apoptotic cells. DAPI is an alternative DNA fluorochrome for univariate DNA-content analysis, while bivariate approaches combining DNA content with proliferation
-
Research Protocol for Endocrine Diseases
Endocrine diseases often arise from disrupted hormone production, hormone signaling, or target-tissue responsiveness; for diabetes-focused endocrine disease models, insulin signaling regulates glucose uptake, hepatic glucose output, lipid metabolism, and β-cell compensation. Type 2 diabetes develops through interacting defects in insulin resistance, β-cell dysfunction, adipose inflammation, hepatic glucose overproduction, altered incretin signaling, and ectopic lipid metabolism. A major unresolved question is whether endocrine dysfunction is driven primarily by target-tissue insulin resistance, intrinsic β-cell failure, immune/inflammatory stress, or combined multi-organ failure that differs by disease stage.
-
Apoptosis Solutions
Apoptosis is a regulated, generally non-lytic cell-death pathway that removes unwanted, damaged, infected, or abnormal cells through coordinated morphological changes, caspase activation, DNA fragmentation, and membrane remodeling. The intrinsic apoptosis pathway is controlled mainly by mitochondrial outer membrane permeabilization, BCL-2 family proteins, cytochrome c release, apoptosome formation, caspase-9 activation, and downstream executioner caspase-3/7 activation. The extrinsic apoptosis pathway is initiated by death receptors such as Fas, TNFR, and TRAIL receptors, which recruit adaptor proteins and activate caspase-8 before engaging executioner caspases or mitochondrial amplification through BID cleavage. Apoptosis is linked to many phenotypes, including cancer cell killing, tissue homeostasis, immune regulation, neurodegeneration, infection response, and treatment-induced cytotoxicity; unresolved questions include how apoptosis interacts with necroptosis, pyroptosis, ferroptos
-
Matrigel/ECM Transwell Invasion Assay
The Matrigel/ECM Transwell invasion assay measures the ability of cells to move toward a chemoattractant while crossing an extracellular-matrix barrier placed on a porous membrane; therefore, the readout reflects both chemotactic motility and matrix invasion rather than migration alone. Matrigel is a basement-membrane-rich matrix derived from Engelbreth-Holm-Swarm mouse sarcoma and has been used as a reconstituted basement membrane barrier in chemoinvasion assays. The assay readout is generated by quantifying cells that reach the underside of the insert membrane or lower compartment after incubation, commonly by staining and counting invaded cells or by fluorescence-based quantification.
-
MTT Cell Proliferation Assay
The MTT assay is a colorimetric endpoint assay for estimating viable cell number, cell growth, cytotoxicity, or cell activation in cultured mammalian cells. Living cells reduce the yellow tetrazolium salt MTT into purple/blue formazan, while dead cells do not generate the same signal; the resulting color can be quantified with a multiwell spectrophotometer. MTT reduction is commonly interpreted as a readout of metabolic activity that often correlates with viable cell number, but it should not be treated as a direct cell-counting method unless the assay is optimized for the cell type and experimental condition. Studies show that MTT reduction can involve mitochondrial and non-mitochondrial reducing systems, and formazan may accumulate in intracellular lipid droplets rather than simply marking mitochondria.
-
Annexin V plus membrane-impermeant dye apoptosis staining
Annexin V-based apoptosis assays rely on the detection of phosphatidylserine (PS) externalization from the inner leaflet of the plasma membrane to the outer leaflet, an early biochemical hallmark of apoptosis. Fluorescently labeled Annexin V binds PS in a calcium-dependent manner, enabling identification of early apoptotic cells by flow cytometry or fluorescence microscopy. When combined with a membrane-impermeant DNA-binding dye (e. g. , propidium iodide), this approach allows discrimination between viable (Annexin V−/dye−), early apoptotic (Annexin V+/dye−), and late apoptotic or necrotic (Annexin V+/dye+) cell populations by assessing membrane integrity and PS exposure.
-
BrdU Incorporation Assay
Bromodeoxyuridine (BrdU) incorporation assay is based on the principle that BrdU, a thymidine analog, is incorporated into newly synthesized DNA during the S phase of the cell cycle, thereby serving as a marker of DNA replication and cellular proliferation. Incorporated BrdU can be detected using anti-BrdU antibodies following DNA denaturation, enabling visualization or quantification of proliferating cells through immunochemical detection methods such as immunofluorescence or immunohistochemistry.
-
ROS/oxidative-stress fluorescent staining
ROS/oxidative-stress fluorescent staining uses cell-permeant fluorogenic probes that become fluorescent after oxidation inside cells or tissues; commonly used examples include DCFH-DA/DCFDA for broad cellular oxidant detection, DHE for superoxide-related signal detection, MitoSOX for mitochondrial superoxide-related signal detection, and CellROX probes for oxidative-stress-associated fluorescence readouts. The assay detects probe oxidation rather than a single ROS species unless the probe and analysis method have been chemically validated for that species. DCFH-DA enters cells, is deacetylated by intracellular esterases to DCFH, and produces fluorescent DCF after oxidation, so the readout is used as an operational measure of total cellular oxidative stress rather than a species-specific ROS measurement. DHE and MitoSOX can report superoxide-related oxidation, but red fluorescence alone can include non-specific ethidium-like oxidation products; HPLC or optimized spectral approaches are
-
CFSE Dye Dilution Proliferation Assay
The CFSE (carboxyfluorescein diacetate succinimidyl ester) dye dilution proliferation assay is based on the covalent labeling of intracellular proteins by a cell-permeant fluorescent dye that becomes fluorescent upon intracellular ester cleavage and then is stably retained within cells. As labeled cells divide, the dye is partitioned equally between daughter cells, resulting in a stepwise halving of fluorescence intensity that can be quantified by flow cytometry to determine the number of cell divisions undergone by each cell population. This fluorescence dilution approach enables quantitative tracking of lymphocyte proliferation at the single-cell level over multiple rounds of division. CFSE-based proliferation analysis has been widely applied to measure antigen-driven lymphocyte expansion in vitro, where discrete fluorescence peaks correspond to successive cell divisions and allow reconstruction of proliferative history within heterogeneous populations.
-
Dye-dilution cell tracking and proliferation staining
Dye-dilution cell tracking assays quantify cell proliferation by covalently labeling intracellular proteins with a stable fluorescent dye that is equally partitioned between daughter cells during mitosis, resulting in stepwise halving of fluorescence intensity with each cell division as measured by flow cytometry histograms. Carboxyfluorescein diacetate succinimidyl ester (CFSE) is a prototypical dye that diffuses into cells, is enzymatically converted into a fluorescent compound, and then covalently binds intracellular amine groups, producing long-lived fluorescence suitable for tracking multiple rounds of division in vitro and in vivo. Successive generations of dividing cells form discrete peaks of decreasing fluorescence intensity, enabling estimation of proliferation history, precursor frequency, and division index within heterogeneous populations. Alternative dyes such as CellTrace Violet (CTV) and far-red membrane dyes (e. g. , PKH26) follow the same dilution principle but differ
-
Patient-Derived Orthotopic Xenograft (PDOX)
Patient-derived orthotopic xenograft (PDOX) modeling implants fresh patient tumor tissue or patient-derived tumor cells into the anatomically corresponding organ or tissue site of immunodeficient mice, usually by surgical orthotopic implantation, to preserve patient tumor histology, local microenvironmental context, invasion, metastatic behavior, and treatment-response features better than subcutaneous implantation. PDOX readouts include tumor engraftment, orthotopic tumor growth, local invasion, metastasis, recurrence after resection, histologic similarity to the donor tumor, biomarker retention, molecular concordance, survival, and response or resistance to therapy. PDOX models are used for preclinical drug testing and individualized therapy evaluation, but engraftment success varies by tumor type and specimen quality.
-
Protocol for Cell Cycle
Cell-cycle analysis by flow cytometry measures DNA content in single cells to estimate the fraction of cells in G0/G1, S, and G2/M phases. Propidium iodide intercalates into DNA, and after RNA removal with RNase, fluorescence intensity reflects cellular DNA content: 2N cells are assigned to G0/G1, cells between 2N and 4N to S phase, and 4N cells to G2/M. DNA-content analysis alone cannot reliably separate G0 from G1 or G2 from M. Ki-67 can distinguish quiescent G0 cells from cycling cells, EdU or BrdU incorporation marks active DNA synthesis in S phase, and phospho-histone H3 staining identifies mitotic cells within the 4N population.
-
CCK-8/WST-8 Cell Proliferation Assay
The CCK-8/WST-8 assay is based on the reduction of the water-soluble tetrazolium salt WST-8 to a water-soluble formazan product by cellular dehydrogenases in metabolically active cells, where the generated formazan amount is proportional to the number of living cells and is quantified by measuring absorbance in the visible range, providing a colorimetric readout for cell viability and proliferation assessment. This class of tetrazolium-based assays improves upon earlier MTT-based systems by producing a water-soluble formazan, eliminating the need for organic solubilization steps and enabling direct spectrophotometric measurement in culture medium.
-
Cell Counting-Based Growth Curve Assay
Cell counting-based growth curve assays quantify cell proliferation by directly measuring changes in viable cell number over time using manual or automated counting methods such as hemocytometer-based counting or instrument-assisted cell enumeration, enabling construction of growth curves that reflect population expansion dynamics in response to culture conditions. A widely used approach is trypan blue exclusion with hemocytometer counting, where membrane-compromised (non-viable) cells take up the dye, allowing discrimination between viable and non-viable cells while simultaneously enabling total cell number quantification. Repeated sampling across time points allows estimation of proliferation rate, growth phases, and comparative growth kinetics between experimental conditions.
-
Colony Formation (Clonogenic) Assay
The clonogenic (colony formation) assay measures the ability of a single cell to retain reproductive viability and form a macroscopic colony, typically defined as a cluster derived from one progenitor cell after a defined growth period. This assay is widely used to evaluate cell survival after exposure to ionizing radiation or cytotoxic treatments and is considered a standard method in radiation biology for generating dose-response relationships of reproductive cell death. Colony formation reflects long-term proliferative capacity rather than short-term metabolic activity, and survival is quantified by comparing treated versus untreated conditions based on colony number and derived survival fractions.
-
Cell Viability Determination by MTT Colorimetric Assay
The following protocol uses the MTT colorimetric assay as a classic literature-established method for assessing cell viability/metabolic activity in cultured mammalian cells. MTT[3-(4,5-dimethylthiazol-2-yl)-2,5-diphenyltetrazolium bromide] is reduced by metabolically active cells to a colored formazan product; the amount of formazan is quantified spectrophotometrically and provides an indirect measure of metabolically active viable cells. Importantly, MTT reduction reflects cellular oxidoreductase/metabolic activity rather than an absolute direct count of living cells, so changes in cellular metabolism can alter the signal independently of cell number.
-
Matrigel Transwell/Boyden Chamber Invasion Assay
Matrigel Transwell/Boyden chamber invasion assay measures the ability of cells to degrade or traverse an extracellular matrix-coated porous membrane and move from an upper chamber toward a chemoattractant in a lower chamber. Invasion is distinguished from migration by coating the membrane with Matrigel or basement membrane matrix; uncoated inserts measure migration, while coated inserts require cells to cross an ECM barrier before reaching the underside of the membrane.
-
Fibrosis/Collagen Morphometry
Fibrosis and collagen morphometry is based on the quantitative visualization of fibrillar collagen deposition in tissue sections using histochemical stains such as Sirius Red (Picrosirius Red) or Masson's trichrome, followed by image-based or polarization-enhanced analysis to estimate collagen proportional area as a surrogate of extracellular matrix accumulation during fibrotic remodeling. Sirius Red combined with polarized light microscopy enhances detection of collagen fibers due to birefringence properties, enabling more specific visualization of collagen type I and III fibrils compared to conventional bright-field histology, while whole-section or region-restricted digital morphometry reduces field-selection bias in fibrosis assessment. Alternative quantitative approaches include second harmonic generation (SHG) and two-photon excited fluorescence microscopy, which enable label-free detection of fibrillar collagen and have been validated against histological staining and biochemica
-
EdU Incorporation Assay (Click Chemistry-Based DNA Synthesis Measurement)
The EdU incorporation assay measures DNA synthesis by adding the thymidine analog 5-ethynyl-2′-deoxyuridine to cells or tissues, where it is incorporated into newly synthesized DNA during S phase. Incorporated EdU is detected by copper-catalyzed azide-alkyne cycloaddition, in which a fluorescent azide covalently reacts with the ethynyl group on EdU, allowing S-phase cells to be detected by fluorescence microscopy, flow cytometry, or high-content imaging. EdU detection does not require DNA denaturation or anti-BrdU antibody access, which preserves sample structure and improves compatibility with immunostaining and multiparameter cytometry compared with BrdU-based detection. EdU can be cytotoxic in a cell-type- and exposure-dependent manner, so pulse duration, concentration, and continuous-labeling designs should be validated for each cell type.
-
Ki-67 Immunostaining Proliferation Assay
Ki-67 immunostaining measures the growth fraction of a cell population by detecting Ki-67, a nuclear antigen present in proliferating cells and absent in quiescent G0 cells. The readout is the percentage of Ki-67-positive nuclei among total counted cells, commonly called the Ki-67 labeling index or proliferation index.
-
PCNA Immunodetection Proliferation Assay
PCNA immunodetection measures proliferative activity by detecting proliferating cell nuclear antigen, a nuclear protein associated with DNA polymerase δ function and DNA replication. The assay readout is the proportion of PCNA-positive nuclei among total counted cells, but PCNA labeling is not identical to BrdU labeling because PCNA can mark late G1/early S-associated replication competence and may persist beyond active DNA synthesis depending on fixation and extraction conditions.
-
Protocol for Cell Counting and Cell Density Analysis
Cell counting and cell-density analysis estimate the number of cells in a known volume or field area. Manual hemocytometer counting uses a chamber of defined geometry to convert counted cells into cells/mL, while automated counters and image-analysis workflows detect cell objects from optical, brightfield, fluorescence, impedance, or digital-image features. Trypan blue viability counting is based on dye exclusion: viable cells with intact membranes exclude dye, while non-viable cells with compromised membranes stain blue. The readout is total cell density, viable-cell density, dead-cell density, and percent viability. Cell density can also be estimated from microscopy images by counting objects per image area, from flow cytometry using calibrated volume or reference particles, or from in situ microscopy in bioreactors after calibration against reference methods such as hemocytometer or flow cytometry.
-
Patient-Derived Xenograft (PDX)
Patient-derived xenograft (PDX) models are generated by engrafting primary human tumor tissue directly into immunodeficient mice, allowing in vivo propagation of patient tumor biology without initial in vitro adaptation. These models are used to preserve key histopathological and molecular characteristics of the original tumor and enable assessment of tumor growth dynamics and therapeutic response in a living organism. The biological readout is tumor engraftment and subsequent growth in the murine host, which reflects the ability of human tumor cells to survive, vascularize, and expand in an immunocompromised microenvironment.
-
Subcutaneous Cell-Line-Derived Xenograft
Subcutaneous cell-line-derived xenograft (CDX) models are established by implanting cultured human cancer cell lines into immunodeficient mice, where the injected cells form localized tumors that can be monitored in vivo as a measure of tumorigenic potential, growth kinetics, and treatment response. These models are widely used in oncology research because they allow reproducible tumor formation and enable comparative assessment of tumor growth between different cell lines or genetic manipulations in a controlled in vivo microenvironment. Subcutaneous implantation of cancer cells in immunodeficient mice is a standard approach for evaluating tumor growth behavior and therapeutic response across multiple cancer types, including prostate, esophageal, pancreatic, and colon cancer models.
-
Orthotopic Cell-Line Xenograft
Orthotopic cell-line xenograft models involve implantation of human cancer cell lines into the anatomically corresponding organ of immunodeficient mice to reproduce tumor growth within a native microenvironment, enabling more clinically relevant tumor behavior compared with subcutaneous models. These models are widely used because orthotopic placement better recapitulates tumor progression, including invasion and metastatic spread, which are often underrepresented in heterotopic implantation systems. Compared with conventional xenografts, orthotopic implantation is described as more technically complex but provides improved simulation of tumor-microenvironment interactions and metastatic behavior, making it particularly valuable for translational oncology research. Surgical orthotopic implantation approaches have been emphasized as enabling faithful reproduction of clinical cancer features, including metastasis and disease progression patterns that align with the tumor’s organ of origi


Purity & Documentation
-
Data Sheet (312 KB)
-
SDS (398 KB)
- English - EN (398 KB)
- Français - FR (398 KB)
- Deutsch - DE (398 KB)
- Norwegian - NO (398 KB)
- Español - ES (398 KB)
- Swedish - SV (398 KB)
- Italian - IT (398 KB)
- Korean - KR (398 KB)
- Portuguese - PT (398 KB)
-
Handling Instructions (2659 KB)
References
[1]. Elkins P, et al. Characterization of the isomeric configuration and impurities of (Z)-endoxifen by 2D NMR, high resolution LC⬜MS, and quantitative HPLC analysis. Journal of pharmaceutical and biomedical analysis. 2014 Jan;88:174-9. [Content Brief]
[2]. Lee O, et al. Z-Endoxifen prevents aggressive mammary cancers in mice by inhibiting cell proliferation and creating a tumor suppressive microenvironment. Biomedicine & pharmacotherapy = Biomedecine & pharmacotherapie. 2023 Jun;162:114607. [Content Brief]
[3]. Jayaraman S, et al. Endoxifen, an Estrogen Receptor Targeted Therapy: From Bench to Bedside. Endocrinology. 2021 Dec 01;162(12):bqab191. [Content Brief]
[4]. Shneyderman A, et al. Evaluation of (Z)-endoxifen as a potential therapy for glioblastoma multiforme through computational and experimental analyses. Scientific reports. 2025 Oct 31;15(1):38225. [Content Brief]
[5]. Nardin JM, et al. The Influences of Adherence to Tamoxifen and CYP2D6 Pharmacogenetics on Plasma Concentrations of the Active Metabolite (Z)-Endoxifen in Breast Cancer. Clinical and translational science. 2020 Mar;13(2):284-292. [Content Brief]
[6]. Jayaraman S, et al. Antitumor activity of Z-endoxifen in aromatase inhibitor-sensitive and aromatase inhibitor-resistant estrogen receptor-positive breast cancer. Breast cancer research : BCR. 2020 May 19;22(1):51. [Content Brief]
[7]. Jayaraman S, et al. Endoxifen downregulates AKT phosphorylation through protein kinase C beta 1 inhibition in ERα+ breast cancer. NPJ breast cancer. 2023 Dec 19;9(1):101. [Content Brief]
[8]. Sanchez-Spitman AB, et al. Clinical pharmacokinetics and pharmacogenetics of tamoxifen and endoxifen. Expert review of clinical pharmacology. 2019 Jun;12(6):523-536. [Content Brief]
[9]. Goetz MP, et al. First-in-Human Phase I Study of the Tamoxifen Metabolite Z-Endoxifen in Women With Endocrine-Refractory Metastatic Breast Cancer. Journal of clinical oncology : official journal of the American Society of Clinical Oncology. 2017 Oct 20;35(30):3391-3400. [Content Brief]
[10]. Takebe N, et al. Phase 1 study of Z-endoxifen in patients with advanced gynecologic, desmoid, and hormone receptor-positive solid tumors. Oncotarget. 2021 Feb 16;12(4):268-277. [Content Brief]


Complete Stock Solution Preparation Table
Please refer to the solubility information to select the appropriate solvent. Once prepared, please aliquot and store the solution to prevent product inactivation from repeated freeze-thaw cycles.
Storage method and period of stock solution: -80°C, 6 months; -20°C, 1 month. When stored at -80°C, please use it within 6 months. When stored at -20°C, please use it within 1 month.
| Optional Solvent | Concentration Solvent Mass | 1 mg | 5 mg | 10 mg | 25 mg |
|---|---|---|---|---|---|
| DMSO | 1 mM | 2.6774 mL | 13.3872 mL | 26.7745 mL | 66.9362 mL |
| 5 mM | 0.5355 mL | 2.6774 mL | 5.3549 mL | 13.3872 mL | |
| 10 mM | 0.2677 mL | 1.3387 mL | 2.6774 mL | 6.6936 mL | |
| 15 mM | 0.1785 mL | 0.8925 mL | 1.7850 mL | 4.4624 mL | |
| 20 mM | 0.1339 mL | 0.6694 mL | 1.3387 mL | 3.3468 mL | |
| 25 mM | 0.1071 mL | 0.5355 mL | 1.0710 mL | 2.6774 mL | |
| 30 mM | 0.0892 mL | 0.4462 mL | 0.8925 mL | 2.2312 mL | |
| 40 mM | 0.0669 mL | 0.3347 mL | 0.6694 mL | 1.6734 mL | |
| 50 mM | 0.0535 mL | 0.2677 mL | 0.5355 mL | 1.3387 mL | |
| 60 mM | 0.0446 mL | 0.2231 mL | 0.4462 mL | 1.1156 mL | |
| 80 mM | 0.0335 mL | 0.1673 mL | 0.3347 mL | 0.8367 mL | |
| 100 mM | 0.0268 mL | 0.1339 mL | 0.2677 mL | 0.6694 mL |


Endoxifen (Z-isomer) Related Classifications
HY-18719 Related Classifications
 Powered by Bioz
Keywords
- Endoxifen (Z-isomer)
- 112093-28-4
- PKC
- Estrogen Receptor/ERR
- PI3K
- Akt
- mTOR
- Apoptosis
- Reactive Oxygen Species (ROS)
- CRT435 GBM cells
- glioblastoma multiforme
- ERα
- MCF7AC1 human breast cancer cells
- PKCβ1
- ERβ
- MCF7LR human breast cancer cells
- PI3K/AKT/mTORC1 signaling
- ER+ breast cancer
- MCF7 human ER+ breast cancer cells
- Inhibitor
- inhibitor
- inhibit