



IR-251
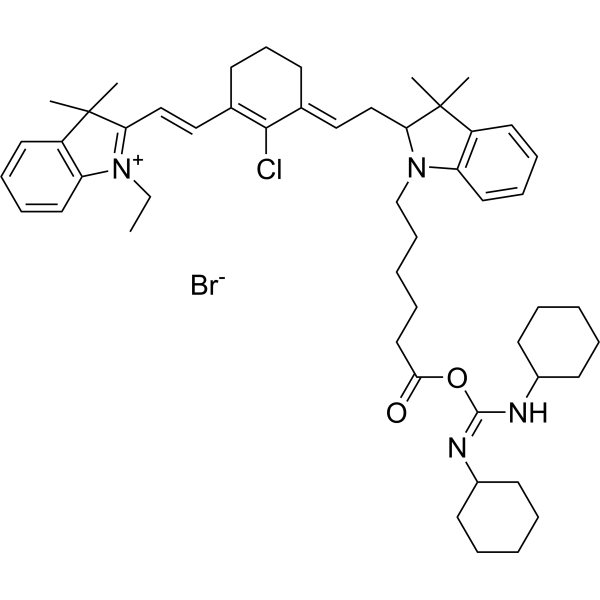
IR-251 is a mitochondrion-targeting NIR fluorescent probe. IR-251 targets mitochondria via OATPs and causes mitochondrial damage in tumor cells. IR-251 IR-251 induced ROS overproduction by inhibiting PPARγ, and then inhibiting the β-catenin signaling pathway and downstream protein molecules related to the cell cycle and metastasis. IR-251 inhibits tumor proliferation and metastasis.
For research use only. We do not sell to patients.
- Formula: C51H70BrClN4O2
- Molecular Weight:886.48
-
Storage:
Please store the product under the recommended conditions in the Certificate of Analysis.

To place orders, for customer services and technical support, please contact: MedChemExpress USA
Tel: 609-228-6898 E-mail: [email protected] [email protected]


-
 Biological Activity
-
Chemical Information
- Protocols
- Purity & Documentation
- References
-
 Help & FAQs




Biological Activity
Description


Chemical Information
-
Molecular Weight 886.48
-
Formula C51H70BrClN4O2
-
SMILES
CC1(C)C(/C=C/C2=C(Cl)/C(CCC2)=C/CC3N(CCCCCC(O/C(NC4CCCCC4)=N/C5CCCCC5)=O)C(C=CC=C6)=C6C3(C)C)=[N+](CC)C7=C1C=CC=C7.[Br-]
-
Shipping
Room temperature in continental US; may vary elsewhere.
-
Storage
Please store the product under the recommended conditions in the Certificate of Analysis.

Protocols
-
Flow cytometric DNA-content cell-cycle staining
Flow cytometric DNA-content cell-cycle staining measures the fluorescence intensity of DNA-bound fluorochromes in single cells or nuclei to estimate DNA content distributions, allowing assignment of populations to G0/G1, S, and G2/M phases by DNA histogram deconvolution. Propidium iodide (PI) intercalates into DNA, and PI fluorescence is proportional to cellular DNA content when staining is performed under conditions that make DNA accessible and minimize non-DNA signal. Cells with G2/M DNA content are expected to show approximately twice the fluorescence intensity of G0/G1 cells, while S-phase cells occupy intermediate fluorescence values. PI-based DNA-content analysis can also detect cells with fractional DNA content, often reported as sub-G1, when DNA fragmentation and extraction during staining reduce retained DNA signal in apoptotic cells. DAPI is an alternative DNA fluorochrome for univariate DNA-content analysis, while bivariate approaches combining DNA content with proliferation
-
ROS/oxidative-stress fluorescent staining
ROS/oxidative-stress fluorescent staining uses cell-permeant fluorogenic probes that become fluorescent after oxidation inside cells or tissues; commonly used examples include DCFH-DA/DCFDA for broad cellular oxidant detection, DHE for superoxide-related signal detection, MitoSOX for mitochondrial superoxide-related signal detection, and CellROX probes for oxidative-stress-associated fluorescence readouts. The assay detects probe oxidation rather than a single ROS species unless the probe and analysis method have been chemically validated for that species. DCFH-DA enters cells, is deacetylated by intracellular esterases to DCFH, and produces fluorescent DCF after oxidation, so the readout is used as an operational measure of total cellular oxidative stress rather than a species-specific ROS measurement. DHE and MitoSOX can report superoxide-related oxidation, but red fluorescence alone can include non-specific ethidium-like oxidation products; HPLC or optimized spectral approaches are
-
BrdU Incorporation Assay
Bromodeoxyuridine (BrdU) incorporation assay is based on the principle that BrdU, a thymidine analog, is incorporated into newly synthesized DNA during the S phase of the cell cycle, thereby serving as a marker of DNA replication and cellular proliferation. Incorporated BrdU can be detected using anti-BrdU antibodies following DNA denaturation, enabling visualization or quantification of proliferating cells through immunochemical detection methods such as immunofluorescence or immunohistochemistry.
-
Protocol for Cell Cycle
Cell-cycle analysis by flow cytometry measures DNA content in single cells to estimate the fraction of cells in G0/G1, S, and G2/M phases. Propidium iodide intercalates into DNA, and after RNA removal with RNase, fluorescence intensity reflects cellular DNA content: 2N cells are assigned to G0/G1, cells between 2N and 4N to S phase, and 4N cells to G2/M. DNA-content analysis alone cannot reliably separate G0 from G1 or G2 from M. Ki-67 can distinguish quiescent G0 cells from cycling cells, EdU or BrdU incorporation marks active DNA synthesis in S phase, and phospho-histone H3 staining identifies mitotic cells within the 4N population.
-
Orthotopic Cell-Line Xenograft
Orthotopic cell-line xenograft models involve implantation of human cancer cell lines into the anatomically corresponding organ of immunodeficient mice to reproduce tumor growth within a native microenvironment, enabling more clinically relevant tumor behavior compared with subcutaneous models. These models are widely used because orthotopic placement better recapitulates tumor progression, including invasion and metastatic spread, which are often underrepresented in heterotopic implantation systems. Compared with conventional xenografts, orthotopic implantation is described as more technically complex but provides improved simulation of tumor-microenvironment interactions and metastatic behavior, making it particularly valuable for translational oncology research. Surgical orthotopic implantation approaches have been emphasized as enabling faithful reproduction of clinical cancer features, including metastasis and disease progression patterns that align with the tumor’s organ of origi
-
Cell Viability Determination by MTT Colorimetric Assay
The following protocol uses the MTT colorimetric assay as a classic literature-established method for assessing cell viability/metabolic activity in cultured mammalian cells. MTT[3-(4,5-dimethylthiazol-2-yl)-2,5-diphenyltetrazolium bromide] is reduced by metabolically active cells to a colored formazan product; the amount of formazan is quantified spectrophotometrically and provides an indirect measure of metabolically active viable cells. Importantly, MTT reduction reflects cellular oxidoreductase/metabolic activity rather than an absolute direct count of living cells, so changes in cellular metabolism can alter the signal independently of cell number.


Purity & Documentation
References

Calculators
Concentration (start) × Volume (start) = Concentration (final) × Volume (final)


IR-251 Related Classifications
HY-155062 Related Classifications
 Powered by Bioz