



Enniatin B

Based on 1 Customer Validation
Enniatin B is a Fusarium mycotoxin that acts as an ionophore to form cation-selective membrane channels, disrupt ion homeostasis and mitochondrial function, inhibit cell proliferation, and induce apoptosis, while modulating ERK, p38 MAPK, and STAT3 signaling pathways. Enniatin B is used in research on atherosclerosis, hypercholesterolemia, cervical cancer, and colon adenocarcinoma.
For research use only. We do not sell to patients.
- Purity : 99.86%
- CAS No.: 917-13-5
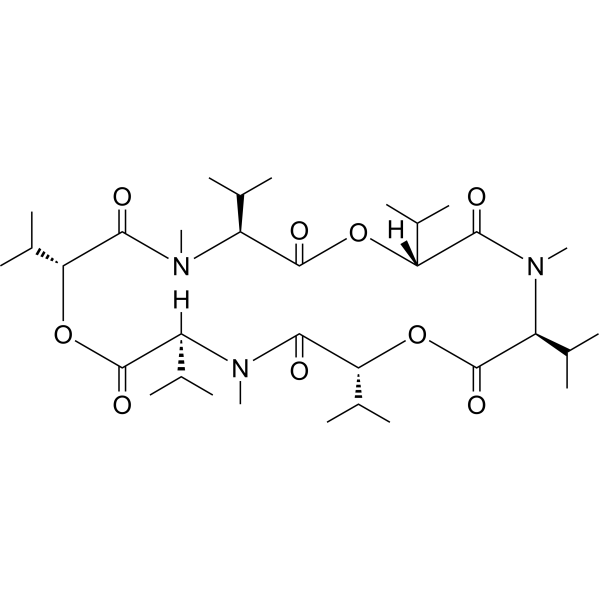
- Formula: C33H57N3O9
- Molecular Weight:639.82
-
Storage:Powder -20°C, 3 years , 4°C, 2 years ; In solvent -80°C, 6 months , -20°C, 1 month

To place orders, for customer services and technical support, please contact: MedChemExpress USA
Tel: 609-228-6898 E-mail: [email protected] [email protected]


-
 Biological Activity
-
Chemical Information
-
Solvent & Solubility
- Protocols
- Purity & Documentation
- References
-
 Help & FAQs


-

HY-N6706
Enniatin complexIonophore -
HY-N3807
Enniatin B1ACAT Inhibitor -
HY-119764
IkarugamycinClathrin-Mediated Endocytosis -
HY-12643
EprinomectinEndectocide -
HY-114936
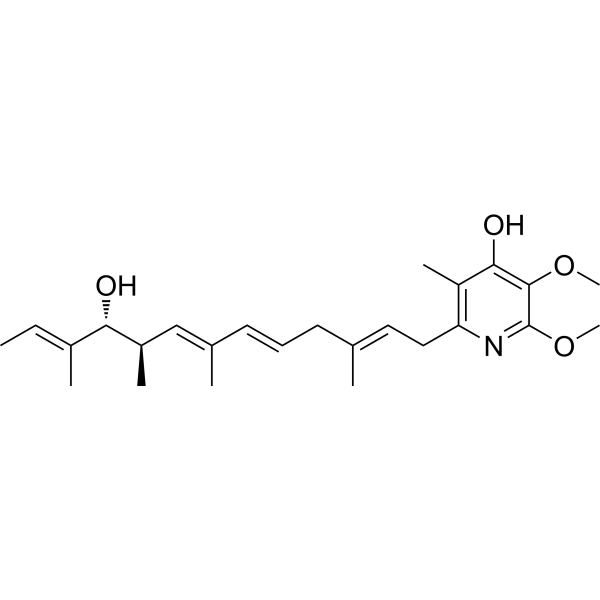
Piericidin AMitochondrial Complex I Inhibitor -
HY-12643R
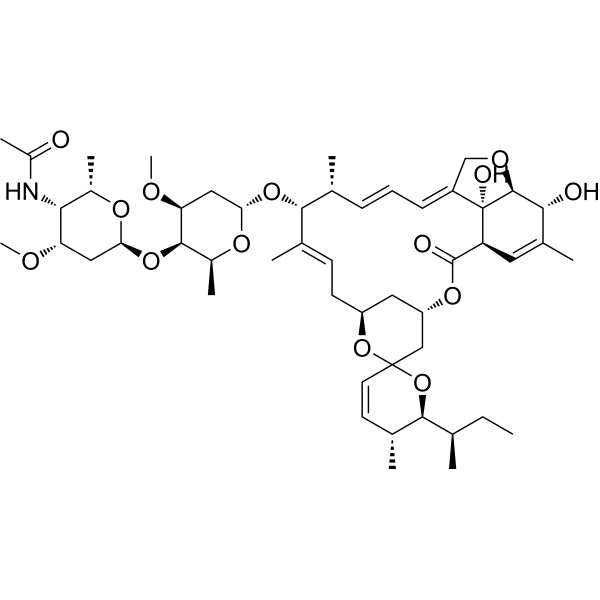
Eprinomectin (Standard)Endectocide -

HY-N8483
Eprinomectin B1aEprinomectin Metabolite -
HY-B1327A
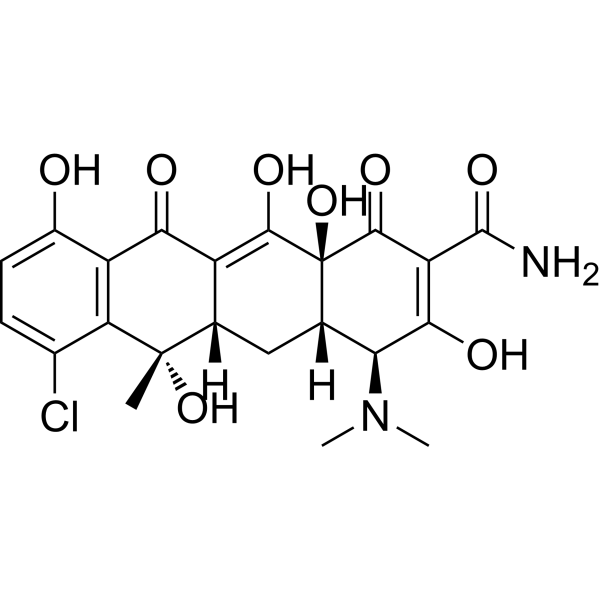
ChlortetracyclineCalcium Ionophore Antibiotic, Methanogenic Bacteria Inhibitor


Biological Activity
Description
IC50 & Target
[11]|
ERK |
p38 MAPK |
STAT3 |
Cellular Effect
|
Cell Line

|
Type | Value | Description | References |
|---|---|---|---|---|
| BALB/3T3 | ED50 |
8.4 μM
|
Reduction of intracellular ATP levels in mouse embryo fibroblast Balb 3T3 (clone A31) cells incubated for 24 h measured by ViaLight Plus ATP bioassay.
Reduction of intracellular ATP levels in mouse embryo fibroblast Balb 3T3 (clone A31) cells incubated for 24 h measured by ViaLight Plus ATP bioassay.
|
27163883 |
| HepG2 | ED50 |
2.9 μM
|
Reduction of intracellular ATP levels in human hepatocellular carcinoma HepG2 cells incubated for 24 h measured by ViaLight Plus ATP bioassay.
Reduction of intracellular ATP levels in human hepatocellular carcinoma HepG2 cells incubated for 24 h measured by ViaLight Plus ATP bioassay.
|
27163883 |
| BALB/3T3 | ED50 |
4.24 μM
|
Inhibition of cell proliferation (DNA synthesis) in mouse embryo fibroblast Balb 3T3 cells incubated for 24 h measured by BrdU ELISA chemiluminescent assay.
Inhibition of cell proliferation (DNA synthesis) in mouse embryo fibroblast Balb 3T3 cells incubated for 24 h measured by BrdU ELISA chemiluminescent assay.
|
27163883 |
| HepG2 | ED50 |
0.50 μM
|
Inhibition of cell proliferation (DNA synthesis) in human hepatocellular carcinoma HepG2 cells incubated for 24 h measured by BrdU ELISA chemiluminescent assay.
Inhibition of cell proliferation (DNA synthesis) in human hepatocellular carcinoma HepG2 cells incubated for 24 h measured by BrdU ELISA chemiluminescent assay.
|
27163883 |
| Caco-2 | IC50 |
10.0 μM
|
Cytotoxicity against human colon adenocarcinoma Caco-2 cells incubated for 3 h measured by neutral red assay.
Cytotoxicity against human colon adenocarcinoma Caco-2 cells incubated for 3 h measured by neutral red assay.
|
29201864 |
| Caco-2 | IC50 |
2.1 μM
|
Cytotoxicity against human colon adenocarcinoma Caco-2 cells incubated for 24 h measured by neutral red assay.
Cytotoxicity against human colon adenocarcinoma Caco-2 cells incubated for 24 h measured by neutral red assay.
|
29201864 |
| Caco-2 | IC50 |
6.3 μM
|
Cytotoxicity against human colon adenocarcinoma Caco-2 cells incubated for 24 h measured by WST-1 assay.
Cytotoxicity against human colon adenocarcinoma Caco-2 cells incubated for 24 h measured by WST-1 assay.
|
29201864 |
| Caco-2 | IC50 |
1.4 μM
|
Cytotoxicity against human colon adenocarcinoma Caco-2 cells incubated for 72 h measured by neutral red assay.
Cytotoxicity against human colon adenocarcinoma Caco-2 cells incubated for 72 h measured by neutral red assay.
|
29201864 |
| Caco-2 | IC50 |
11.7 μM
|
Cytotoxicity against human colon adenocarcinoma Caco-2 cells incubated for 72 h measured by neutral red assay in an independent study.
Cytotoxicity against human colon adenocarcinoma Caco-2 cells incubated for 72 h measured by neutral red assay in an independent study.
|
29201864 |
| HepG2 | IC50 |
206.7 μM
|
Cytotoxicity against human hepatocarcinoma HepG2 cells incubated for 24 h measured by Alamar Blue assay (lower bound of range).
Cytotoxicity against human hepatocarcinoma HepG2 cells incubated for 24 h measured by Alamar Blue assay (lower bound of range).
|
29201864 |
| HepG2 | IC50 |
435.9 μM
|
Cytotoxicity against human hepatocarcinoma HepG2 cells incubated for 24 h measured by Alamar Blue assay (upper bound of range).
Cytotoxicity against human hepatocarcinoma HepG2 cells incubated for 24 h measured by Alamar Blue assay (upper bound of range).
|
29201864 |
| HepG2 | IC50 |
0.9 μM
|
Cytotoxicity against human hepatocarcinoma HepG2 cells incubated for 24 h measured by BrdU incorporation assay (lower bound of range).
Cytotoxicity against human hepatocarcinoma HepG2 cells incubated for 24 h measured by BrdU incorporation assay (lower bound of range).
|
29201864 |
| HepG2 | IC50 |
1.1 μM
|
Cytotoxicity against human hepatocarcinoma HepG2 cells incubated for 24 h measured by BrdU incorporation assay (upper bound of range).
Cytotoxicity against human hepatocarcinoma HepG2 cells incubated for 24 h measured by BrdU incorporation assay (upper bound of range).
|
29201864 |
| CHO-K1 | IC50 |
11.0 μM
|
Cytotoxicity against Chinese hamster ovary CHO-K1 cells incubated for 24 h measured by MTT assay.
Cytotoxicity against Chinese hamster ovary CHO-K1 cells incubated for 24 h measured by MTT assay.
|
29201864 |
| CHO-K1 | IC50 |
2.80 μM
|
Cytotoxicity against Chinese hamster ovary CHO-K1 cells incubated for 72 h measured by MTT assay.
Cytotoxicity against Chinese hamster ovary CHO-K1 cells incubated for 72 h measured by MTT assay.
|
29201864 |
| HT-29 | IC50 |
2.8 μM
|
Cytotoxicity against human colon adenocarcinoma HT-29 cells across 24 and 48 h exposure measured by MTT assay.
Cytotoxicity against human colon adenocarcinoma HT-29 cells across 24 and 48 h exposure measured by MTT assay.
|
29201864 |
| MRC5 | IC50 |
1.9 μM
|
Cytotoxicity against human fetal lung fibroblast MRC-5 cells incubated for 24 h measured by Alamar Blue assay (lower bound of range).
Cytotoxicity against human fetal lung fibroblast MRC-5 cells incubated for 24 h measured by Alamar Blue assay (lower bound of range).
|
29201864 |
| MRC5 | IC50 |
9.8 μM
|
Cytotoxicity against human fetal lung fibroblast MRC-5 cells incubated for 24 h measured by Alamar Blue assay (upper bound of range).
Cytotoxicity against human fetal lung fibroblast MRC-5 cells incubated for 24 h measured by Alamar Blue assay (upper bound of range).
|
29201864 |
| MRC5 | IC50 |
3.6 μM
|
Cytotoxicity against human fetal lung fibroblast MRC-5 cells incubated for 24 h measured by BrdU assay (upper bound of range).
Cytotoxicity against human fetal lung fibroblast MRC-5 cells incubated for 24 h measured by BrdU assay (upper bound of range).
|
29201864 |
| V79 | IC50 |
34 μM
|
Cytotoxicity against Chinese hamster fibroblast V79 cells incubated for 24 h measured by Alamar blue assay.
Cytotoxicity against Chinese hamster fibroblast V79 cells incubated for 24 h measured by Alamar blue assay.
|
29201864 |
| V79 | IC50 |
2.5 μM
|
Cytotoxicity against Chinese hamster fibroblast V79 cells incubated for 48 h measured by Alamar blue assay.
Cytotoxicity against Chinese hamster fibroblast V79 cells incubated for 48 h measured by Alamar blue assay.
|
29201864 |
| V79 | IC50 |
4.4 μM
|
Cytotoxicity against Chinese hamster fibroblast V79 cells incubated for 48 h measured by neutral red assay.
Cytotoxicity against Chinese hamster fibroblast V79 cells incubated for 48 h measured by neutral red assay.
|
29201864 |
| V79 | IC50 |
36 μM
|
Cytotoxicity against Chinese hamster fibroblast V79 cells measured by neutral red assay in an independent study (upper bound of range).
Cytotoxicity against Chinese hamster fibroblast V79 cells measured by neutral red assay in an independent study (upper bound of range).
|
29201864 |
| V79 | IC50 |
4 μM
|
Cytotoxicity against Chinese hamster fibroblast V79 cells measured by neutral red assay in an independent study (lower bound of range).
Cytotoxicity against Chinese hamster fibroblast V79 cells measured by neutral red assay in an independent study (lower bound of range).
|
29201864 |
| V79 | IC50 |
43 μM
|
Cytotoxicity against Chinese hamster fibroblast V79 cells measured by BCA protein content assay (upper bound of range).
Cytotoxicity against Chinese hamster fibroblast V79 cells measured by BCA protein content assay (upper bound of range).
|
29201864 |
| V79 | IC50 |
3.9 μM
|
Cytotoxicity against Chinese hamster fibroblast V79 cells measured by BCA protein content assay (lower bound of range).
Cytotoxicity against Chinese hamster fibroblast V79 cells measured by BCA protein content assay (lower bound of range).
|
29201864 |
| RAW264.7 | IC50 |
2.6 μM
|
Cytotoxicity against murine macrophage RAW 264.7 cells incubated for 24 h measured by Alamar blue assay.
Cytotoxicity against murine macrophage RAW 264.7 cells incubated for 24 h measured by Alamar blue assay.
|
29201864 |
| RAW264.7 | IC50 |
4.7 μM
|
Cytotoxicity against murine macrophage RAW 264.7 cells incubated for 24 h measured by neutral red assay.
Cytotoxicity against murine macrophage RAW 264.7 cells incubated for 24 h measured by neutral red assay.
|
29201864 |
| BALB/3T3 | ED50 |
11 μM
|
Induction of apoptosis in mouse embryo fibroblast Balb 3T3 cells incubated for 24 h.
Induction of apoptosis in mouse embryo fibroblast Balb 3T3 cells incubated for 24 h.
|
29201864 |
| Caco-2 | EC50 |
10 μM
|
Cytotoxicity measured as reduction in lysosomal activity in human colon adenocarcinoma Caco-2 cells after 3 h of exposure by Neutral Red assay.
Cytotoxicity measured as reduction in lysosomal activity in human colon adenocarcinoma Caco-2 cells after 3 h of exposure by Neutral Red assay.
|
22731695 |
| Caco-2 | EC50 |
2.1 μM
|
Cytotoxicity measured as reduction in lysosomal activity in human colon adenocarcinoma Caco-2 cells after 24 h of exposure by Neutral Red assay.
Cytotoxicity measured as reduction in lysosomal activity in human colon adenocarcinoma Caco-2 cells after 24 h of exposure by Neutral Red assay.
|
22731695 |
| V79 | IC50 |
4.0 μM
|
Cytotoxicity against Chinese hamster lung V79 cells incubated for 48 h measured by neutral red uptake assay.
Cytotoxicity against Chinese hamster lung V79 cells incubated for 48 h measured by neutral red uptake assay.
|
19360736 |
| V79 | IC50 |
36.0 μM
|
Cytotoxicity against Chinese hamster lung V79 cells incubated for 24 h measured by neutral red uptake assay.
Cytotoxicity against Chinese hamster lung V79 cells incubated for 24 h measured by neutral red uptake assay.
|
19360736 |
| V79 | IC20 |
1.5 μM
|
Cytotoxicity against Chinese hamster lung V79 cells incubated for 48 h measured by neutral red uptake assay.
Cytotoxicity against Chinese hamster lung V79 cells incubated for 48 h measured by neutral red uptake assay.
|
19360736 |
| V79 | IC20 |
2.1 μM
|
Cytotoxicity against Chinese hamster lung V79 cells incubated for 24 h measured by neutral red uptake assay.
Cytotoxicity against Chinese hamster lung V79 cells incubated for 24 h measured by neutral red uptake assay.
|
19360736 |
| CCF-STTG1 | IC50 |
8.9 μM
|
Cytotoxicity against human astrocytoma CCF-STTG1 cells assessed as reduction in cell viability incubated for 48 h by CCK-8 assay with WST-8 reduction measured at 457 nm.
Cytotoxicity against human astrocytoma CCF-STTG1 cells assessed as reduction in cell viability incubated for 48 h by CCK-8 assay with WST-8 reduction measured at 457 nm.
|
29768483 |
| Hep3B | IC50 |
3.38 μM
|
Growth inhibition of human Hep3B hepatocellular carcinoma cells incubated for 72 h assessed by MTT cell viability assay.
Growth inhibition of human Hep3B hepatocellular carcinoma cells incubated for 72 h assessed by MTT cell viability assay.
|
25557295 |
| CAKI-2 | IC50 |
> 10 μM
|
Growth inhibition of human Caki-2 renal carcinoma cells incubated for 72 h assessed by MTT cell viability assay.
Growth inhibition of human Caki-2 renal carcinoma cells incubated for 72 h assessed by MTT cell viability assay.
|
25557295 |
| KB 3-1 | IC50 |
3.72 μM
|
Growth inhibition of human KB-3-1 cervical carcinoma cells incubated for 72 h assessed by MTT cell viability assay.
Growth inhibition of human KB-3-1 cervical carcinoma cells incubated for 72 h assessed by MTT cell viability assay.
|
25557295 |
| Ca-Ski | IC50 |
3.38 μM
|
Growth inhibition of human CaSki cervical carcinoma cells incubated for 72 h assessed by MTT cell viability assay.
Growth inhibition of human CaSki cervical carcinoma cells incubated for 72 h assessed by MTT cell viability assay.
|
25557295 |
| HUVEC | IC50 |
7.7 μM
|
Viability inhibition of human umbilical vein endothelial cells incubated for 48 h.
Viability inhibition of human umbilical vein endothelial cells incubated for 48 h.
|
25557295 |
In Vitro
Enniatin B (EnnB) (1.5-100 μM; 24 h) effectively reduces cellular ATP levels in Balb 3T3 and HepG2 cells in cell viability assays without disrupting plasma membrane integrity, with ED50 values of 8.4 μM and 2.9 μM, respectively[1].
Enniatin B (3-12 μM; 24 h) effectively inhibits the proliferation of Balb 3T3 and HepG2 cells in cell proliferation assays, with ED50 values of 4.24 μM and 0.50 μM, respectively[1].
Enniatin B (11-45 μM; 24-48 h) induces a slight dose-dependent increase in early apoptotic Balb 3T3 cells, with the majority of cells remaining intact[1].
Enniatin B (0.00156-15.6 μM; 48 h) shows no specific agonistic or antagonistic effects on the transcriptional activity of estrogen, androgen, progesterone, or glucocorticoid receptors in reporter gene assays after 48 h[3].
Enniatin B (0.1-10 μM; 48 h) reduces the viability of CCF-STTG1 human astrocytoma cells with an IC50 of 8.9 μM; at concentrations above 5 μM, it moderately reduces the viability of primary porcine brain capillary endothelial cells; and after 48 h of treatment, it has no effect on the viability of HBMEC human brain microvascular endothelial cells at concentrations up to 10 μM[10].
Enniatin B (0.1-2.5 μM; 48 h) induces a 2.7-fold increase in caspase-3 activity in CCF-STTG1 human astrocytoma cells after 48 h of treatment at a concentration of 2.5 μM, indicating activation of the apoptotic signaling pathway[10].
Enniatin B (10 μM; 4 h) induces widespread downregulation of genes related to metabolism and mitochondrial structure in rat primary hepatocytes, including complex I subunits Ndufs1, Ndufs4, and Ndufs8, which is consistent with the manifestations of mitochondrial dysfunction and energy depletion[1].
Enniatin B exhibits cytotoxic effects on human HepG2 cells, with potency varying widely depending on the assay method (ED50 of 0.50 μM by BrdU ELISA and IC50 greater than 435.9 μM by Alamar Blue)[2].
Enniatin B (3 h) induces ROS production in human Caco-2 cells through a mitochondria-mediated cytotoxic pathway[2].
Enniatin B (48 h) induces G0/G1 phase cell cycle arrest in human HepG2 cells[2].
Enniatin B (1.25-10 μM; 24 h) induces G0/G1 phase cell cycle arrest in mouse RAW 264.7 macrophages[2].
Enniatin B (3 μM; 72 h) induces G2/M phase cell cycle arrest in human Caco-2 cells, accompanied by a decrease in S phase cells and accumulation of cells in the SubG0/G1 phase[2].
Enniatin B (48 h) induces apoptosis and necrotic cell death in human Caco-2 cells[2].
Enniatin B (1.5-3.0 μM; 48 h) induces apoptosis in human HepG2 cells without causing necrosis[2].
Enniatin B (0.66 μM; 2.5-30 min) undergoes extensive phase I metabolism via oxidation and N-demethylation in rat, dog, and human liver microsomes, producing 12 identified metabolites, with species-dependent metabolic profiles, and the intrinsic clearance in dog liver microsomes is approximately 7-fold higher than that in rat and human liver microsomes[7].
Enniatin B (0.1-20 μM; 4 h) shows no mutagenicity up to cytotoxic concentrations of 20 μM in the HPRT assay in V79 cells in the presence and absence of rat liver S9 metabolic activation[8].
Enniatin B (0.1-100 μM; 3-18 h) does not induce significant DNA strand breaks or oxidative DNA base damage in V79 cells, as determined by standard and FPG-modified alkaline comet assays[8].
Enniatin B (up to 10 μM; 18 h) does not induce micronuclei in V79 cells, indicating a lack of clastogenic and aneugenic activity[8].
Enniatin B (1 μM; 24 h) induces nuclear fragmentation, a marker of apoptosis, in approximately 10% of V79 cells[8].
Enniatin B (0.1-2.5 μM; 48 h) does not induce significant LDH leakage in CCF-STTG1 human astrocytoma cells at concentrations up to 2.5 μM after 48 h of treatment, suggesting that necrosis is not the primary mode of cell death[10].
Enniatin B (0.01-100 μM; 48 h) reduces the viability of H295R cells in a dose-dependent manner, with viability decreasing by 37% after 48 h of treatment at 100 μM[3].
Enniatin B (0.01-100 μM; 48 h) reduces the viability of unstimulated and LH-stimulated neonatal porcine Leydig cells by approximately 20%[3].
Enniatin B (0.00156-15.6 μM; 48 h) reduces the viability of TARM-Luc, TM-Luc, and TGRM-Luc reporter gene cell lines after 48 h treatment at 15.6 μM, with minimal effect on MMV-Luc cells[3].
Enniatin B (30 min pre-incubation with inhibitors), when combined with MEK1/2 or p38 MAPK inhibitors, induces enhanced cytotoxicity in KB-3-1 cervical cancer cells, suggesting that both ERK and p38 pathways promote cell survival under Enniatin B treatment[11].
Enniatin B (2-3 μM; 48 h), when combined with pharmacological p38 MAPK inhibition, induces decreased Hsp27 phosphorylation levels in KB-3-1 cervical cancer cells[11].
Enniatin B (0.1-25 μM; 24-72 h) induces S phase arrest, a decreased G0/G1 phase proportion, and apoptosis in H295R cells in a time- and dose-dependent manner, with an apoptosis rate of 32.2% after 72 h of treatment at 25 μM[3].
Enniatin B (0.01-100 μM; 48 h) decreases progesterone, testosterone, and cortisol production in H295R cells, while estradiol levels remain unchanged[3].
Enniatin B (10 μM; 48 h) modulates the expression of 12 out of 16 steroidogenesis-related genes in H295R cells after 48 h of treatment, with downregulation of early pathway genes (HMGR, StAR, CYP11A, HSD3B2, CYP17A1) and upregulation of other steroidogenic and biotransformation genes[3].
Enniatin B (0.01-100 μM; 48 h) reduces estradiol and testosterone production in LH-stimulated neonatal porcine Leydig cells, with minimal effects on unstimulated cells[3].
Enniatin B (56 pM-437.2 μM; 3-24 h) effectively impairs lysosomal function in Caco-2 cells in a time- and concentration-dependent manner, with a 24 h EC50 of 2.1 μM, without affecting metabolic activity or membrane integrity at the tested concentrations[5].
Enniatin B (1-50 μM; 3-24 h) induces rapid and concentration-dependent lysosomal membrane permeabilization in Caco-2 cells, with damage detectable as early as 3 h and pronounced disruption at 24 h[5].
Enniatin B (1-25 μM; 24 h) decreases Caco-2 cell proliferation in a concentration-dependent manner, with a 50% reduction in proliferation at 25 μM after 24 h, accompanied by progressive morphological changes and cell detachment[5].
Enniatin B (1-25 μM; 24 h) causes a slight but detectable G2/M phase cell cycle arrest in Caco-2 cells after 24 h treatment at 25 μM, without leading to significant accumulation of sub-G1 phase cells[5].
Enniatin B (24 h) as a single agent has only a minimal effect on DNA synthesis in KB-3-1 cervical cancer cells[11].
Enniatin B (24-48 h) induces moderate G0/G1 phase cell cycle arrest in KB-3-1 cervical cancer cells, and this effect is more pronounced after 48 h of treatment[11].
Enniatin B (1-25 μM; 24 h) predominantly induces necrotic cell death in Caco-2 cells in a dose-dependent manner, with necrotic cells accounting for approximately 13% after 24 h treatment at 25 μM, and with minimal apoptosis[5].
Enniatin B (5-10 μM; 3-24 h) induces dose-dependent changes in mitochondrial membrane permeability in Caco-2 cells, an effect detectable as early as 3 h and more pronounced at 24 h, which is not mediated by cathepsins[5].
Enniatin B (1-25 μM; 3-24 h) induces a 2.4-fold increase in intracellular ROS levels in Caco-2 cells after 24 h treatment at 5 μM, an effect that is completely inhibited by the antioxidant ascorbic acid[5].
Enniatin B (1-10 μM; 24 h) induces the release of cathepsins B and D from lysosomes into the cytosol of Caco-2 cells in a concentration-dependent manner after 24 h of exposure, with altered processing, which is consistent with lysosomal membrane permeabilization[5].
Enniatin B (5 μM; 24 h) treatment leads to the appearance of mature caspases (caspase-14, -6, -3) and the pro-apoptotic proteins Bax and Bid in the cytoplasm of Caco-2 cells, which is consistent with the activation of cell death pathways[5].
Enniatin B (0.009-100 μM; 24-72 h) exerts potent multiparametric hepatotoxic effects in Hep-G2 cells, with significant toxicity observed at 0.9 μM after 24 h and 72 h of exposure[6].
Enniatin B (100 nM-100 μM; 20 min preincubation, 2-day culture) is not mutagenic to Salmonella typhimurium strains TA 98, TA 100, TA 102, and TA 104 in the presence or absence of rat liver S9 metabolic activation, with the highest tested toxic concentration being 100 μM[8].
Enniatin B (4-10 μM; 24 h) exhibits potent cytotoxicity against human umbilical cord blood-derived immature dendritic cells, mature dendritic cells, and macrophages, with IC50 values of 1.6 μM, 2.6 μM, and 2.5 μM, respectively[9].
Enniatin B (1-1.3 μM; 5 days) does not alter CD1a expression during the differentiation of human umbilical cord blood monocytes into immature dendritic cells at concentrations of 1 μM and 1.3 μM[9].
Enniatin B (1-1.3 μM; 5 days) does not affect the endocytic capacity during the differentiation of human umbilical cord blood monocytes into immature dendritic cells at concentrations of 1 μM and 1.3 μM[9].
Enniatin B (0.5-1 μM; 6 days) reduces the endocytic capacity during the differentiation of human umbilical cord blood monocytes into macrophages[9].
Enniatin B (0.5-1 μM; 6 days) does not alter respiratory burst activity during the differentiation of human umbilical cord blood monocytes into macrophages at concentrations of 0.5 μM and 1 μM[9].
Enniatin B (0.5-1 μM; 6 days) upregulates CD71 expression in a dose-dependent manner during the differentiation of human umbilical cord blood monocytes into macrophages, while the expression of CD11a, HLA-DR, CD80, and CD54 remains unchanged[9].
Enniatin B (1-2 μM; 2 days) downregulates the maturation markers CD80, CD86, and CCR7 during Lipopolysaccharides, from E. coli O55:B5 (HY-D1056)-induced maturation of human cord blood-derived dendritic cells at 2 μM, while HLA-DR expression remains unaffected[9].
Enniatin B (1-2 μM; 2 days) increases IL-10 secretion during LPS-induced maturation of human umbilical cord blood-derived dendritic cells[9].
Enniatin B (0.5-1 μM; 6 days) does not alter TNF-α secretion during the differentiation of human umbilical cord blood monocytes into macrophages at concentrations of 0.5 μM and 1 μM[9].
Enniatin B (72 h) inhibits the viability of multiple human cancer cell lines with low micromolar potency, with IC50 values ranging from 1.74 μM (HTB-31 cervical cancer) to > 10 μM (Caki-2 renal cell carcinoma)[11].
Enniatin B (3 μM; 24 h) induces mitochondrial membrane depolarization and increases the proportion of late apoptosis/necrosis in KB-3-1 cervical cancer cells after 24 h of treatment[11].
Enniatin B (1-3 μM; 48 h) modulates the expression of apoptosis-related proteins in KB-3-1 cervical cancer cells, inducing caspase-7 activation, PARP cleavage, upregulation of the pro-apoptotic genes bak and bim, and downregulation of the pro-survival genes bcl-xL and Mcl-1[11].
Enniatin B (1-3 μM; 48 h) modulates the expression of cell cycle proteins in KB-3-1 cervical cancer cells, and its mode of action is consistent with G0/G1 phase cell cycle arrest[11].
Enniatin B (1-3 μM; 48 h) modulates multiple MAPK signaling pathways in KB-3-1 cervical cancer cells, inhibiting ERK phosphorylation while strongly activating p38 MAPK and its downstream target CREB, and reducing STAT3 phosphorylation levels[11].
Enniatin B (2.5 μM; 20 h) effectively inhibits capillary-like tube formation in human umbilical vein endothelial cells at subtoxic concentrations[11].
Enniatin B (4 μM; 15 h) strongly inhibits VEGF-induced migration of human umbilical vein endothelial cells[11].
MedChemExpress (MCE) has not independently confirmed the accuracy of these methods. They are for reference only. Further protocols information, click here.
-
Cell Line:Mouse embryo fibroblast Balb 3T3 (clone A31) cells, human hepatocellular carcinoma HepG2 cells
-
Concentration:1.5, 3.1, 6.25, 12.5, 25, 50, 100 μM
-
Incubation Time:24 h
-
Result:Reduced intracellular ATP levels in Balb 3T3 cells in a steep, dose-dependent manner with an ED50 of 8.4 μM; concentrations below 3 μM had no effect.
Detected no adenylate kinase leakage through the plasma membrane in Balb 3T3 cells at the tested concentrations, indicating preserved membrane integrity.
Reduced intracellular ATP levels in HepG2 cells in a dose-dependent pattern with an ED50 of 2.9 μM.
-
Cell Line:Mouse embryo fibroblast Balb 3T3 cells, human hepatocellular carcinoma HepG2 cells
-
Concentration:3, 4, 5, 6, 7, 8, 9, 10, 11, 12 μM
-
Incubation Time:24 h
-
Result:Caused a marked decline in DNA synthesis in both cell lines within a narrow concentration range.
Yielded an estimated ED50 for inhibition of proliferation of 4.24 μM in Balb 3T3 cells; concentrations under 3.5 μM showed no inhibition.
Yielded an estimated ED50 for inhibition of proliferation of 0.50 μM in HepG2 cells.
-
Cell Line:Mouse embryo fibroblast Balb 3T3 cells
-
Concentration:11, 22.5, 45 μM
-
Incubation Time:24, 48 h
-
Result:Slightly increased the proportion of early apoptotic Balb 3T3 cells in a dose-dependent manner following 24 h of exposure: from 0.3% in negative control cells to 1.25% at 11 μM, 2.5% at 22.5 μM, and 4.4% at 45 μM.
Showed a rising trend in the proportion of late apoptotic/necrotic cells with increasing concentration after 24 h.
Resulted in 96.6% intact cells at 11 μM, 91.0% at 22.5 μM, and 84.3% at 45 μM after 24 h, compared to 86% in negative control samples.
Induced a statistically significant increase in early apoptotic cells from 0.0% in controls to 3.6% at 45 μM after 48 h of exposure.
-
Cell Line:Cryopreserved rat primary hepatocytes
-
Concentration:10 μM
-
Incubation Time:1, 4 h
-
Result:Confirmed the microarray findings for Ndufs4 and Timm21, showing downregulated relative expression of both genes following exposure.
Showed no statistically significant change in expression of caspase genes (Casp1, Casp3, Casp7, Casp9) compared to unexposed controls.
-
Cell Line:Human colon adenocarcinoma Caco-2 cells
-
Concentration:3 μM
-
Incubation Time:72 h
-
Result:Induced cell cycle arrest in the G2/M phase in Caco-2 cells after 72 h of exposure, with a significant increase in G2/M cell number compared to control.
Decreased the S phase cell population and increased the SubG0/G1 population.
-
Cell Line:Human hepatocarcinoma HepG2 cells
-
Concentration:1.5, 3.0 μM
-
Incubation Time:48 h
-
Result:Caused apoptosis in HepG2 cells after 48 h of exposure, with enniatin B identified as more toxic than enniatin A.
No necrotic pathway was observed.
-
Cell Line:human adrenocortical carcinoma H295R cells
-
Concentration:0.01, 0.1, 1, 10, 100 μM
-
Incubation Time:48 h
-
Result:Induced an increase in cell viability up to the 1 μM dose, followed by a dose-dependent decrease at higher concentrations.
Caused an average reduction in viable cells of 37% compared to control cells.
-
Cell Line:human adrenocortical carcinoma H295R cells
-
Concentration:0.1, 1, 10, 15, 25 μM
-
Incubation Time:24, 48, 72 h
-
Result:With the exception of the 24 h exposure, led to a dose-dependent reduction of cells in the G0/G1 phase.
The reduction in G0/G1 phase cells was significant at concentrations > 10 μM after 72 h of exposure.
Increased the proportion of cells in S phase across all exposure durations.
Concentrations > 15 μM significantly increased the percentage of apoptotic (sub-G0) cells.
At 25 μM, the apoptotic cell proportions were approximately 11%, 24.6%, and 32.2% after 24 h, 48 h, and 72 h exposures, respectively.
-
Cell Line:human adrenocortical carcinoma H295R cells
-
Concentration:10 μM
-
Incubation Time:48 h
-
Result:Significantly modulated twelve of the sixteen analyzed genes.
Significantly downregulated HMGR, StAR, CYP11A, HSD3B2, and CYP17A1.
Significantly upregulated CYP1A1, MC2R, NR0B1, CYP21A2, CYP11B1, CYP11B2, and CYP19.
Did not significantly alter expression levels of EPHX, NR5A1, HSD17B1, and HSD17B4.
-
Cell Line:primary neonatal porcine Leydig cells (both unstimulated and LH-stimulated)
-
Concentration:0.01, 0.1, 1, 10, 100 μM
-
Incubation Time:48 h
-
Result:At 0.01-10 μM, caused no significant difference in Leydig cell viability under either unstimulated or LH-stimulated condition.
At 100 μM, significantly reduced cell viability, with average viabilities of 80% in unstimulated cells and 79% in LH-stimulated cells compared to controls.
-
Cell Line:four human mammary gland reporter gene cell lines (MMV-Luc, TARM-Luc, TM-Luc, TGRM-Luc)
-
Concentration:0.00156, 0.0156, 0.156, 1.56, 15.6 μM
-
Incubation Time:48 h
-
Result:Caused no significant difference in cell viability in any of the four RGA cell lines.
At 15.6 μM, caused a significant decrease in cell viability (37-50% reduction) in TARM-Luc, TM-Luc, and TGRM-Luc cell lines, while the MMV-Luc cell line showed a non-significant trend toward reduced viability (approximately 7% reduction).
-
Cell Line:Human colon adenocarcinoma Caco-2 cells
-
Concentration:1, 5, 10, 25 μM
-
Incubation Time:24 h
-
Result:Decreased cell proliferation in a concentration-dependent manner.
Reduced viability to 85% of control at 1 μM.
Reduced viability to 67% of control at 5 μM.
Reduced viability to 69% of control at 10 μM.
Reduced viability to 50% of control at 25 μM.
Caused only minimal cell rounding and floating at 1 μM.
Induced progressive cell detachment, loss of cell-cell contacts, and altered morphology at concentrations above 5 μM, most pronounced at 25 μM.
Showed partially reversed proliferation decrease in the presence of 40 μM pepstatin A.
Did not show reversed proliferation decrease in the presence of 20 μM E-64d.
-
Cell Line:Human colon adenocarcinoma Caco-2 cells
-
Concentration:1, 5, 10, 25 μM
-
Incubation Time:24 h
-
Result:Induced a slight shift in cell cycle distribution with a noticeable increase in the G2/M phase population.
Resulted in 31% of cells in G2/M phase at 25 μM compared with 23% in untreated controls.
Did not cause a marked increase in the sub-G1 population at any tested concentration.
-
Cell Line:Human colon adenocarcinoma Caco-2 cells
-
Concentration:1, 5, 10, 25 μM
-
Incubation Time:24 h
-
Result:Induced cell death with a clear predominance of necrosis over apoptosis across the tested concentration range.
Increased the proportion of necrotic cells in a dose-dependent manner, reaching approximately 13% at 25 μM.
Resulted in at most 2% apoptotic cells at 1 μM, with apoptotic cell proportion decreasing at higher concentrations.
Produced less than 1% double-stained post-apoptotic necrotic cells at all concentrations.
Decreased the number of normal cells by approximately 12% with increasing concentration, matching the increase in necrotic cells.
Showed only a minimal decrease in the number of necrotic cells in the presence of ascorbic acid.
-
Cell Line:Human colon adenocarcinoma Caco-2 cells
-
Concentration:10, 25, 50 μM (3 h); 1, 5, 10, 25 μM (24 h)
-
Incubation Time:3, 24 h
-
Result:Caused a dramatic decrease in LysoTracker Red fluorescence intensity after 24 h of exposure, indicating altered lysosomal acidification and function.
Induced initial increase in lysosome size followed by disintegration with increasing concentration.
Caused marked rupture of lysosomal membranes after only 3 h of treatment with 10 μM.
Produced extent of lysosomal damage at 25 μM comparable to that of the positive control L-leucyl-L-leucine methyl ester.
-
Cell Line:Human colon adenocarcinoma Caco-2 cells
-
Concentration:1, 5, 10 μM
-
Incubation Time:24 h
-
Result:Caused concentration-dependent changes in the levels of different cathepsin forms in the cytosolic fraction.
Increased signal intensities of cathepsin B at 27 kDa (mature heavy chain) and 37 kDa (procathepsin B) with higher concentrations.
Slightly decreased the 42 kDa preprocathepsin B signal of cathepsin B.
Increased the 33 kDa single-chain cathepsin B signal first at 1 μM then returned to control levels at 5 and 10 μM.
Increased the 48 kDa (double-glycosylated procathepsin D) signal of cathepsin D.
Barely changed the 46 kDa active single-chain signal of cathepsin D.
Considerably decreased the 42 kDa preprocathepsin D and 27 kDa mature heavy chain signals of cathepsin D.
Detected bands for procathepsin L (43 kDa) and single-chain cathepsin L (30 kDa) in the cytosol, with less unambiguous signals for cathepsin L.
-
Cell Line:human Hep-G2 hepatocellular carcinoma cells
-
Concentration:0.009, 0.09, 0.9, 9, 13, 20, 30, 44, 67, and 100 μM
-
Incubation Time:24, 72 h
-
Result:Displayed a strong hepatotoxic response deviating significantly from control starting at 0.9 μM after 24 h of exposure.
Exerted the most pronounced effect on plasma membrane integrity, with concomitant effects on mitochondrial area/mass, mitochondrial membrane potential, decreased lysosomal activity, and reduced nuclear count after 24 h.
Showed a cytotoxicity response very similar to 24 h exposure, with no significant enhancement of toxicity with prolonged exposure after 72 h.
Exhibited greater cytotoxic potency than aflatoxin B1.
-
Cell Line:V79 Chinese hamster lung fibroblasts
-
Concentration:1 μM
-
Incubation Time:24 h
-
Result:Induced clear nuclear fragmentation frequently in cultures treated for 24 h, with approximately 10% of all cells showing fragmented nuclei, a morphological feature of apoptotic cell death.
-
Cell Line:human umbilical cord blood-derived immature dendritic cells, mature dendritic cells, and macrophages
-
Concentration:10 μM (immature dendritic cells and macrophages); 4 μM (mature dendritic cells)
-
Incubation Time:24 h
-
Result:Showed cytotoxicity to all three cell types.
Left 18% of immature dendritic cells viable at 10 μM.
Left 30% of macrophages viable at 10 μM.
Left 33% of mature dendritic cells viable at 4 μM.
Exhibited an IC50 of 1.6 μM for immature dendritic cells.
Exhibited an IC50 of 2.6 μM for mature dendritic cells.
Exhibited an IC50 of 2.5 μM for macrophages.
-
Cell Line:human umbilical cord blood monocyte-derived mature dendritic cells
-
Concentration:1, 2 μM
-
Incubation Time:2 days
-
Result:Increased IL-10 secretion to 753 pg/mL at 2 μM compared to the control level of 496 pg/mL.
-
Cell Line:human umbilical cord blood monocyte-derived macrophages
-
Concentration:0.5, 1 μM
-
Incubation Time:6 days
-
Result:Maintained TNF-α secretion similar to control levels at 0.5 μM and 1 μM.
-
Cell Line:primary porcine brain capillary endothelial cells (PBCEC), human brain microvascular endothelial cells (HBMEC), human astrocytoma CCF-STTG1 cells
-
Concentration:0.1, 1, 2.5, 5, 10 μM
-
Incubation Time:48 h
-
Result:Caused a decrease in viability at concentrations above 5 μM in PBCEC, with a minimum relative viability of 70% at 10 μM.
Showed no effect on viability across the 0.1 μM to 10 μM concentration range in HBMEC.
Produced strong cytotoxic effects at 5 μM and 10 μM in CCF-STTG1 astrocytoma cells, with an IC50 of 8.9 μM.
-
Cell Line:human astrocytoma CCF-STTG1 cells
-
Concentration:0.1, 1, 2.5 μM
-
Incubation Time:48 h
-
Result:Resulted in a 2.7-fold increase in caspase-3 activity compared to the solvent control at 2.5 μM.
Produced only minor differences relative to the control at lower concentrations.
-
Cell Line:human astrocytoma CCF-STTG1 cells
-
Concentration:0.1, 1, 2.5 μM
-
Incubation Time:48 h
-
Result:Detected no significant increase in LDH release into the medium across the tested concentration range.
-
Cell Line:human KB-3-1 cervical carcinoma cells
-
Concentration:3 μM
-
Incubation Time:24 h
-
Result:Increased the numbers of PI-permeable cells indicative of late apoptotic/necrotic cells compared to untreated controls.
-
Cell Line:human KB-3-1 cervical carcinoma cells
-
Concentration:1, 2, 3 μM
-
Incubation Time:48 h
-
Result:Caused concentration-dependent increases in cleaved PARP and cleaved caspase 7.
Upregulated the pro-apoptotic proteins bak and bim.
Reduced the pro-survival proteins bcl-xL and Mcl-1 at higher concentrations.
Left Bax protein levels largely unchanged across the concentration range.\nInduced concentration-dependent changes in cyclin expression consistent with the observed G0/G1 cell cycle distribution.\nCaused a concentration-dependent decrease in ERK phosphorylation.
Induced a strong concentration-dependent activation (phosphorylation) of p38 MAPK.
Induced a comparable activation pattern for the p38 downstream target CREB.
Significantly reduced phosphorylation of STAT3.
Induced phosphorylation of Hsp27 (a downstream target of p38).
-
Cell Line:human KB-3-1 cervical carcinoma cells
-
Concentration:2, 3 μM
-
Incubation Time:48 h
-
Result:Showed reduced phosphorylation of Hsp27 when cells were concomitantly treated with the p38 inhibitor SB203580.
-
Cell Line:human umbilical vein endothelial cells (HUVEC)
-
Concentration:4 μM
-
Incubation Time:15 h
-
Result:Markedly impaired migration in VEGF-stimulated cells, with 75% of the initial scratch gap remaining open after 15 h, whereas VEGF-only treated cells nearly closed the wound.
Parmacokinetics
In Vivo
Enniatin B (1.25-40 mg/kg; i.p.; every 8 h) causes death in mice within 2 to 5 days at doses of 10 mg/kg and above, reduces body weight, and shows no anti-HIV activity in mice[2].
Enniatin B (0.2 mg/kg; intravenous bolus; single dose) is widely distributed in broiler tissues, with an average volume of distribution of 33.91 L/kg[2].
Enniatin B (0.05 mg/kg; oral bolus; single dose) exhibits a higher absorption extent than ENN B1, ENN A1, and ENN A in pigs[2].
Enniatin B (1.03 mg/kg; p.o.), as a component of a mixture of four enniatins, produces no adverse effects in Wistar rats[2].
Enniatin B (5 mg/kg; i.p.; once daily; for 2 consecutive days) is well tolerated in healthy SCID mice, accumulates mainly in the liver and fat, and is extensively metabolized into three phase I metabolites in the liver and intestine[4].
Enniatin B (5 mg/kg; i.p.; once daily; for 9 consecutive days) is well tolerated in mice bearing KB-3-1 cervical cancer xenografts and accumulates in tumor tissue at a concentration of 2.8 μg/kg[4].
Enniatin B (5 mg/kg; i.p.; once daily; for 14 days) as a single agent does not significantly reduce the growth of KB-3-1 cervical cancer xenografts in SCID mice[11].
MedChemExpress (MCE) has not independently confirmed the accuracy of these methods. They are for reference only.
-
Animal Model:Broiler chickens[2]
-
Dosage:0.2 mg/kg
-
Administration:bolus; single dose
-
Result:Distributed readily to broiler chicken tissues.
Had a mean volume of distribution of 33.91 L/kg.
-
Animal Model:strain not specified[2]
-
Dosage:0.05 mg/kg
-
Administration:oral bolus; single dose
-
Result:Showed higher absorption than ENN B1, ENN A1, and ENN A.
-
Animal Model:CB-17 scid/scid (severe combined immunodeficiency) mice (male; 8 weeks old; average weight 25 g)[4]
-
Dosage:5 mg/kg
-
Administration:i.p.; once daily; 2 consecutive days
-
Result:Showed no apparent signs of toxicity including reduced food/fluid consumption, fatigue, or body weight alterations.
Exhibited intact tissue architecture in liver, lung, and kidneys with no acute or subchronic toxic damage, and no increase in mitotic numbers, proliferation rates, or apoptotic bodies.
Was detected in all tested tissues and serum but not in urine.
Reached concentrations of 2.9 μg/kg in liver, 0.1 μg/kg in kidney, 0.9 μg/kg in colon, 2.5 μg/kg in fat, 0.1 μg/kg in brain, 0.12 μg/kg in muscle, and 0.45 μg/kg in serum.
Was metabolized to three phase I metabolites (dioxygenated-Enniatin B, monodemethylated-Enniatin B, didemethylated-Enniatin B) in liver and colon.
Had metabolite concentrations in liver of 26.9 μg/kg for dioxygenated-Enniatin B, 0.7 μg/kg for monodemethylated-Enniatin B, and 1.0 μg/kg for didemethylated-Enniatin B.
Had metabolite concentrations in colon of 2.5 μg/kg for dioxygenated-Enniatin B, 0.6 μg/kg for monodemethylated-Enniatin B, and 2.45 μg/kg for didemethylated-Enniatin B.
Had no metabolites detected in serum, brain, muscle, or kidney.
-
Animal Model:CB-17 scid/scid (severe combined immunodeficiency) mice (male; 8 weeks old; average weight 25 g; KB-3-1 human cervix carcinoma xenograft model)[4]
-
Dosage:5 mg/kg
-
Administration:i.p.; once daily; 9 days
-
Result:Showed no apparent signs of toxicity including reduced food/fluid consumption, fatigue, or body weight alterations throughout the 9-day treatment.
Exhibited intact tissue architecture in liver, lung, and kidneys with no acute or subchronic toxic damage.
Reached a concentration of 2.8 μg/kg in tumor tissue.
Reached a concentration of 5.4 μg/kg in serum.
Had no degradation products (metabolites) detected in the analyzed tumor tissues.
-
Animal Model:CB-17 scid/scid (SCID) mice (male, 8 weeks old)[11]
-
Dosage:5 mg/kg
-
Administration:i.p.; daily; 14 days
-
Result:Produced tumor volume and tumor weight values at day 14 that were approximately equal to those of the solvent control group.


Chemical Information
-
CAS No. 917-13-5
-
Appearance Solid
-
Molecular Weight 639.82
-
Formula C33H57N3O9
-
Color White to off-white
-
SMILES
CC([C@](O1)([H])C(N([C@H](C(O[C@@H](C(N([C@](C(C)C)([H])C(O[C@H](C(C)C)C(N(C)[C@@H](C(C)C)C1=O)=O)=O)C)=O)C(C)C)=O)C(C)C)C)=O)C
-
Structure Classification
-
Initial Source
Fusarium spp.
-
Shipping
Room temperature in continental US; may vary elsewhere.
-
Storage
Powder -20°C 3 years 4°C 2 years In solvent -80°C 6 months -20°C 1 month


Solvent & Solubility
In Vitro:
DMSO : ≥ 10 mg/mL (15.63 mM; Hygroscopic DMSO has a significant impact on the solubility of product, please use newly opened DMSO)
* "≥" means soluble, but saturation unknown.
Please refer to the solubility information to select the appropriate solvent. Once prepared, please aliquot and store the solution to prevent product inactivation from repeated freeze-thaw cycles.
Storage method and period of stock solution: -80°C, 6 months; -20°C, 1 month. When stored at -80°C, please use it within 6 months. When stored at -20°C, please use it within 1 month.
Please refer to the solubility information to select the appropriate solvent. Once prepared, please aliquot and store the solution to prevent product inactivation from repeated freeze-thaw cycles.
Storage method and period of stock solution: -80°C, 6 months; -20°C, 1 month. When stored at -80°C, please use it within 6 months. When stored at -20°C, please use it within 1 month.
Concentration (start) × Volume (start) = Concentration (final) × Volume (final)

Protocols
-
Mitochondrial membrane-potential fluorescent assay
Mitochondrial membrane potential fluorescent assays estimate ΔΨm in living cells using lipophilic cationic dyes such as TMRM, TMRE, rhodamine 123, and JC-1, which accumulate in mitochondria according to membrane polarization; loss of signal after FCCP or CCCP treatment is interpreted as mitochondrial depolarization. TMRM/TMRE and rhodamine 123 are commonly used for semi-quantitative live-cell microscopy or flow cytometry, while JC-1 can report a shift from red aggregate fluorescence to green monomer fluorescence during depolarization; interpretation requires controls because dye concentration, quenching mode, cell type, dye efflux, and mitochondrial mass can affect fluorescence independently of ΔΨm.
-
Annexin V plus membrane-impermeant dye apoptosis staining
Annexin V-based apoptosis assays rely on the detection of phosphatidylserine (PS) externalization from the inner leaflet of the plasma membrane to the outer leaflet, an early biochemical hallmark of apoptosis. Fluorescently labeled Annexin V binds PS in a calcium-dependent manner, enabling identification of early apoptotic cells by flow cytometry or fluorescence microscopy. When combined with a membrane-impermeant DNA-binding dye (e. g. , propidium iodide), this approach allows discrimination between viable (Annexin V−/dye−), early apoptotic (Annexin V+/dye−), and late apoptotic or necrotic (Annexin V+/dye+) cell populations by assessing membrane integrity and PS exposure.
-
BrdU Incorporation Assay
Bromodeoxyuridine (BrdU) incorporation assay is based on the principle that BrdU, a thymidine analog, is incorporated into newly synthesized DNA during the S phase of the cell cycle, thereby serving as a marker of DNA replication and cellular proliferation. Incorporated BrdU can be detected using anti-BrdU antibodies following DNA denaturation, enabling visualization or quantification of proliferating cells through immunochemical detection methods such as immunofluorescence or immunohistochemistry.
-
Somatic Cell Culture
A method of simulating the in vivo environment in vitro to maintain the cell growth, differentation and main functions.
-
CFSE Dye Dilution Proliferation Assay
The CFSE (carboxyfluorescein diacetate succinimidyl ester) dye dilution proliferation assay is based on the covalent labeling of intracellular proteins by a cell-permeant fluorescent dye that becomes fluorescent upon intracellular ester cleavage and then is stably retained within cells. As labeled cells divide, the dye is partitioned equally between daughter cells, resulting in a stepwise halving of fluorescence intensity that can be quantified by flow cytometry to determine the number of cell divisions undergone by each cell population. This fluorescence dilution approach enables quantitative tracking of lymphocyte proliferation at the single-cell level over multiple rounds of division. CFSE-based proliferation analysis has been widely applied to measure antigen-driven lymphocyte expansion in vitro, where discrete fluorescence peaks correspond to successive cell divisions and allow reconstruction of proliferative history within heterogeneous populations.
-
Dye-dilution cell tracking and proliferation staining
Dye-dilution cell tracking assays quantify cell proliferation by covalently labeling intracellular proteins with a stable fluorescent dye that is equally partitioned between daughter cells during mitosis, resulting in stepwise halving of fluorescence intensity with each cell division as measured by flow cytometry histograms. Carboxyfluorescein diacetate succinimidyl ester (CFSE) is a prototypical dye that diffuses into cells, is enzymatically converted into a fluorescent compound, and then covalently binds intracellular amine groups, producing long-lived fluorescence suitable for tracking multiple rounds of division in vitro and in vivo. Successive generations of dividing cells form discrete peaks of decreasing fluorescence intensity, enabling estimation of proliferation history, precursor frequency, and division index within heterogeneous populations. Alternative dyes such as CellTrace Violet (CTV) and far-red membrane dyes (e. g. , PKH26) follow the same dilution principle but differ
-
CCK-8/WST-8 Cell Proliferation Assay
The CCK-8/WST-8 assay is based on the reduction of the water-soluble tetrazolium salt WST-8 to a water-soluble formazan product by cellular dehydrogenases in metabolically active cells, where the generated formazan amount is proportional to the number of living cells and is quantified by measuring absorbance in the visible range, providing a colorimetric readout for cell viability and proliferation assessment. This class of tetrazolium-based assays improves upon earlier MTT-based systems by producing a water-soluble formazan, eliminating the need for organic solubilization steps and enabling direct spectrophotometric measurement in culture medium.
-
Protocol for Cell Cycle
Cell-cycle analysis by flow cytometry measures DNA content in single cells to estimate the fraction of cells in G0/G1, S, and G2/M phases. Propidium iodide intercalates into DNA, and after RNA removal with RNase, fluorescence intensity reflects cellular DNA content: 2N cells are assigned to G0/G1, cells between 2N and 4N to S phase, and 4N cells to G2/M. DNA-content analysis alone cannot reliably separate G0 from G1 or G2 from M. Ki-67 can distinguish quiescent G0 cells from cycling cells, EdU or BrdU incorporation marks active DNA synthesis in S phase, and phospho-histone H3 staining identifies mitotic cells within the 4N population.
-
Research Protocol for Cardiovascular Diseases
Cardiovascular disease can be modeled as maladaptive cardiac remodeling, where ischemic injury or pressure overload activates inflammatory signaling, fibroblast activation, extracellular-matrix deposition, cardiomyocyte hypertrophy, vascular remodeling, and progressive ventricular dysfunction. The TGF-β/SMAD axis is a central profibrotic pathway after myocardial injury and pressure overload, while innate immune and cytokine pathways regulate leukocyte recruitment, scar formation, and adverse remodeling. Key unresolved questions include which inflammatory signals are reparative versus harmful, when fibrosis is protective versus maladaptive, and whether pathway inhibition improves function without weakening necessary infarct healing or compensatory remodeling.
-
Cell Counting-Based Growth Curve Assay
Cell counting-based growth curve assays quantify cell proliferation by directly measuring changes in viable cell number over time using manual or automated counting methods such as hemocytometer-based counting or instrument-assisted cell enumeration, enabling construction of growth curves that reflect population expansion dynamics in response to culture conditions. A widely used approach is trypan blue exclusion with hemocytometer counting, where membrane-compromised (non-viable) cells take up the dye, allowing discrimination between viable and non-viable cells while simultaneously enabling total cell number quantification. Repeated sampling across time points allows estimation of proliferation rate, growth phases, and comparative growth kinetics between experimental conditions.
-
Colony Formation (Clonogenic) Assay
The clonogenic (colony formation) assay measures the ability of a single cell to retain reproductive viability and form a macroscopic colony, typically defined as a cluster derived from one progenitor cell after a defined growth period. This assay is widely used to evaluate cell survival after exposure to ionizing radiation or cytotoxic treatments and is considered a standard method in radiation biology for generating dose-response relationships of reproductive cell death. Colony formation reflects long-term proliferative capacity rather than short-term metabolic activity, and survival is quantified by comparing treated versus untreated conditions based on colony number and derived survival fractions.
-
Cell Viability Determination by MTT Colorimetric Assay
The following protocol uses the MTT colorimetric assay as a classic literature-established method for assessing cell viability/metabolic activity in cultured mammalian cells. MTT[3-(4,5-dimethylthiazol-2-yl)-2,5-diphenyltetrazolium bromide] is reduced by metabolically active cells to a colored formazan product; the amount of formazan is quantified spectrophotometrically and provides an indirect measure of metabolically active viable cells. Importantly, MTT reduction reflects cellular oxidoreductase/metabolic activity rather than an absolute direct count of living cells, so changes in cellular metabolism can alter the signal independently of cell number.
-
EdU Incorporation Assay (Click Chemistry-Based DNA Synthesis Measurement)
The EdU incorporation assay measures DNA synthesis by adding the thymidine analog 5-ethynyl-2′-deoxyuridine to cells or tissues, where it is incorporated into newly synthesized DNA during S phase. Incorporated EdU is detected by copper-catalyzed azide-alkyne cycloaddition, in which a fluorescent azide covalently reacts with the ethynyl group on EdU, allowing S-phase cells to be detected by fluorescence microscopy, flow cytometry, or high-content imaging. EdU detection does not require DNA denaturation or anti-BrdU antibody access, which preserves sample structure and improves compatibility with immunostaining and multiparameter cytometry compared with BrdU-based detection. EdU can be cytotoxic in a cell-type- and exposure-dependent manner, so pulse duration, concentration, and continuous-labeling designs should be validated for each cell type.
-
Ki-67 Immunostaining Proliferation Assay
Ki-67 immunostaining measures the growth fraction of a cell population by detecting Ki-67, a nuclear antigen present in proliferating cells and absent in quiescent G0 cells. The readout is the percentage of Ki-67-positive nuclei among total counted cells, commonly called the Ki-67 labeling index or proliferation index.
-
Apoptosis
Apoptosis, also called programmed cell death, is generally characterized by distinct morphological characteristics.
-
TUNEL staining for apoptotic DNA fragmentation
TUNEL staining detects DNA strand breaks by using terminal deoxynucleotidyl transferase to add labeled nucleotides to exposed 3′-OH DNA termini, generating either microscopic staining in fixed cells or tissue sections, or fluorescence/cytometric signal in cell suspensions. TUNEL positivity reflects DNA fragmentation but should not be interpreted alone as definitive apoptosis, because TUNEL can also label necrotic, autolytic, mechanically damaged, or DNA-repair-associated DNA breaks.
-
PCNA Immunodetection Proliferation Assay
PCNA immunodetection measures proliferative activity by detecting proliferating cell nuclear antigen, a nuclear protein associated with DNA polymerase δ function and DNA replication. The assay readout is the proportion of PCNA-positive nuclei among total counted cells, but PCNA labeling is not identical to BrdU labeling because PCNA can mark late G1/early S-associated replication competence and may persist beyond active DNA synthesis depending on fixation and extraction conditions.
-
Protocol for Cell Counting and Cell Density Analysis
Cell counting and cell-density analysis estimate the number of cells in a known volume or field area. Manual hemocytometer counting uses a chamber of defined geometry to convert counted cells into cells/mL, while automated counters and image-analysis workflows detect cell objects from optical, brightfield, fluorescence, impedance, or digital-image features. Trypan blue viability counting is based on dye exclusion: viable cells with intact membranes exclude dye, while non-viable cells with compromised membranes stain blue. The readout is total cell density, viable-cell density, dead-cell density, and percent viability. Cell density can also be estimated from microscopy images by counting objects per image area, from flow cytometry using calibrated volume or reference particles, or from in situ microscopy in bioreactors after calibration against reference methods such as hemocytometer or flow cytometry.
-
Mitochondrial membrane-potential and mitochondrial mass staining
Mitochondrial membrane potential staining measures the electrochemical polarization across the mitochondrial inner membrane in live cells using lipophilic cationic fluorescent probes; early rhodamine-based work showed that selective mitochondrial dye accumulation is lost when the mitochondrial transmembrane potential is dissipated. JC-1 reports mitochondrial polarization by shifting from green monomer fluorescence to red J-aggregate fluorescence as dye concentration increases within energized mitochondria; therefore, the red/green fluorescence ratio is used as a relative readout of mitochondrial membrane potential. TMRE or TMRM staining provides a single-channel relative readout because these cationic rhodamine esters accumulate in polarized mitochondria, and lower fluorescence indicates reduced mitochondrial polarization when acquisition and dye-loading conditions are controlled. Mitochondrial mass staining is commonly performed with MitoTracker Green FM or related MitoTracker dyes as
-
Apoptosis Solutions
Apoptosis is a regulated, generally non-lytic cell-death pathway that removes unwanted, damaged, infected, or abnormal cells through coordinated morphological changes, caspase activation, DNA fragmentation, and membrane remodeling. The intrinsic apoptosis pathway is controlled mainly by mitochondrial outer membrane permeabilization, BCL-2 family proteins, cytochrome c release, apoptosome formation, caspase-9 activation, and downstream executioner caspase-3/7 activation. The extrinsic apoptosis pathway is initiated by death receptors such as Fas, TNFR, and TRAIL receptors, which recruit adaptor proteins and activate caspase-8 before engaging executioner caspases or mitochondrial amplification through BID cleavage. Apoptosis is linked to many phenotypes, including cancer cell killing, tissue homeostasis, immune regulation, neurodegeneration, infection response, and treatment-induced cytotoxicity; unresolved questions include how apoptosis interacts with necroptosis, pyroptosis, ferroptos
-
MTT Cell Proliferation Assay
The MTT assay is a colorimetric endpoint assay for estimating viable cell number, cell growth, cytotoxicity, or cell activation in cultured mammalian cells. Living cells reduce the yellow tetrazolium salt MTT into purple/blue formazan, while dead cells do not generate the same signal; the resulting color can be quantified with a multiwell spectrophotometer. MTT reduction is commonly interpreted as a readout of metabolic activity that often correlates with viable cell number, but it should not be treated as a direct cell-counting method unless the assay is optimized for the cell type and experimental condition. Studies show that MTT reduction can involve mitochondrial and non-mitochondrial reducing systems, and formazan may accumulate in intracellular lipid droplets rather than simply marking mitochondria.


Purity & Documentation
-
Data Sheet (340 KB)
-
SDS (480 KB)
- English - EN (480 KB)
- Français - FR (480 KB)
- Deutsch - DE (480 KB)
- Norwegian - NO (480 KB)
- Español - ES (480 KB)
- Swedish - SV (480 KB)
- Italian - IT (480 KB)
- Korean - KR (480 KB)
- Portuguese - PT (480 KB)
-
Handling Instructions (2659 KB)
References
[2]. Prosperini A, et al. A Review of the Mycotoxin Enniatin B. Frontiers in public health. 2017;5:304.
[3]. Kalayou S, et al. An investigation of the endocrine disrupting potential of enniatin B using in vitro bioassays. Toxicology letters. 2015 Mar 04;233(2):84-94. [Content Brief]
[4]. Rodríguez-Carrasco Y, et al. Mouse tissue distribution and persistence of the food-born fusariotoxins Enniatin B and Beauvericin. Toxicology letters. 2016 Apr 15;247:35-44. [Content Brief]
[5]. Ivanova L, et al. Lysosomes as a possible target of enniatin B-induced toxicity in Caco-2 cells. Chemical research in toxicology. 2012 Aug 20;25(8):1662-74. [Content Brief]
[8]. Behm C, et al. The Fusarium toxin enniatin B exerts no genotoxic activity, but pronounced cytotoxicity in vitro. Molecular nutrition & food research. 2009 Apr;53(4):423-30. [Content Brief]
[9]. Ficheux AS, et al. Effects of beauvericin, enniatin b and moniliformin on human dendritic cells and macrophages: an in vitro study. Toxicon : official journal of the International Society on Toxinology. 2013 Sep;71:1-10. [Content Brief]
[10]. Krug I, et al. Transport of enniatin B and enniatin B1 across the blood-brain barrier and hints for neurotoxic effects in cerebral cells. PloS one. 2018;13(5):e0197406. [Content Brief]
[11]. Dornetshuber-Fleiss R, et al. The naturally born fusariotoxin enniatin B and sorafenib exert synergistic activity against cervical cancer in vitro and in vivo. Biochemical pharmacology. 2015 Feb 01;93(3):318-331. [Content Brief]


Complete Stock Solution Preparation Table
Please refer to the solubility information to select the appropriate solvent. Once prepared, please aliquot and store the solution to prevent product inactivation from repeated freeze-thaw cycles.
Storage method and period of stock solution: -80°C, 6 months; -20°C, 1 month. When stored at -80°C, please use it within 6 months. When stored at -20°C, please use it within 1 month.
| Optional Solvent | Concentration Solvent Mass | 1 mg | 5 mg | 10 mg | 25 mg |
|---|---|---|---|---|---|
| DMSO | 1 mM | 1.5629 mL | 7.8147 mL | 15.6294 mL | 39.0735 mL |
| 5 mM | 0.3126 mL | 1.5629 mL | 3.1259 mL | 7.8147 mL | |
| 10 mM | 0.1563 mL | 0.7815 mL | 1.5629 mL | 3.9073 mL | |
| 15 mM | 0.1042 mL | 0.5210 mL | 1.0420 mL | 2.6049 mL |


Enniatin B Related Classifications
HY-N3806 Related Classifications
 Powered by Bioz