



Forskolin (Coleonol) (GMP) is a potent adenylate cyclase activator with an IC50 of 41 nM and an EC50 of 0.5 μM for type I adenylyl cyclase. Forskolin (GMP) is also an inducer of intracellular cAMP formation. Forskolin (GMP) induces differentiation of various cell types and activates pregnane X receptor (PXR) and FXR. Forskolin (GMP) exerts a inotropic effect on the heart, and has platelet antiaggregatory and antihypertensive actions. Forskolin (GMP) also induces autophagy.
For research use only. We do not sell to patients.
- CAS No.: 66575-29-9
- Formula: C22H34O7
- Molecular Weight:410.50
-
Storage:
Please store the product under the recommended conditions in the Certificate of Analysis.

To place orders, for customer services and technical support, please contact: MedChemExpress USA
Tel: 609-228-6898 E-mail: [email protected] [email protected]


-
 Biological Activity
-
Chemical Information
- Protocols
- Purity & Documentation
- References
-
 Help & FAQs


-
HY-15371
ForskolinAdenylate Cyclase Activator -

HY-15371R
Forskolin (Standard)Adenylate Cyclase Activator -
HY-100396
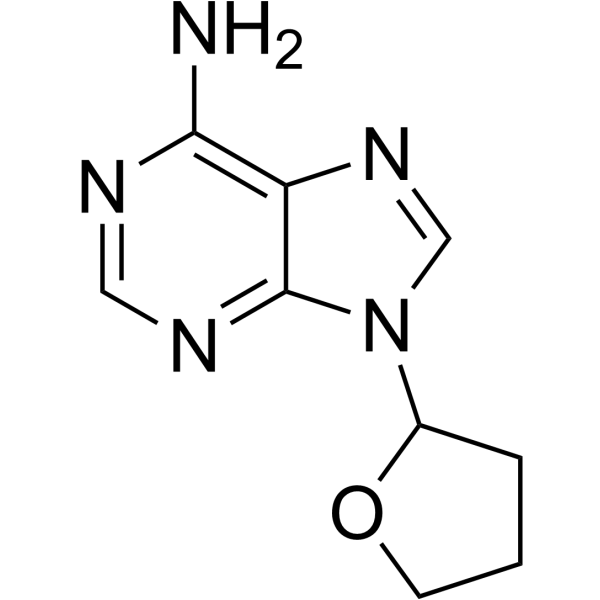
SQ22536Adenylate Cyclase Inhibitor -
HY-10432
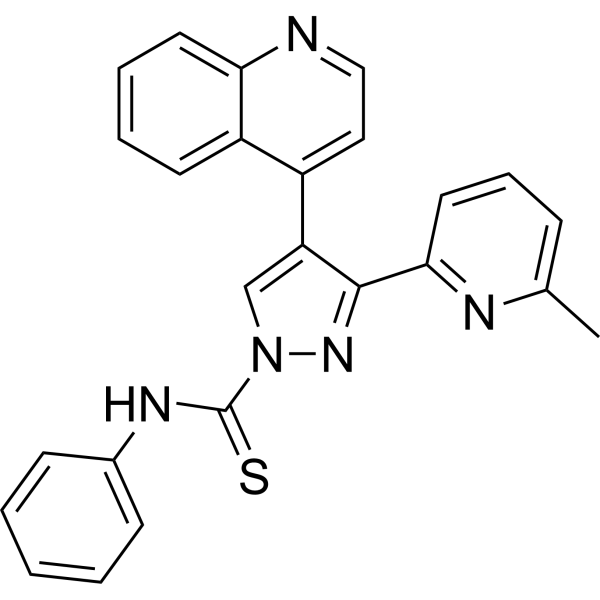
A 83-01ALK4/5/7 Inhibitor -
HY-103194
KH7Soluble Adenylyl Cyclase Inhibitor -
HY-10432G
A 83-01 (GMP)ALK4/5/7 Inhibitor -
HY-101279
ST034307AC1 Inhibitor -

HY-10432R
A 83-01 (Standard)ALK4/5/7 Inhibitor -
HY-P0252
α-MSHMC4R Agonist -
HY-101862
CB-7921220 -
HY-109586
BRL-50481PDE Inhibitor -
HY-17592
BithionolAnti-infection Agent


Biological Activity
Description
Cellular Effect
|
Cell Line

|
Type | Value | Description | References |
|---|---|---|---|---|
| BT-474 | IC50 |
>100 μM
Compound: 1
|
Antiproliferative activity against human BT474 cells after 48 hrs by Alamar blue assay
Antiproliferative activity against human BT474 cells after 48 hrs by Alamar blue assay
|
[PMID: 28838692] |
| HEK293 | EC50 |
0.0937 μM
Compound: FSK
|
Agonist activity at recombinant human AC8 expressed in human HEK293 cells assessed as fold increase in cAMP level by LANCE Ultra cAMP Detection kit method
Agonist activity at recombinant human AC8 expressed in human HEK293 cells assessed as fold increase in cAMP level by LANCE Ultra cAMP Detection kit method
|
[PMID: 31776060] |
| Hepatocyte | EC50 |
0.7 μM
Compound: Colforsin
|
Activation of PXR in human cryopreserved hepatocytes assessed as induction of CYP3A4
Activation of PXR in human cryopreserved hepatocytes assessed as induction of CYP3A4
|
[PMID: 20966043] |
| HepG2 | EC50 |
2.7 μM
Compound: Colforsin
|
Activation of human PXR expressed in human HepG2 (DPX-2) cells assessed as induction of CYP3A4 after 24 hrs by luminescent analysis
Activation of human PXR expressed in human HepG2 (DPX-2) cells assessed as induction of CYP3A4 after 24 hrs by luminescent analysis
|
[PMID: 20966043] |
| HepG2 | EC50 |
7.1 μM
Compound: Colforsin
|
Activation of rat PXR expressed in human HepG2 cells after 24 hrs by luciferase reporter gene based luminescent analysis
Activation of rat PXR expressed in human HepG2 cells after 24 hrs by luciferase reporter gene based luminescent analysis
|
[PMID: 20966043] |
| HepG2 | EC50 |
7.9 μM
Compound: Colforsin
|
Activation of human PXR expressed in human HepG2 (DPX-2) cells after 24 hrs by luciferase reporter gene based luminescent analysis
Activation of human PXR expressed in human HepG2 (DPX-2) cells after 24 hrs by luciferase reporter gene based luminescent analysis
|
[PMID: 20966043] |
| MCF7 | IC50 |
63.3 μM
Compound: 1
|
Antiproliferative activity against human MCF7 cells after 48 hrs by Alamar blue assay
Antiproliferative activity against human MCF7 cells after 48 hrs by Alamar blue assay
|
[PMID: 28838692] |
| NIH-3T3-G185 | IC50 |
188.2 μM
Compound: Forskolin
|
TP_TRANSPORTER: inhibition of LDS-751 efflux in NIH-3T3-G185 cells
TP_TRANSPORTER: inhibition of LDS-751 efflux in NIH-3T3-G185 cells
|
[PMID: 11716514] |
| NIH-3T3-G185 | IC50 |
80.2 μM
Compound: Forskolin
|
TP_TRANSPORTER: inhibition of Daunorubicin efflux in NIH-3T3-G185 cells
TP_TRANSPORTER: inhibition of Daunorubicin efflux in NIH-3T3-G185 cells
|
[PMID: 11716514] |
| Vero | CC50 |
674 μM
Compound: 10
|
Cytotoxicity against Vero E6 cells by MTT assay
Cytotoxicity against Vero E6 cells by MTT assay
|
[PMID: 17663539] |
| Vero | EC50 |
7.5 μM
Compound: 10
|
Antiviral activity against SARS coronavirus in Vero E6 cells assessed as inhibition of viral replication by ELISA
Antiviral activity against SARS coronavirus in Vero E6 cells assessed as inhibition of viral replication by ELISA
|
[PMID: 17663539] |
| Vero C1008 | IC50 |
>2.0 × 10⁵M
Compound: COVC-1212934635
|
Antiviral activity determined as inhibition of SARS-CoV-2 induced cytotoxicity of VERO-6 cells at 10 uM after 48 hours exposure to 0.01 MOI SARS CoV-2 virus by high content imaging
Antiviral activity determined as inhibition of SARS-CoV-2 induced cytotoxicity of VERO-6 cells at 10 uM after 48 hours exposure to 0.01 MOI SARS CoV-2 virus by high content imaging
|
10.6019/CHEMBL4651402 |
In Vitro
Forskolin (Coleonol) (GMP) is also a potent exosome biogenesis and/or secretion activator in prostate cancer (PC) cells[8].
Forskolin (GMP) is a naturally occurring diterpene isolated from Coleus forskholii, directly activates adenylyl cyclase (AC) through its catalytic subunit to increase intracellular levels of cyclic adenosine monophosphate (cAMP)[1].
Forskolin (GMP) affects the proliferation of the human T-cell lines such as Kit 225 and MT-2. Forskolin (GMP) treatment inhibits the proliferation of both Kit 225 and MT-2 cells in a dose-dependent manner with an IC50 equal to ~5 μM Forskolin (GMP). Forskolin (GMP) treatment (10-100 μM) increases cAMPi levels ~5- to 20-fold above basal levels, which reache maximum levels between 50-100 μM Forskolin (GMP)[6].
MedChemExpress (MCE) has not independently confirmed the accuracy of these methods. They are for reference only. Further protocols information, click here.
In Vivo
The average blood glucose in the healthy rat group is 102.12 mg/dL, 101.25 for control group and 103 in Forskolin (GMP) group. The data shows that glucose levels at the end of the study are lower in Forskolin (GMP) group, with a significant difference according to the statistical tests applied[7].
MedChemExpress (MCE) has not independently confirmed the accuracy of these methods. They are for reference only.


Chemical Information
-
CAS No. 66575-29-9
-
Molecular Weight 410.50
-
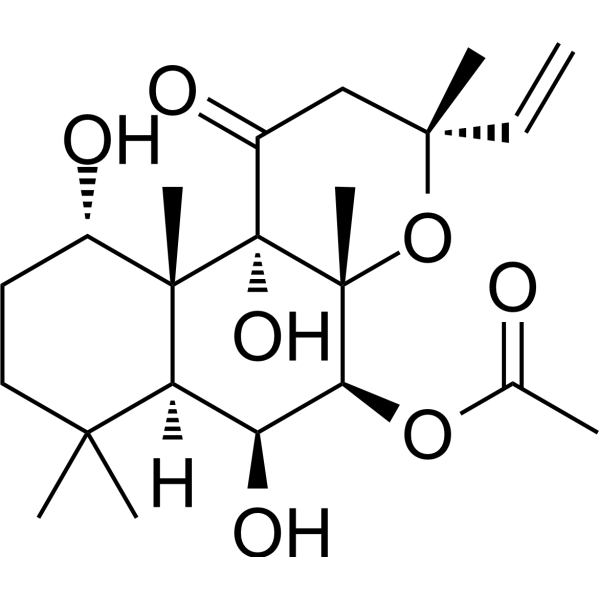
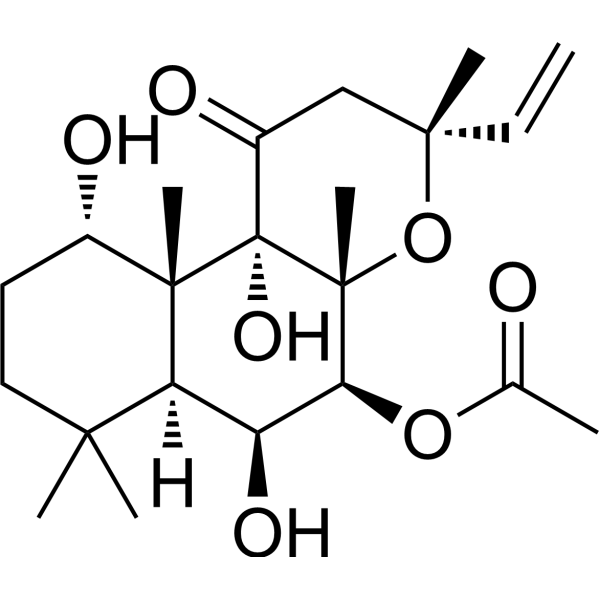
Formula C22H34O7
-
SMILES
O=C1[C@@]2(O)[C@]([C@@H](OC(C)=O)[C@@H](O)[C@@]3([H])C(C)(C)CC[C@H](O)[C@@]32C)(C)O[C@@](C)(C=C)C1
-
Synonyms
Coleonol (GMP); Colforsin (GMP); HL 362 (GMP)
-
Shipping
Room temperature in continental US; may vary elsewhere.
-
Storage
Please store the product under the recommended conditions in the Certificate of Analysis.

Protocols
-
Cell Cytotoxicity Assay
Cytotoxicity assays are usually based on the assessment of cell membrane damage, which can also be indirectly detected by measuring cell viability. Detection methods include MTT assay, CKK-8 assay, LDH assay and ATP assay, etc.
-
Autophagy
Autophagy is a process in which eukaryotic cells use lysosomes to degrade their own cytoplasmic proteins and damaged organelles under the regulation of autophagy related gene (Atg). Microtubule-associated proteins light chain 3 (LC3) is recognized as autophagy marker, which transfers from cytoplasmic LC3 (LC3-I) to membrane type (LC3-II). LC3-II/I ratio could be detected by Western Blot and fluorescence microscopy.
-
Lysosome and acidic-vesicle live-cell staining
Lysosome and acidic-vesicle live-cell staining detects acidic intracellular compartments by using membrane-permeant acidotropic probes that accumulate in low-pH vesicles, including lysosomes, late endosomes, autolysosomes, and acidic phagosomes. LysoTracker staining is commonly used as an intensity-based readout of acidic lysosomal compartment abundance or enlargement, while acridine orange produces green fluorescence in less concentrated compartments and red fluorescence after concentration-dependent accumulation in acidic vesicular organelles. Loss or reduction of acridine-orange red signal can be used as a readout of lysosomal membrane permeabilization or reduced acidic-vesicle integrity. This protocol is designed for live cultured cells and can be adapted for fluorescence microscopy, high-content imaging, plate-reader readout, or flow cytometry when the selected literature supports the readout. Because these dyes report acidotropic accumulation rather than lysosome identity alone,
-
Macroautophagy Solutions
Macroautophagy is a conserved lysosome-dependent degradation pathway in which cytoplasmic material is sequestered into double-membrane autophagosomes and delivered to lysosomes for degradation and recycling. The pathway supports cellular homeostasis during nutrient limitation, organelle stress, protein-aggregate accumulation, infection, differentiation, and tissue remodeling by coupling cargo sequestration, autophagosome maturation, lysosomal fusion, and degradation of cargo-derived macromolecules. The core molecular sequence includes initiation by nutrient- and stress-regulated autophagy machinery, autophagosome nucleation, LC3/ATG8-family conjugation to autophagosomal membranes, cargo selection through receptors such as SQSTM1/p62, autophagosome-lysosome fusion, and lysosomal degradation. LC3 was identified as a mammalian homolog of yeast Atg8 that localizes to autophagosomal membranes after processing, and p62/SQSTM1 was shown to connect ubiquitinated cargo with autophagic degradati


Purity & Documentation
References
[1]. Robbins JD, et al. Forskolin carbamates: binding and activation studies with type I adenylyl cyclase. J Med Chem. 1996 Jul 5;39(14):2745-52. [Content Brief]
[2]. Matsumiya W, et al. Forskolin modifies retinal vascular development in Mrp4-knockout mice. Invest Ophthalmol Vis Sci. 2012 Dec 7;53(13):8029-35. [Content Brief]
[3]. Mayati A, et al. Functional polarization of human hepatoma HepaRG cells in response to forskolin. Sci Rep. 2018 Oct 31;8(1):16115. [Content Brief]
[4]. Awad JA, et al. Interactions of forskolin and adenylate cyclase. Effects on substrate kinetics and protection against inactivation by heat and N-ethylmaleimide. J Biol Chem. 1983 Mar 10;258(5):2960-5. [Content Brief]
[5]. Seamon KB, et al. Structure-activity relationships for activation of adenylate cyclase by the diterpene forskolin and its derivatives. J Med Chem. 1983 Mar;26(3):436-9. [Content Brief]
[6]. Ríos-Silva M, et al. Effect of chronic administration of forskolin on glycemia and oxidative stress in rats with and without experimental diabetes. Int J Med Sci. 2014 Mar 11;11(5):448-52. [Content Brief]
[7]. Rodriguez G, et al. Forskolin-inducible cAMP pathway negatively regulates T-cell proliferation by uncoupling the interleukin-2 receptor complex. J Biol Chem. 2013 Mar 8;288(10):7137-46. [Content Brief]
[8]. Amrita Datta, et al. High-throughput screening identified selective inhibitors of exosome biogenesis and secretion: A drug repurposing strategy for advanced cancer. Sci Rep. 2018 May 25;8(1):8161. [Content Brief]

Calculators
Concentration (start) × Volume (start) = Concentration (final) × Volume (final)


Forskolin (GMP) Related Classifications
HY-15371G Related Classifications
 Powered by Bioz