



Ganglioside GM1

Based on 1 Customer Validation
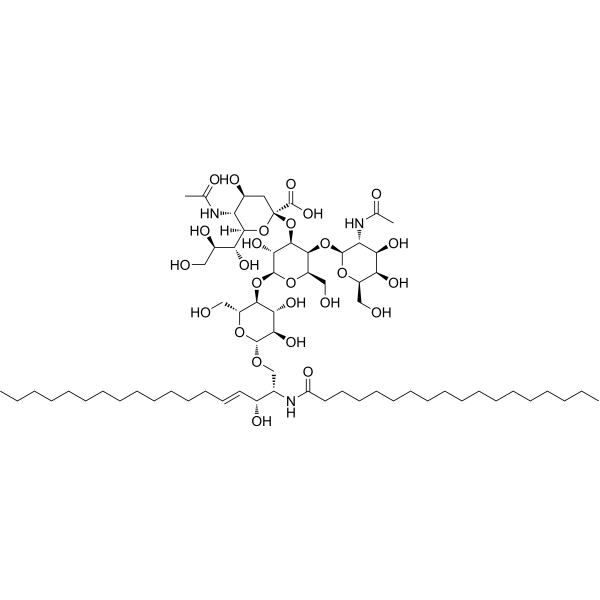
Ganglioside GM1 is a type of glycosphingolipid, mainly found on the cell membranes of the central nervous system of vertebrates. Ganglioside GM1 exerts neuroprotective effects by reducing excessive activation of NMDAR, activating TrkA and ERK1/2, and inhibiting oxidative stress and cell apoptosis and autophagy. Ganglioside GM1 can be used in the research of diseases such as traumatic brain injury, Parkinson's disease, Alzheimer's disease, and Huntington's disease.
For research use only. We do not sell to patients.
- Purity : 99%
- CAS No.: 37758-47-7
-
Storage:Powder -20°C, 3 years ; In solvent -80°C, 6 months , -20°C, 1 month


To place orders, for customer services and technical support, please contact: MedChemExpress USA
Tel: 609-228-6898 E-mail: [email protected] [email protected]


-
 Biological Activity
-
Chemical Information
-
Solvent & Solubility
- Protocols
- Purity & Documentation
- References
-
 Help & FAQs


-

HY-W747597
Ganglioside GD1b Disodium Salt (Bovine Brain) -

HY-141569
Ganglioside GD1aAnti-inflammatory Agent -

HY-165740
Ganglioside GD2Tumor-associated Antigen -

HY-131686
Ganglioside GT1b (bovine) ammoniumGanglioside -
HY-148385
Ganglioside GM2Tumor Antigen -
HY-101047
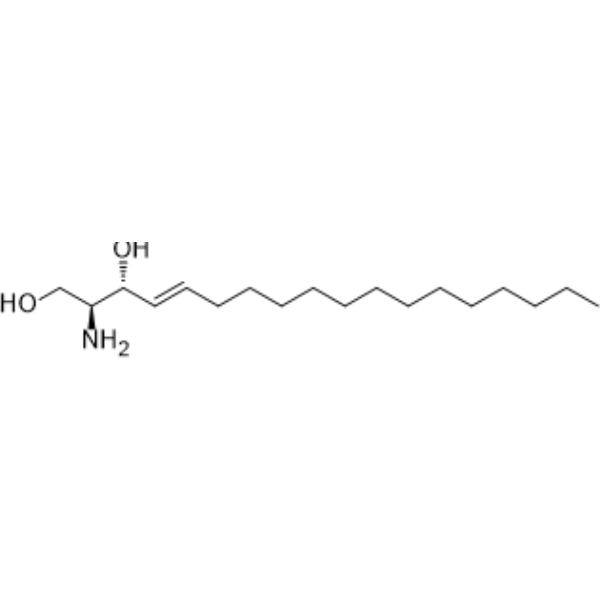
D-erythro-SphingosinePKC Inhibitor -

HY-W714151
Ganglioside ga1Ester Product -

HY-131686A
Ganglioside GT1b (porcine) ammoniumGanglioside -

HY-101047R
D-erythro-Sphingosine (Standard)PKC Inhibitor -

HY-W342441
Monosialoganglioside GM3 (bovine)Akt Inhibitor
All iGluR Isoforms
More

Biological Activity
Description
|
TrkA |
ERK1 |
ERK2 |
In Vitro
Ganglioside GM1 significantly enhances the activation effect of nerve growth factor (NGF) on TrkA in PC12 cells. The GM1 oligosaccharide chain (OligoGM1) can directly interact with TrkA, activate the ERK1/2 pathway, promote differentiation, and exert neuroprotective effects[2][3].
MedChemExpress (MCE) has not independently confirmed the accuracy of these methods. They are for reference only. Further protocols information, click here.
In Vivo
Ganglioside GM1 (i.p.) reduces the infarct area in the mouse ischemic injury model, inhibits the expression of NMDAR1, and lowers calcium overload; in the rat cerebral ischemia model, it reduces the ratio of LC3-II/LC3-I, the expression of P62 and Beclin-1, inhibits autophagy, and improves the neurological behavior score[1].
Ganglioside GM1 (15 mg/kg, i.p.) inhibits endoplasmic reticulum stress and reduces brain injury in diabetic rat models by up-regulating GRP78 and down-regulating CHOP/caspial-12[1].
MedChemExpress (MCE) has not independently confirmed the accuracy of these methods. They are for reference only.


Chemical Information
-
CAS No. 37758-47-7
-
Appearance Solid
-
Color White to off-white
-
SMILES
[Ganglioside GM1]
-
Structure Classification
-
Initial Source
hog epididymis
-
Shipping
Room temperature in continental US; may vary elsewhere.
-
Storage
Powder -20°C 3 years In solvent -80°C 6 months -20°C 1 month


Solvent & Solubility
In Vitro:
0.01 M NaOH : 50 mg/mL (Need ultrasonic)
DMSO : 50 mg/mL (Need ultrasonic; Hygroscopic DMSO has a significant impact on the solubility of product, please use newly opened DMSO)
In Vivo:
Select the appropriate dissolution method based on your experimental animal and administration route.
- For the following dissolution methods, please ensure to first prepare a clear stock solution using an In Vitro approach and then sequentially add co-solvents:
- To ensure reliable experimental results, the clarified stock solution can be appropriately stored based on storage conditions. As for the working solution for In Vivo experiments, it is recommended to prepare freshly and use it on the same day.
- The percentages shown for the solvents indicate their volumetric ratio in the final prepared solution. If precipitation or phase separation occurs during preparation, heat and/or sonication can be used to aid dissolution.
Add each solvent one by one: 10% DMSO 40% PEG300 5% Tween-80 45% Saline
Solubility: ≥ 1.25 mg/mL; Clear solution
This protocol yields a clear solution of ≥ 1.25 mg/mL (saturation unknown).
Taking 1 mL working solution as an example, add 100 μL DMSO stock solution (12.5 mg/mL) to 400 μL PEG300, and mix evenly; then add 50 μL Tween-80 and mix evenly; then add 450 μL Saline to adjust the volume to 1 mL.
Preparation of Saline: Dissolve 0.9 g sodium chloride in ddH₂O and dilute to 100 mL to obtain a clear Saline solution.
Add each solvent one by one: 10% DMSO 90% (20% SBE-β-CD in Saline)
Solubility: ≥ 1.25 mg/mL; Clear solution
This protocol yields a clear solution of ≥ 1.25 mg/mL (saturation unknown).
Taking 1 mL working solution as an example, add 100 μL DMSO stock solution (12.5 mg/mL) to 900 μL 20% SBE-β-CD in Saline, and mix evenly.
Preparation of 20% SBE-β-CD in Saline (4°C, storage for one week): 2 g SBE-β-CD powder is dissolved in 10 mL Saline, completely dissolve until clear.
In Vivo Dissolution Calculator
Please enter the basic information of animal experiments:
-
-
-
-
Recommended: Prepare an additional quantity of animals to account for potential losses during experiments.
Please enter your animal formula composition:
-
%DMSO +
Recommended: Keep the proportion of DMSO in working solution below 2% if your animal is weak.
-
%+
-
+%Tween-80 + +
-
%Saline +
The co-solvents required include: DMSO, . All of co-solvents are available by MedChemExpress (MCE). , Tween 80. All of co-solvents are available by MedChemExpress (MCE).
Working solution concentration: 0.22 mg/mL
Method for preparing stock solution: mg drug dissolved in μL DMSO. Stock solution concentration: mg/mL.
1. Take μL DMSO stock solution;
2. Add μL .
μL , mix evenly;
3. Then add μL Tween 80, mix evenly;
4. Then add μL
Please ensure that the stock solution in the first step is dissolved to a clear state, and add co-solvents in sequence. You can use ultrasonic heating (ultrasonic cleaner, recommended frequency 20-40 kHz), vortexing, etc. to assist dissolution.

Protocols
-
Apoptosis
Apoptosis, also called programmed cell death, is generally characterized by distinct morphological characteristics.
-
TUNEL staining for apoptotic DNA fragmentation
TUNEL staining detects DNA strand breaks by using terminal deoxynucleotidyl transferase to add labeled nucleotides to exposed 3′-OH DNA termini, generating either microscopic staining in fixed cells or tissue sections, or fluorescence/cytometric signal in cell suspensions. TUNEL positivity reflects DNA fragmentation but should not be interpreted alone as definitive apoptosis, because TUNEL can also label necrotic, autolytic, mechanically damaged, or DNA-repair-associated DNA breaks.
-
Annexin V plus membrane-impermeant dye apoptosis staining
Annexin V-based apoptosis assays rely on the detection of phosphatidylserine (PS) externalization from the inner leaflet of the plasma membrane to the outer leaflet, an early biochemical hallmark of apoptosis. Fluorescently labeled Annexin V binds PS in a calcium-dependent manner, enabling identification of early apoptotic cells by flow cytometry or fluorescence microscopy. When combined with a membrane-impermeant DNA-binding dye (e. g. , propidium iodide), this approach allows discrimination between viable (Annexin V−/dye−), early apoptotic (Annexin V+/dye−), and late apoptotic or necrotic (Annexin V+/dye+) cell populations by assessing membrane integrity and PS exposure.
-
ROS/oxidative-stress fluorescent staining
ROS/oxidative-stress fluorescent staining uses cell-permeant fluorogenic probes that become fluorescent after oxidation inside cells or tissues; commonly used examples include DCFH-DA/DCFDA for broad cellular oxidant detection, DHE for superoxide-related signal detection, MitoSOX for mitochondrial superoxide-related signal detection, and CellROX probes for oxidative-stress-associated fluorescence readouts. The assay detects probe oxidation rather than a single ROS species unless the probe and analysis method have been chemically validated for that species. DCFH-DA enters cells, is deacetylated by intracellular esterases to DCFH, and produces fluorescent DCF after oxidation, so the readout is used as an operational measure of total cellular oxidative stress rather than a species-specific ROS measurement. DHE and MitoSOX can report superoxide-related oxidation, but red fluorescence alone can include non-specific ethidium-like oxidation products; HPLC or optimized spectral approaches are
-
Human pluripotent stem cell midbrain dopaminergic neuron differentiation
Human pluripotent stem cells are directed toward midbrain dopaminergic neurons by first inducing a neural floor-plate-like progenitor state, then patterning cells with ventralizing SHH signaling and midbrain/WNT-FGF cues, and finally maturing progenitors into neurons expressing dopaminergic markers such as TH, NURR1/NR4A2, PITX3, DAT/SLC6A3, VMAT2/SLC18A2, GIRK2/KCNJ6, FOXA2, LMX1A, and EN1. The main readouts are loss of pluripotency, acquisition of FOXA2+/LMX1A+ midbrain floor-plate progenitors, emergence of βIII-tubulin+/MAP2+ neurons, and production of TH+ dopaminergic neurons with molecular, dopamine-release, and electrophysiological features of midbrain dopaminergic identity.
-
Autophagy
Autophagy is a process in which eukaryotic cells use lysosomes to degrade their own cytoplasmic proteins and damaged organelles under the regulation of autophagy related gene (Atg). Microtubule-associated proteins light chain 3 (LC3) is recognized as autophagy marker, which transfers from cytoplasmic LC3 (LC3-I) to membrane type (LC3-II). LC3-II/I ratio could be detected by Western Blot and fluorescence microscopy.
-
Apoptosis Solutions
Apoptosis is a regulated, generally non-lytic cell-death pathway that removes unwanted, damaged, infected, or abnormal cells through coordinated morphological changes, caspase activation, DNA fragmentation, and membrane remodeling. The intrinsic apoptosis pathway is controlled mainly by mitochondrial outer membrane permeabilization, BCL-2 family proteins, cytochrome c release, apoptosome formation, caspase-9 activation, and downstream executioner caspase-3/7 activation. The extrinsic apoptosis pathway is initiated by death receptors such as Fas, TNFR, and TRAIL receptors, which recruit adaptor proteins and activate caspase-8 before engaging executioner caspases or mitochondrial amplification through BID cleavage. Apoptosis is linked to many phenotypes, including cancer cell killing, tissue homeostasis, immune regulation, neurodegeneration, infection response, and treatment-induced cytotoxicity; unresolved questions include how apoptosis interacts with necroptosis, pyroptosis, ferroptos
-
Lysosome and acidic-vesicle live-cell staining
Lysosome and acidic-vesicle live-cell staining detects acidic intracellular compartments by using membrane-permeant acidotropic probes that accumulate in low-pH vesicles, including lysosomes, late endosomes, autolysosomes, and acidic phagosomes. LysoTracker staining is commonly used as an intensity-based readout of acidic lysosomal compartment abundance or enlargement, while acridine orange produces green fluorescence in less concentrated compartments and red fluorescence after concentration-dependent accumulation in acidic vesicular organelles. Loss or reduction of acridine-orange red signal can be used as a readout of lysosomal membrane permeabilization or reduced acidic-vesicle integrity. This protocol is designed for live cultured cells and can be adapted for fluorescence microscopy, high-content imaging, plate-reader readout, or flow cytometry when the selected literature supports the readout. Because these dyes report acidotropic accumulation rather than lysosome identity alone,
-
Macroautophagy Solutions
Macroautophagy is a conserved lysosome-dependent degradation pathway in which cytoplasmic material is sequestered into double-membrane autophagosomes and delivered to lysosomes for degradation and recycling. The pathway supports cellular homeostasis during nutrient limitation, organelle stress, protein-aggregate accumulation, infection, differentiation, and tissue remodeling by coupling cargo sequestration, autophagosome maturation, lysosomal fusion, and degradation of cargo-derived macromolecules. The core molecular sequence includes initiation by nutrient- and stress-regulated autophagy machinery, autophagosome nucleation, LC3/ATG8-family conjugation to autophagosomal membranes, cargo selection through receptors such as SQSTM1/p62, autophagosome-lysosome fusion, and lysosomal degradation. LC3 was identified as a mammalian homolog of yeast Atg8 that localizes to autophagosomal membranes after processing, and p62/SQSTM1 was shown to connect ubiquitinated cargo with autophagic degradati
-
Alzheimer’s Disease Modeling
Alzheimer’s Disease (AD) is a neurodegenerative disorder characterized by a progressive decline in cognitive functions and loss of specific types of neurons and synapses. Alzheimer's symptoms can be simulated in mice by injecting drugs (such as Aβ) or genetically modified.


Purity & Documentation
-
Data Sheet (271 KB)
-
SDS (251 KB)
- English - EN (251 KB)
- Français - FR (251 KB)
- Deutsch - DE (251 KB)
- Norwegian - NO (251 KB)
- Español - ES (251 KB)
- Swedish - SV (251 KB)
- Italian - IT (251 KB)
- Korean - KR (251 KB)
- Portuguese - PT (251 KB)
-
Handling Instructions (2659 KB)
References
[1]. Wenchao Zhang, et al. Pathophysiology of Ganglioside GM1 in Ischemic Stroke: Ganglioside GM1: A Critical Review. Cell Transplant. 2019 Jun;28(6):657-661. [Content Brief]
[2]. Chiricozzi E, et al. GM1 Ganglioside Is A Key Factor in Maintaining the Mammalian Neuronal Functions Avoiding Neurodegeneration. Int J Mol Sci. 2020 Jan 29;21(3):868. [Content Brief]
[3]. Guo Z. Ganglioside GM1 and the Central Nervous System. Int J Mol Sci. 2023 May 31;24(11):9558. [Content Brief]

Calculators
Concentration (start) × Volume (start) = Concentration (final) × Volume (final)


Ganglioside GM1 Related Classifications
HY-N10546 Related Classifications
 Powered by Bioz