



XST-14
Based on 4 publication(s) in Google Scholar
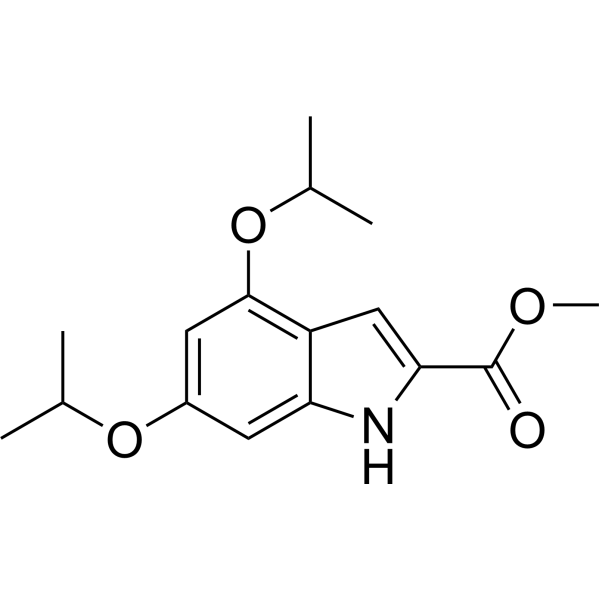
XST-14 is a potent, competitive and highly selective ULK1 inhibitor with an IC50 of 26.6 nM. XST-14 induces autophagy inhibition by reducing the phosphorylation of the ULK1 downstream substrate. XST-14 induces apoptosis in hepatocellular carcinoma (HCC) cells and has antitumor effects.
For research use only. We do not sell to patients.
- Purity : 99.26%
- CAS No.: 2607143-50-8
- Formula: C16H21NO4
- Molecular Weight:291.34
-
Storage:Powder -20°C, 3 years , 4°C, 2 years ; In solvent -80°C, 6 months , -20°C, 1 month

To place orders, for customer services and technical support, please contact: MedChemExpress USA
Tel: 609-228-6898 E-mail: [email protected] [email protected]


-
 Biological Activity
-
Chemical Information
-
Solvent & Solubility
- Protocols
- Purity & Documentation
- References
-
 Help & FAQs


-
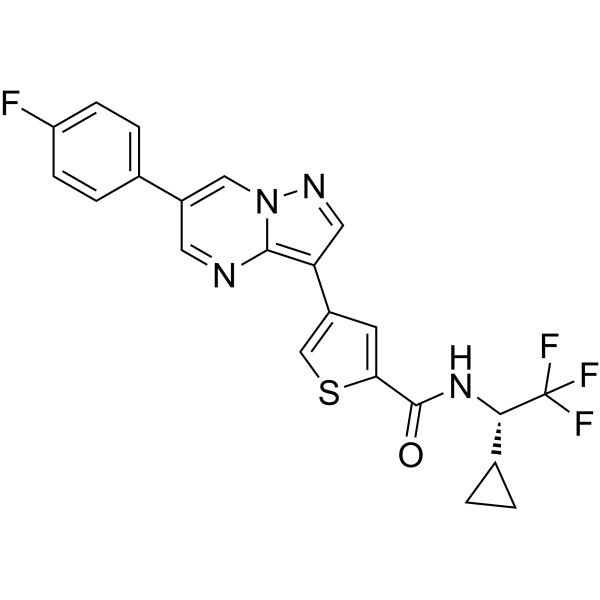
HY-114490
ULK-101ULK1 Inhibitor -
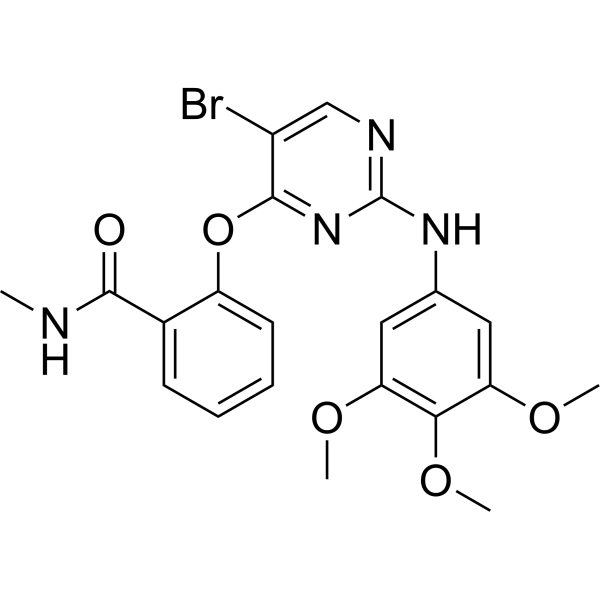
HY-16966
SBI-0206965ULK1/AMPK Inhibitor -
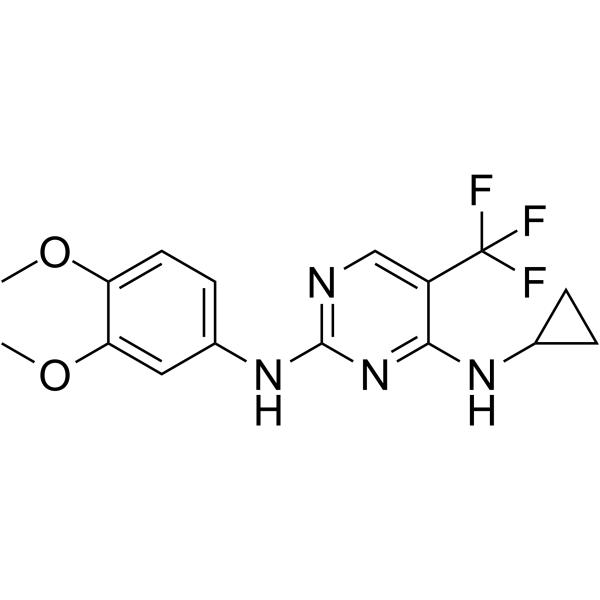
HY-137742
SBP-7455ULK1/ULK2 Autophagy Inhibitor -
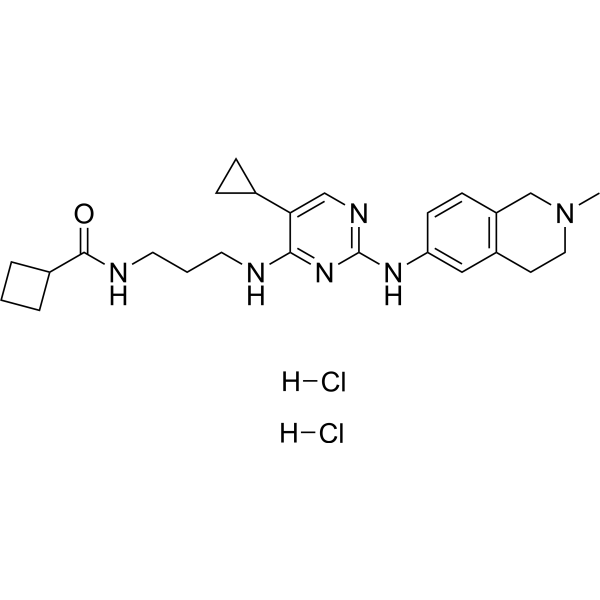
HY-100006A
MRT68921 dihydrochlorideNUAK1/ULK1 Inhibitor -
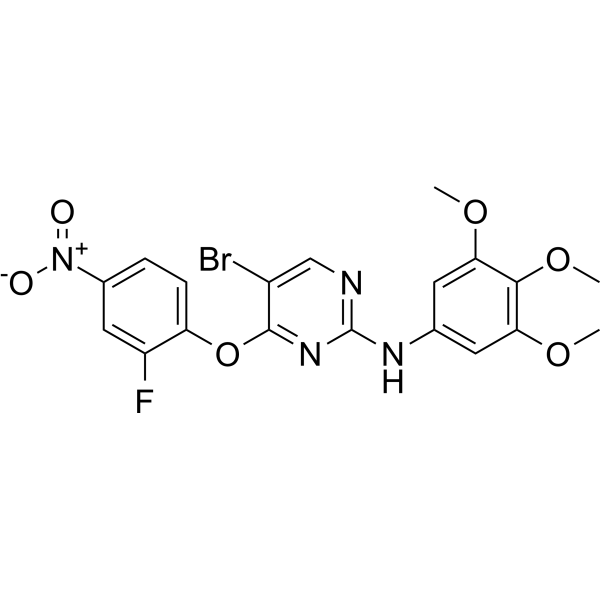
HY-143466
ULK1-IN-2ULK1 Inhibitor -
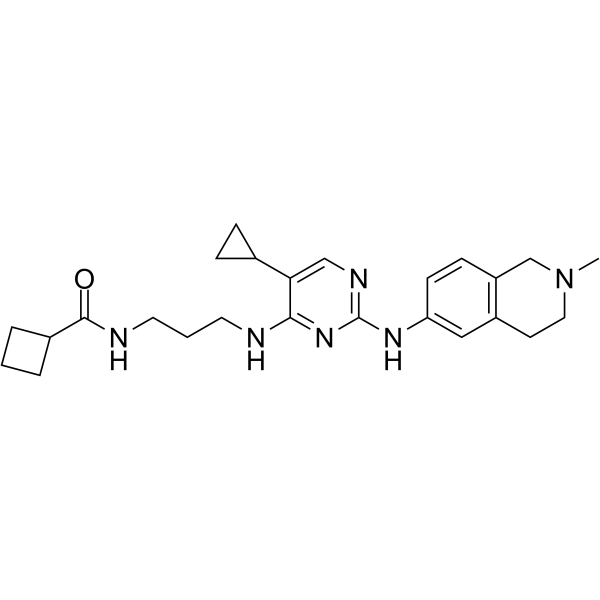
HY-100006
MRT68921NUAK1/ULK1 Inhibitor -
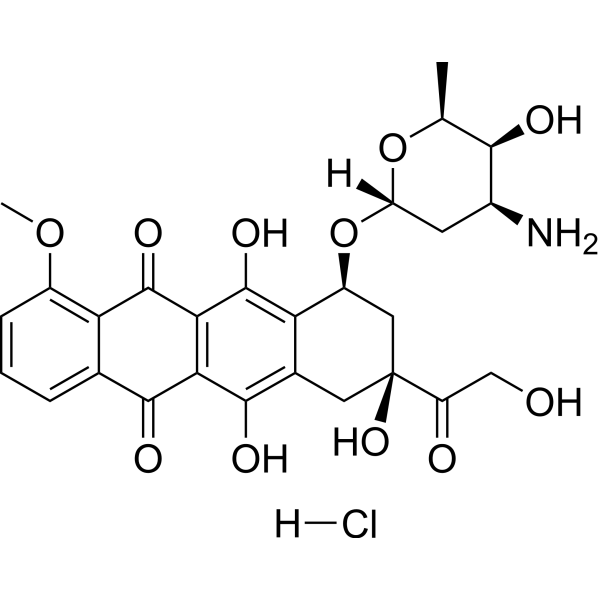
HY-15142
Doxorubicin hydrochlorideTopoisomerase Inhibitor -
HY-N0001
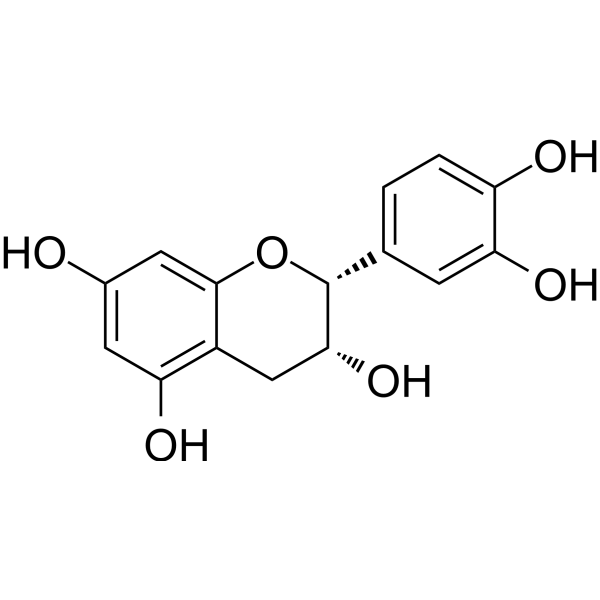
(-)-EpicatechinCOX Inhibitor -
HY-101462
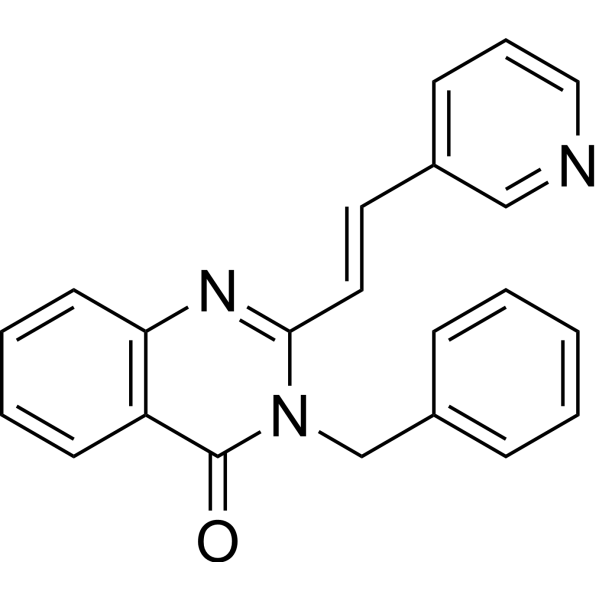
RAD51 Inhibitor B02RAD51 Inhibitor -
HY-N0462
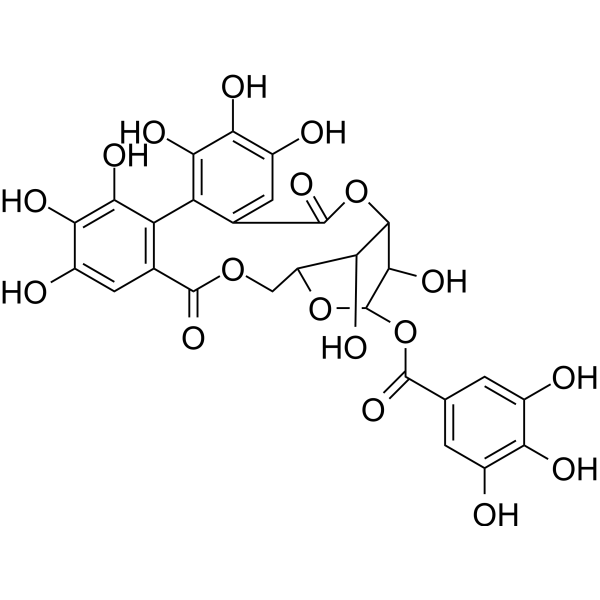
CorilaginAnti-tumor Agent -
HY-12795
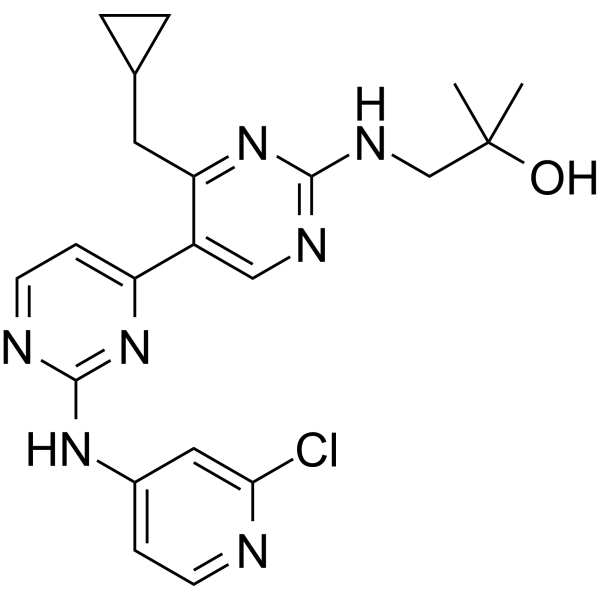
Vps34-IN-1Vps34 Inhibitor -
HY-12342
ML216BLM Helicase Inhibitor
Publications Citing Use of MedChemExpress (MCE) XST-14
More

Biological Activity
Description
IC50 & Target
[1]|
CaMK II |
ULK1 26.6 nM (IC50) |
In Vitro
XST-14 inhibits ULK1 (IC50=13.6 nM), MAP2K1/MEK1 (IC50=721.8 nM), MAPK14/p38 alpha (IC50=283.9 nM), TGFBR2 (IC50=809.3 nM), ACVR1/ALK2 (IC50=183.8 nM), ULK2 (IC50=70.9 nM) and CAMK2A (IC50=66.3 nM) by the 10-point titration results from SelectScreen Kinase Profiling Services[1].
XST-14 (20-80 μM; for 24 h) leads a decrease in cell proliferation activity[1].
XST-14 (5 μM; for 24 h) induces apoptosis in HepG2 and human primary HCC cells[1].
XST-14 (5 μM; for 12 h) strongly inhibits the conversion of LC3-I to LC3-II in CHO cells stably expressing GFP-LC3[1].
XST-14 (5 μM; for 12 h) inhibits the Ser249 phosphorylation of PIK3C3 and Ser15 phosphorylation of BECN1[1].
MedChemExpress (MCE) has not independently confirmed the accuracy of these methods. They are for reference only. Further protocols information, click here.
-
Cell Line:HepG2 cells
-
Concentration:20, 40, 60, 80 μM
-
Incubation Time:24 hours
-
Result:Led a decrease in cell proliferation activity.
-
Cell Line:HepG2 and human primary cells
-
Concentration:5 μM
-
Incubation Time:24 hours
-
Result:Induced apoptosis in HepG2 and human primary HCC cells.
-
Cell Line:CHO, HepG2 cells stably expressing GFP-LC3
-
Concentration:5 μM
-
Incubation Time:12 hours
-
Result:Strongly inhibited the conversion of LC3-I to LC3-II in CHO cells.
Dramatically decreased the number of GFP-LC3 puncta in HepG2 cells.
Decreased autophagosome formation and blocked autophagosome/lysosome fusion in HepG2 cells.
-
Cell Line:HepG2 cells
-
Concentration:5 μM
-
Incubation Time:12 hours
-
Result:Inhibited the Ser249 phosphorylation of PIK3C3 and Ser15 phosphorylation of BECN1.
In Vivo
XST-14 (2 mg/kg for IV; 10 mg/kg for IP) has a T1/2 of 2.31 hours for IV and a T1/2 of 2.69 hours for IP[1].
MedChemExpress (MCE) has not independently confirmed the accuracy of these methods. They are for reference only.
-
Animal Model:Nude mice bearing HepG2 tumor xenografts[1]
-
Dosage:15, 30 mg/kg
-
Administration:IP; daily; for 4 consecutive weeks
-
Result:Displayed anti-HCC efficacies, resulting in decreased tumor weights and suppressed tumor growth of HCC cells in nude mice.
-
Animal Model:Sprague-Dawley rat[1]
-
Dosage:2 mg/kg for IV; 10 mg/kg for IP (Pharmacokinetic Analysis)
-
Administration:IV or IP
-
Result:Had a T1/2 of 2.31 hours, a CL of 26.28 mL/min•kg, and and an AUC of 1269 hr•ng/mL for IV.
Had a T1/2 of 2.69 hours, a Cmax of 2033 ng/mL, and an AUC of 5979 hr•ng/mL for IP.


Chemical Information
-
CAS No. 2607143-50-8
-
Appearance Solid
-
Molecular Weight 291.34
-
Formula C16H21NO4
-
Color White to off-white
-
SMILES
O=C(OC)C1=CC2=C(OC(C)C)C=C(OC(C)C)C=C2N1
-
Shipping
Room temperature in continental US; may vary elsewhere.
-
Storage
Powder -20°C 3 years 4°C 2 years In solvent -80°C 6 months -20°C 1 month


Publications (4)
-
Journal Impact Factor
-
Most Recent
-
Nat Aging
2026 May 14. PMID: 42135576 -
Cancer Res
Inhibiting Fatty Acid Oxidation Reverses Autophagy-Mediated Acquired Chemotherapy Resistance in Pancreatic Ductal Adenocarcinoma. [Abstract]2026 Jul 2;86(13):3194-3212. PMID: 42008004 -
Toxins
The Mycotoxin De-Epoxy-Deoxynivalenol (DOM-1) Increases Endoplasmic Reticulum Stress in Ovarian Theca Cells. [Abstract]2023 Mar 17;15(3):228. PMID: 36977119 -


Solvent & Solubility
In Vitro:
DMSO : 250 mg/mL (858.10 mM; Need ultrasonic; Hygroscopic DMSO has a significant impact on the solubility of product, please use newly opened DMSO)
Please refer to the solubility information to select the appropriate solvent. Once prepared, please aliquot and store the solution to prevent product inactivation from repeated freeze-thaw cycles.
Storage method and period of stock solution: -80°C, 6 months; -20°C, 1 month. When stored at -80°C, please use it within 6 months. When stored at -20°C, please use it within 1 month.
Please refer to the solubility information to select the appropriate solvent. Once prepared, please aliquot and store the solution to prevent product inactivation from repeated freeze-thaw cycles.
Storage method and period of stock solution: -80°C, 6 months; -20°C, 1 month. When stored at -80°C, please use it within 6 months. When stored at -20°C, please use it within 1 month.
Concentration (start) × Volume (start) = Concentration (final) × Volume (final)
In Vivo:
Select the appropriate dissolution method based on your experimental animal and administration route.
- For the following dissolution methods, please ensure to first prepare a clear stock solution using an In Vitro approach and then sequentially add co-solvents:
- To ensure reliable experimental results, the clarified stock solution can be appropriately stored based on storage conditions. As for the working solution for In Vivo experiments, it is recommended to prepare freshly and use it on the same day.
- The percentages shown for the solvents indicate their volumetric ratio in the final prepared solution. If precipitation or phase separation occurs during preparation, heat and/or sonication can be used to aid dissolution.
Add each solvent one by one: 10% DMSO 90% (20% SBE-β-CD in Saline)
Solubility: ≥ 2.08 mg/mL (7.14 mM); Clear solution
This protocol yields a clear solution of ≥ 2.08 mg/mL (saturation unknown).
Taking 1 mL working solution as an example, add 100 μL DMSO stock solution (20.8 mg/mL) to 900 μL 20% SBE-β-CD in Saline, and mix evenly.
Preparation of 20% SBE-β-CD in Saline (4°C, storage for one week): 2 g SBE-β-CD powder is dissolved in 10 mL Saline, completely dissolve until clear.
In Vivo Dissolution Calculator
Please enter the basic information of animal experiments:
-
-
-
-
Recommended: Prepare an additional quantity of animals to account for potential losses during experiments.
Please enter your animal formula composition:
-
%DMSO +
Recommended: Keep the proportion of DMSO in working solution below 2% if your animal is weak.
-
%+
-
+%Tween-80 + +
-
%Saline +
The co-solvents required include: DMSO, . All of co-solvents are available by MedChemExpress (MCE). , Tween 80. All of co-solvents are available by MedChemExpress (MCE).
Working solution concentration: 0.22 mg/mL
Method for preparing stock solution: mg drug dissolved in μL DMSO. Stock solution concentration: mg/mL.
1. Take μL DMSO stock solution;
2. Add μL .
μL , mix evenly;
3. Then add μL Tween 80, mix evenly;
4. Then add μL
Please ensure that the stock solution in the first step is dissolved to a clear state, and add co-solvents in sequence. You can use ultrasonic heating (ultrasonic cleaner, recommended frequency 20-40 kHz), vortexing, etc. to assist dissolution.

Protocols
-
Kinase activity and phosphorylation assays
Kinase activity assays measure the ability of kinases to transfer phosphate groups from ATP to specific substrates, while phosphorylation assays detect the presence and levels of phosphorylated proteins. Common methods include radiolabeled ATP incorporation (e. g. ,), ADP release detection via bioluminescence (e. g. ,[3]), enzyme-linked immunosorbent assays (ELISA) for phospho-specific epitopes (e. g. ,[6]), and microtiter-based formats for high-throughput screening (e. g. ,[8]). The ADP-Glo assay quantifies kinase activity by measuring ADP produced during phosphorylation using a luciferase-based system. Radiometric assays involve autoradiography or scintillation counting after incorporation of 32P-labeled ATP into substrate proteins. ELISA-based approaches rely on phospho-specific antibodies to detect activated kinases in cell lysates or purified samples.
-
Western Blot
Western blotting (WB) is a commonly used experimental method in molecular biology, biochemistry, and immunogenetics for identifying and quantifying target proteins. It combines gel electrophoresis with immunoassay, enabling researchers to analyze protein expression, post-translational modifications, and molecular weight.
-
Apoptosis
Apoptosis, also called programmed cell death, is generally characterized by distinct morphological characteristics.
-
TUNEL staining for apoptotic DNA fragmentation
TUNEL staining detects DNA strand breaks by using terminal deoxynucleotidyl transferase to add labeled nucleotides to exposed 3′-OH DNA termini, generating either microscopic staining in fixed cells or tissue sections, or fluorescence/cytometric signal in cell suspensions. TUNEL positivity reflects DNA fragmentation but should not be interpreted alone as definitive apoptosis, because TUNEL can also label necrotic, autolytic, mechanically damaged, or DNA-repair-associated DNA breaks.
-
Cell Cytotoxicity Assay
Cytotoxicity assays are usually based on the assessment of cell membrane damage, which can also be indirectly detected by measuring cell viability. Detection methods include MTT assay, CKK-8 assay, LDH assay and ATP assay, etc.
-
Annexin V plus membrane-impermeant dye apoptosis staining
Annexin V-based apoptosis assays rely on the detection of phosphatidylserine (PS) externalization from the inner leaflet of the plasma membrane to the outer leaflet, an early biochemical hallmark of apoptosis. Fluorescently labeled Annexin V binds PS in a calcium-dependent manner, enabling identification of early apoptotic cells by flow cytometry or fluorescence microscopy. When combined with a membrane-impermeant DNA-binding dye (e. g. , propidium iodide), this approach allows discrimination between viable (Annexin V−/dye−), early apoptotic (Annexin V+/dye−), and late apoptotic or necrotic (Annexin V+/dye+) cell populations by assessing membrane integrity and PS exposure.
-
Autophagy
Autophagy is a process in which eukaryotic cells use lysosomes to degrade their own cytoplasmic proteins and damaged organelles under the regulation of autophagy related gene (Atg). Microtubule-associated proteins light chain 3 (LC3) is recognized as autophagy marker, which transfers from cytoplasmic LC3 (LC3-I) to membrane type (LC3-II). LC3-II/I ratio could be detected by Western Blot and fluorescence microscopy.
-
Apoptosis Solutions
Apoptosis is a regulated, generally non-lytic cell-death pathway that removes unwanted, damaged, infected, or abnormal cells through coordinated morphological changes, caspase activation, DNA fragmentation, and membrane remodeling. The intrinsic apoptosis pathway is controlled mainly by mitochondrial outer membrane permeabilization, BCL-2 family proteins, cytochrome c release, apoptosome formation, caspase-9 activation, and downstream executioner caspase-3/7 activation. The extrinsic apoptosis pathway is initiated by death receptors such as Fas, TNFR, and TRAIL receptors, which recruit adaptor proteins and activate caspase-8 before engaging executioner caspases or mitochondrial amplification through BID cleavage. Apoptosis is linked to many phenotypes, including cancer cell killing, tissue homeostasis, immune regulation, neurodegeneration, infection response, and treatment-induced cytotoxicity; unresolved questions include how apoptosis interacts with necroptosis, pyroptosis, ferroptos
-
Lysosome and acidic-vesicle live-cell staining
Lysosome and acidic-vesicle live-cell staining detects acidic intracellular compartments by using membrane-permeant acidotropic probes that accumulate in low-pH vesicles, including lysosomes, late endosomes, autolysosomes, and acidic phagosomes. LysoTracker staining is commonly used as an intensity-based readout of acidic lysosomal compartment abundance or enlargement, while acridine orange produces green fluorescence in less concentrated compartments and red fluorescence after concentration-dependent accumulation in acidic vesicular organelles. Loss or reduction of acridine-orange red signal can be used as a readout of lysosomal membrane permeabilization or reduced acidic-vesicle integrity. This protocol is designed for live cultured cells and can be adapted for fluorescence microscopy, high-content imaging, plate-reader readout, or flow cytometry when the selected literature supports the readout. Because these dyes report acidotropic accumulation rather than lysosome identity alone,
-
Protocol for Kinase activity and phosphorylation assays
Kinase activity assays measure transfer of phosphate from ATP to a protein or peptide substrate, generating phosphorylated substrate, ADP, or incorporated radiolabeled phosphate as the readout; phosphorylation assays measure site-specific phosphorylation in cells or tissues as a proxy for kinase-pathway activation, inhibition, or substrate regulation. Phosphorylation can be detected by phospho-specific Western blot, immunoprecipitation kinase assay, phospho-immunofluorescence, phospho-flow cytometry, luminescent ADP detection, radiolabeled ATP incorporation, or reporter-based pathway assays, and these readouts can be applied to cancer cells, primary neurons, mouse tumors, organoids, inflammatory macrophages, ferroptosis studies, and mitophagy studies when the kinase target is biologically relevant.
-
Liver Cancer Modeling
Liver cancer can be classified into primary liver cancer and secondary liver cancer. Secondary liver cancer is the metastatic liver cancer. Primary liver cancer includes hepatocellular carcinoma (HCC), intrahepatic cholangiocarcinoma (ICC) and fibrolamellar HCC, of which HCC is the most common form, accounting for approximately 90% of primary liver cancers[1]. HCC mouse models include chemical agent-induced models, transplanted tumor models, and genetic engineered models.
-
Macroautophagy Solutions
Macroautophagy is a conserved lysosome-dependent degradation pathway in which cytoplasmic material is sequestered into double-membrane autophagosomes and delivered to lysosomes for degradation and recycling. The pathway supports cellular homeostasis during nutrient limitation, organelle stress, protein-aggregate accumulation, infection, differentiation, and tissue remodeling by coupling cargo sequestration, autophagosome maturation, lysosomal fusion, and degradation of cargo-derived macromolecules. The core molecular sequence includes initiation by nutrient- and stress-regulated autophagy machinery, autophagosome nucleation, LC3/ATG8-family conjugation to autophagosomal membranes, cargo selection through receptors such as SQSTM1/p62, autophagosome-lysosome fusion, and lysosomal degradation. LC3 was identified as a mammalian homolog of yeast Atg8 that localizes to autophagosomal membranes after processing, and p62/SQSTM1 was shown to connect ubiquitinated cargo with autophagic degradati


Purity & Documentation
-
Data Sheet (279 KB)
-
SDS (251 KB)
- English - EN (251 KB)
- Français - FR (251 KB)
- Deutsch - DE (251 KB)
- Norwegian - NO (251 KB)
- Español - ES (251 KB)
- Swedish - SV (251 KB)
- Italian - IT (251 KB)
- Korean - KR (251 KB)
- Portuguese - PT (251 KB)
-
Handling Instructions (2659 KB)
References


Complete Stock Solution Preparation Table
Please refer to the solubility information to select the appropriate solvent. Once prepared, please aliquot and store the solution to prevent product inactivation from repeated freeze-thaw cycles.
Storage method and period of stock solution: -80°C, 6 months; -20°C, 1 month. When stored at -80°C, please use it within 6 months. When stored at -20°C, please use it within 1 month.
| Optional Solvent | Concentration Solvent Mass | 1 mg | 5 mg | 10 mg | 25 mg |
|---|---|---|---|---|---|
| DMSO | 1 mM | 3.4324 mL | 17.1621 mL | 34.3242 mL | 85.8104 mL |
| 5 mM | 0.6865 mL | 3.4324 mL | 6.8648 mL | 17.1621 mL | |
| 10 mM | 0.3432 mL | 1.7162 mL | 3.4324 mL | 8.5810 mL | |
| 15 mM | 0.2288 mL | 1.1441 mL | 2.2883 mL | 5.7207 mL | |
| 20 mM | 0.1716 mL | 0.8581 mL | 1.7162 mL | 4.2905 mL | |
| 25 mM | 0.1373 mL | 0.6865 mL | 1.3730 mL | 3.4324 mL | |
| 30 mM | 0.1144 mL | 0.5721 mL | 1.1441 mL | 2.8603 mL | |
| 40 mM | 0.0858 mL | 0.4291 mL | 0.8581 mL | 2.1453 mL | |
| 50 mM | 0.0686 mL | 0.3432 mL | 0.6865 mL | 1.7162 mL | |
| 60 mM | 0.0572 mL | 0.2860 mL | 0.5721 mL | 1.4302 mL | |
| 80 mM | 0.0429 mL | 0.2145 mL | 0.4291 mL | 1.0726 mL | |
| 100 mM | 0.0343 mL | 0.1716 mL | 0.3432 mL | 0.8581 mL |


XST-14 Related Classifications
HY-137506 Related Classifications
 Powered by Bioz