
QA-68
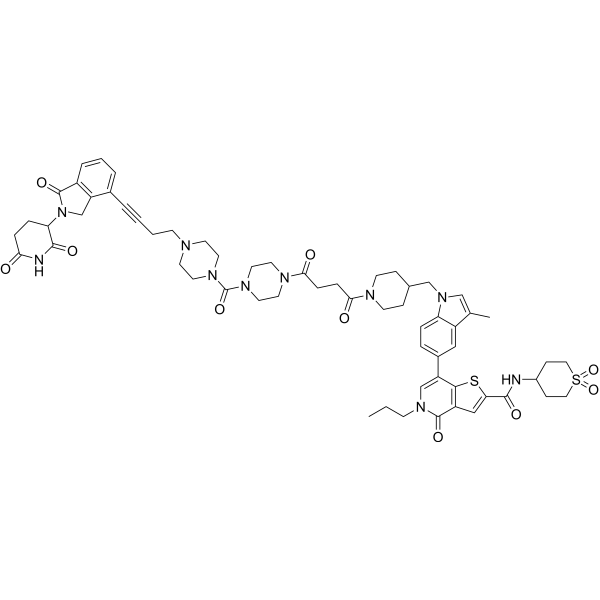
QA-68 (QA-68-ZU81) is an effective PROTAC-class BRD9 degrader. QA-68 can inhibit cell cycle progression and cell colony formation. QA-68 has antiproliferative activity against acute myeloid leukemia (AML) cell lines
(Pink: BRD9 ligand (HY-131318); Blue: Cereblon ligand (HY-131318); Black: linker (HY-170315)).
Nur für Forschungszwecke. Wir verkaufen nicht an Patienten.
- Formel: C61H72N10O10S2
- Molecular Weight:1169.42
-
Speicherung:
Please store the product under the recommended conditions in the Certificate of Analysis.
Alle PROTACs Isoform-spezifische Produkte anzeigen
More
Biologische Aktivität
Beschreibung
IC50 & Target
[1]|
BRD9 |
In Vitro
QA-68 (0-1000 nM; 24 h) exhibits antiproliferative activity against MV4-11, SKM-1 and Kasumi-1-luc+ cells, and inhibits BRD9 protein expression in MV4-11, SKM-1, SEM, NALM6, RS4;11[1].
QA-68 (0.1-1000 nM; 4 days) effectively inhibits SKM-1 cell cycle progression[1].
QA-68 (1000 nM; 12 days) inhibits colony formation of additional primary AML bone marrow and PBMC cells[1].
MedChemExpress (MCE) has not independently confirmed the accuracy of these methods. They are for reference only. Further protocols information, click here.
-
Cell Line:MV4-11, SKM-1 and Kasumi-1-luc+ cells
-
Concentration:0-1000 nM
-
Incubation Time:24 h
-
Result:Exhibited concentration-dependent inhibition of proliferation of MV4-11, SKM-1 and Kasumi-1-luc+ cells with IC50s of 1-10 nM in MV4;11 and SKM-1, and IC50 of 10-100 nM in Kasumi-1-luc +, respectively.
-
Cell Line:SKM-1cells
-
Concentration:0.1, 1, 10, 100 and 1000 nM
-
Incubation Time:6 days
-
Result:Effectively inhibited SKM-1 cell cycle progression.
-
Cell Line:MV4-11, SKM-1, SEM, NALM6, RS4;11
-
Concentration:0, 1, 10, 100 and 1000 nM
-
Incubation Time:24 h
-
Result:Inhibited BRD9 protein in all tested cell lines.
Chemical Information
-
Molecular Weight 1169.42
-
Formel C61H72N10O10S2
-
SMILES
CCCN1C=C(C2=C(C1=O)C=C(C(NC3CCS(CC3)(=O)=O)=O)S2)C4=CC=C(C5=C4)N(C=C5C)CC6CCN(CC6)C(CCC(N7CCN(CC7)C(N8CCN(CC8)CCC#CC9=CC=CC%10=C9CN(C%10=O)C%11CCC(NC%11=O)=O)=O)=O)=O
-
Synonyms
QA-68-ZU81
-
Versand
Room temperature in continental US; may vary elsewhere.
-
Speicherung
Please store the product under the recommended conditions in the Certificate of Analysis.
Protokoll
-
Flow cytometric DNA-content cell-cycle staining
Flow cytometric DNA-content cell-cycle staining measures the fluorescence intensity of DNA-bound fluorochromes in single cells or nuclei to estimate DNA content distributions, allowing assignment of populations to G0/G1, S, and G2/M phases by DNA histogram deconvolution. Propidium iodide (PI) intercalates into DNA, and PI fluorescence is proportional to cellular DNA content when staining is performed under conditions that make DNA accessible and minimize non-DNA signal. Cells with G2/M DNA content are expected to show approximately twice the fluorescence intensity of G0/G1 cells, while S-phase cells occupy intermediate fluorescence values. PI-based DNA-content analysis can also detect cells with fractional DNA content, often reported as sub-G1, when DNA fragmentation and extraction during staining reduce retained DNA signal in apoptotic cells. DAPI is an alternative DNA fluorochrome for univariate DNA-content analysis, while bivariate approaches combining DNA content with proliferation
-
BrdU Incorporation Assay
Bromodeoxyuridine (BrdU) incorporation assay is based on the principle that BrdU, a thymidine analog, is incorporated into newly synthesized DNA during the S phase of the cell cycle, thereby serving as a marker of DNA replication and cellular proliferation. Incorporated BrdU can be detected using anti-BrdU antibodies following DNA denaturation, enabling visualization or quantification of proliferating cells through immunochemical detection methods such as immunofluorescence or immunohistochemistry.
-
Protocol for Cell Cycle
Cell-cycle analysis by flow cytometry measures DNA content in single cells to estimate the fraction of cells in G0/G1, S, and G2/M phases. Propidium iodide intercalates into DNA, and after RNA removal with RNase, fluorescence intensity reflects cellular DNA content: 2N cells are assigned to G0/G1, cells between 2N and 4N to S phase, and 4N cells to G2/M. DNA-content analysis alone cannot reliably separate G0 from G1 or G2 from M. Ki-67 can distinguish quiescent G0 cells from cycling cells, EdU or BrdU incorporation marks active DNA synthesis in S phase, and phospho-histone H3 staining identifies mitotic cells within the 4N population.
-
Soft Agar Colony Formation Assay
Soft agar colony formation assay measures anchorage-independent growth, in which transformed or tumorigenic cells proliferate as colonies in a semisolid agar matrix while many non-transformed adherent cells fail to proliferate without attachment; classic studies showed that growth in semisolid medium correlates with tumorigenicity in nude mice, and later protocol papers describe the method as a stringent in vitro assay for malignant transformation. The readout is the number, size, morphology, or signal intensity of colonies formed within agar after incubation; published formats include manual colony counting after staining, 96-well or 384-well quantitative formats, DNA-binding dye detection, MTT/tetrazolium-based detection, digital image analysis, and PCR-based marker detection from soft agar cultures.
-
Colony Formation (Clonogenic) Assay
The clonogenic (colony formation) assay measures the ability of a single cell to retain reproductive viability and form a macroscopic colony, typically defined as a cluster derived from one progenitor cell after a defined growth period. This assay is widely used to evaluate cell survival after exposure to ionizing radiation or cytotoxic treatments and is considered a standard method in radiation biology for generating dose-response relationships of reproductive cell death. Colony formation reflects long-term proliferative capacity rather than short-term metabolic activity, and survival is quantified by comparing treated versus untreated conditions based on colony number and derived survival fractions.
-
Cell Viability Determination by MTT Colorimetric Assay
The following protocol uses the MTT colorimetric assay as a classic literature-established method for assessing cell viability/metabolic activity in cultured mammalian cells. MTT[3-(4,5-dimethylthiazol-2-yl)-2,5-diphenyltetrazolium bromide] is reduced by metabolically active cells to a colored formazan product; the amount of formazan is quantified spectrophotometrically and provides an indirect measure of metabolically active viable cells. Importantly, MTT reduction reflects cellular oxidoreductase/metabolic activity rather than an absolute direct count of living cells, so changes in cellular metabolism can alter the signal independently of cell number.
Reinheit & Dokumentation
Verweise
Calculators
Konzentration (Stammlösung) × Volumen (Stammlösung) = Konzentration (Ziellösung) × Volumen (Ziellösung)

