



MMP-2 Inhibitor II

Based on 1 Customer Validation
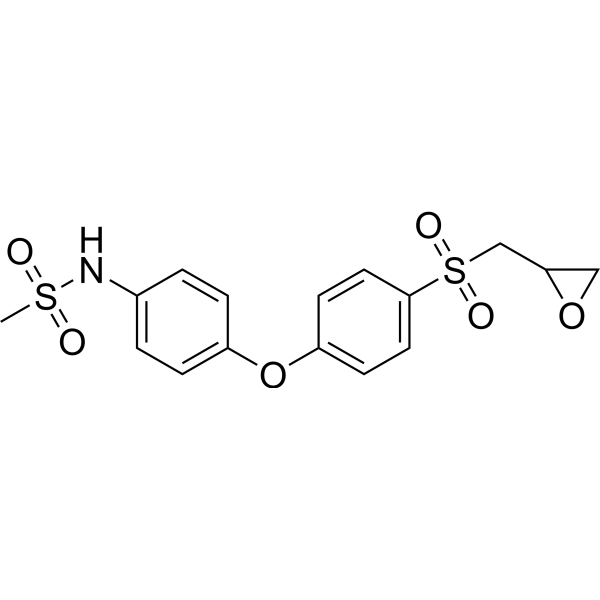
MMP-2 Inhibitor II (compound 2) is a selective MMP-2 inhibitor. The Kinetic parameters for MMP inhibition are 2.4 μM (MMP-2), 45 μM (MMP-1), and 379 μM (MMP-7), respectively.
For research use only. We do not sell to patients.
- Purity : 98.0%
- CAS No.: 869577-51-5
- Formula: C16H17NO6S2
- Molecular Weight:383.44
-
Storage:Powder -20°C, 3 years ; In solvent -80°C, 6 months , -20°C, 1 month

To place orders, for customer services and technical support, please contact: MedChemExpress USA
Tel: 609-228-6898 E-mail: [email protected] [email protected]


-
 Biological Activity
-
Chemical Information
- Protocols
- Purity & Documentation
- References
-
 Help & FAQs


-
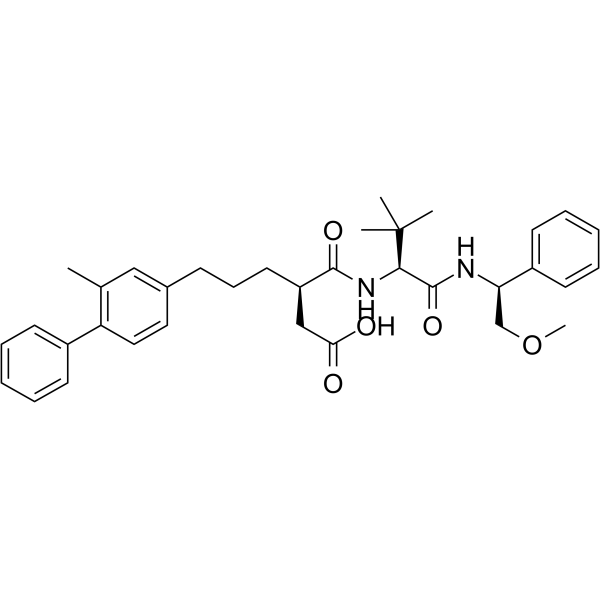
HY-107639
UK-370106MMP-3/MMP-12 Inhiibitor -
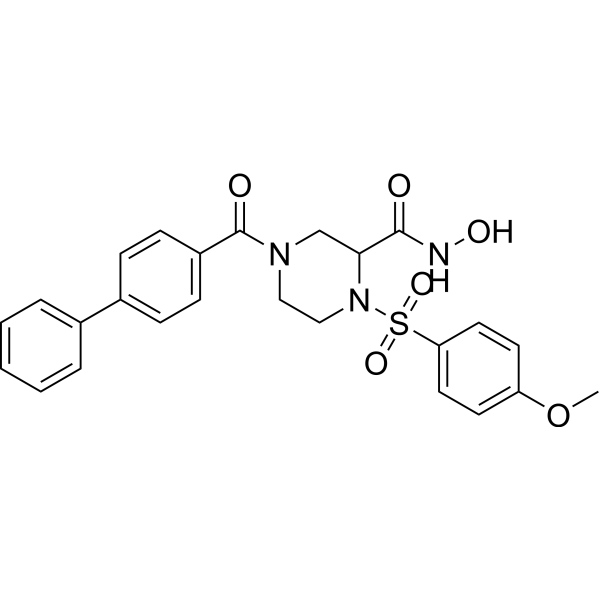
HY-128026
MMP-9/MMP-13 Inhibitor IMMP-9/MMP-13 Inhibitor -
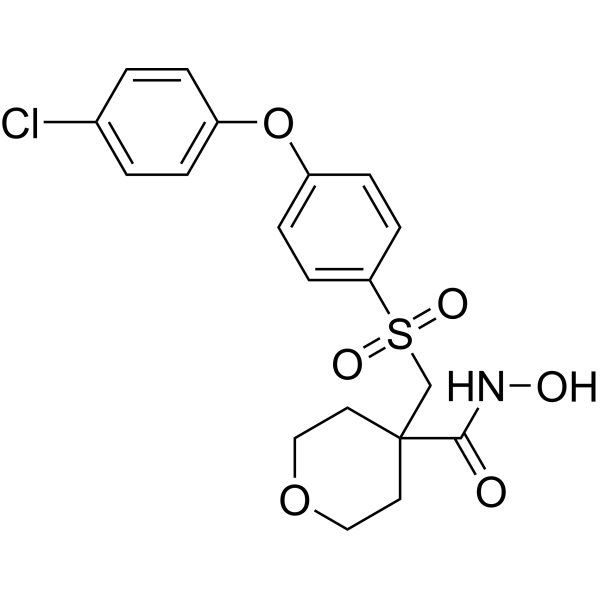
HY-10398
CTS-1027MMP Inhibitor -
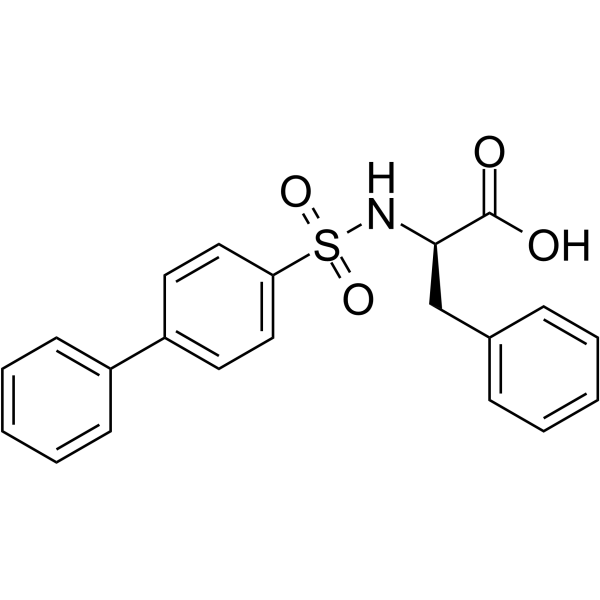
HY-116399
MMP-2/MMP-9-IN-1MMP-2/MMP-9 Inhibitor -
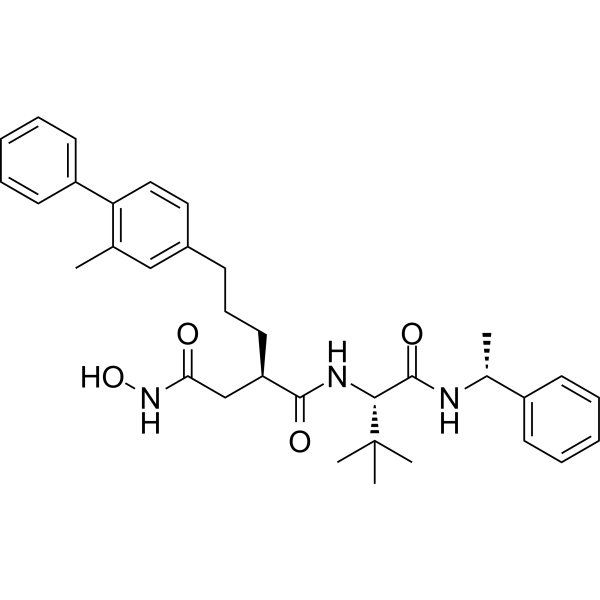
HY-107394
UK 356618MMP-3 Inhibitor -
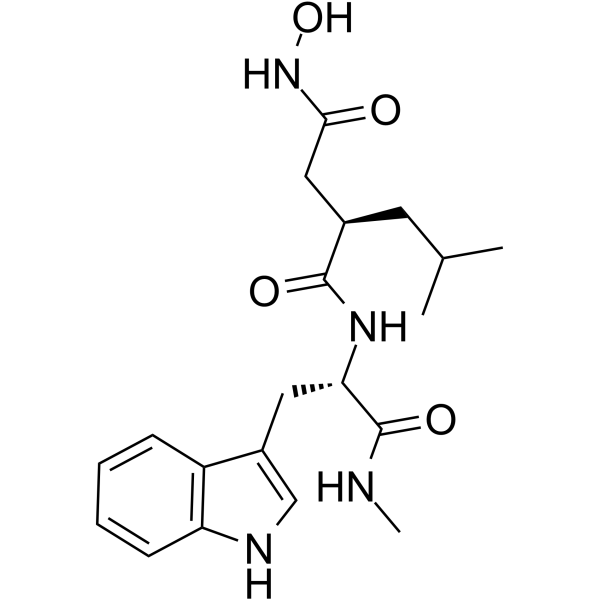
HY-15768
IlomastatMMP Inhibitor -
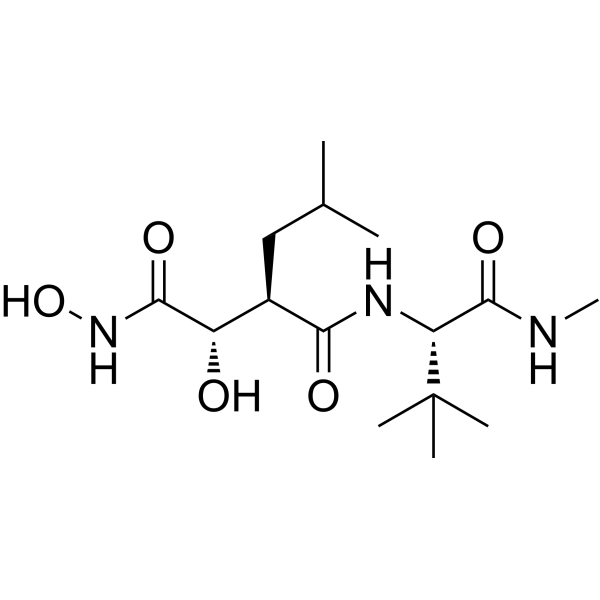
HY-12169
MarimastatMMP Inhibitor -
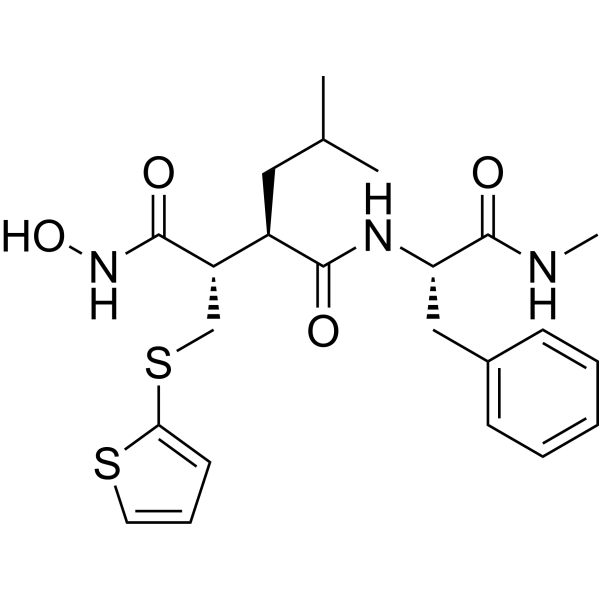
HY-13564
BatimastatMMP Inhibitor -
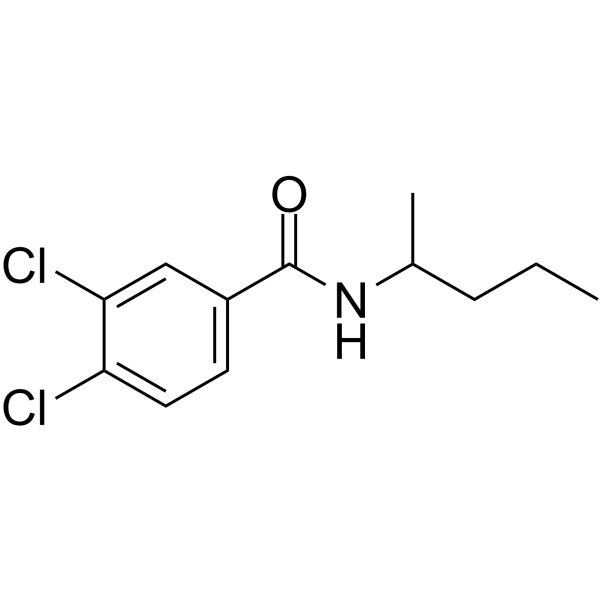
HY-15827
NSC 405020MMP14 Inhibitor -
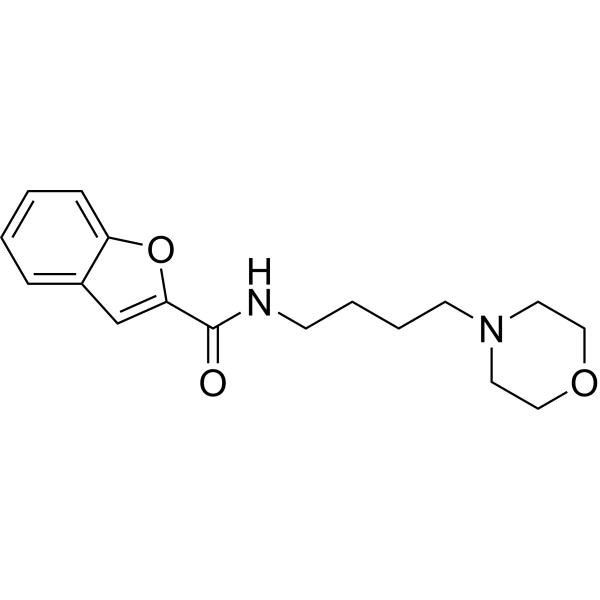
HY-100359
CL-82198MMP-13 Inhibitor -
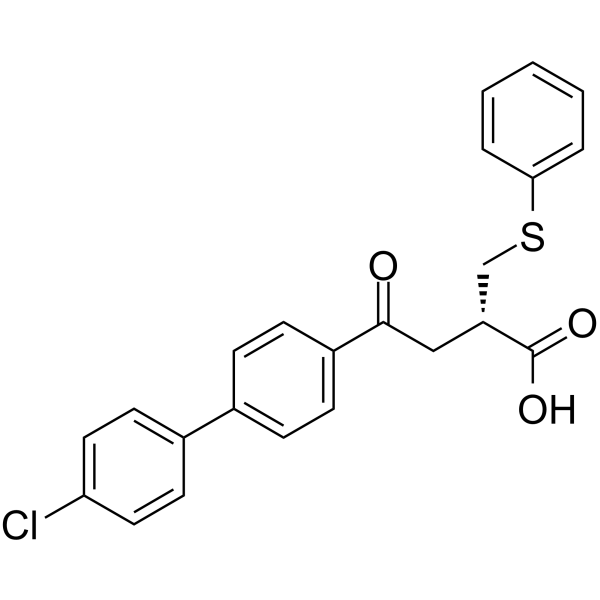
HY-12168
TanomastatMMPs Inhibitor -
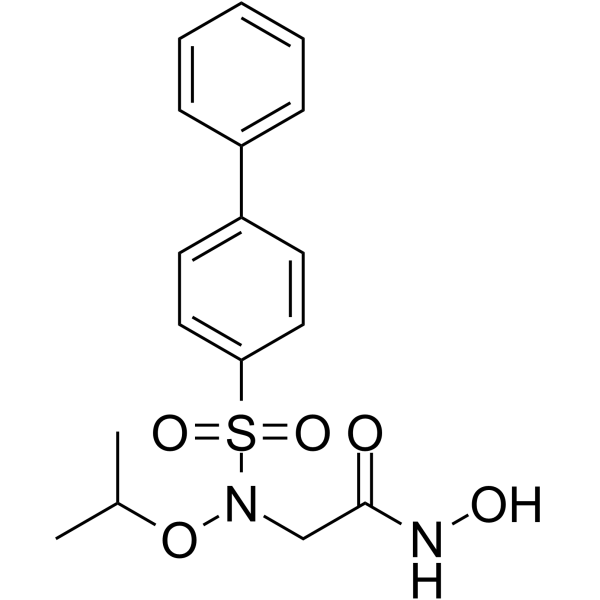
HY-103444
ARP-100MMP-2 Inhibitor


Biological Activity
Description
IC50 & Target
[1]|
MMP-1 45 μM (Ki) |
MMP-2 2.4 μM (Ki) |
MMP-7 379 μM (Ki) |
In Vitro
Matrix metalloproteinases (MMPs) are zinc-dependent endopeptidases that play important roles in physiological and pathological conditions[1].
MedChemExpress (MCE) has not independently confirmed the accuracy of these methods. They are for reference only. Further protocols information, click here.


Chemical Information
-
CAS No. 869577-51-5
-
Appearance Solid
-
Molecular Weight 383.44
-
Formula C16H17NO6S2
-
Color White to off-white
-
SMILES
CS(=O)(NC1=CC=C(OC2=CC=C(S(=O)(CC3OC3)=O)C=C2)C=C1)=O
-
Shipping
Room temperature in continental US; may vary elsewhere.
-
Storage
Powder -20°C 3 years In solvent -80°C 6 months -20°C 1 month

Protocols
-
Mitochondrial membrane-potential fluorescent assay
Mitochondrial membrane potential fluorescent assays estimate ΔΨm in living cells using lipophilic cationic dyes such as TMRM, TMRE, rhodamine 123, and JC-1, which accumulate in mitochondria according to membrane polarization; loss of signal after FCCP or CCCP treatment is interpreted as mitochondrial depolarization. TMRM/TMRE and rhodamine 123 are commonly used for semi-quantitative live-cell microscopy or flow cytometry, while JC-1 can report a shift from red aggregate fluorescence to green monomer fluorescence during depolarization; interpretation requires controls because dye concentration, quenching mode, cell type, dye efflux, and mitochondrial mass can affect fluorescence independently of ΔΨm.
-
Mitochondrial membrane-potential and mitochondrial mass staining
Mitochondrial membrane potential staining measures the electrochemical polarization across the mitochondrial inner membrane in live cells using lipophilic cationic fluorescent probes; early rhodamine-based work showed that selective mitochondrial dye accumulation is lost when the mitochondrial transmembrane potential is dissipated. JC-1 reports mitochondrial polarization by shifting from green monomer fluorescence to red J-aggregate fluorescence as dye concentration increases within energized mitochondria; therefore, the red/green fluorescence ratio is used as a relative readout of mitochondrial membrane potential. TMRE or TMRM staining provides a single-channel relative readout because these cationic rhodamine esters accumulate in polarized mitochondria, and lower fluorescence indicates reduced mitochondrial polarization when acquisition and dye-loading conditions are controlled. Mitochondrial mass staining is commonly performed with MitoTracker Green FM or related MitoTracker dyes as


Purity & Documentation
-
Data Sheet (267 KB)
-
SDS (251 KB)
- English - EN (251 KB)
- Français - FR (251 KB)
- Deutsch - DE (251 KB)
- Norwegian - NO (251 KB)
- Español - ES (251 KB)
- Swedish - SV (251 KB)
- Italian - IT (251 KB)
- Korean - KR (251 KB)
- Portuguese - PT (251 KB)
-
Handling Instructions (2659 KB)
References

Calculators
Concentration (start) × Volume (start) = Concentration (final) × Volume (final)


MMP-2 Inhibitor II Related Classifications
HY-130076 Related Classifications
 Powered by Bioz