



Alisol B
Based on 1 publication(s) in Google Scholar
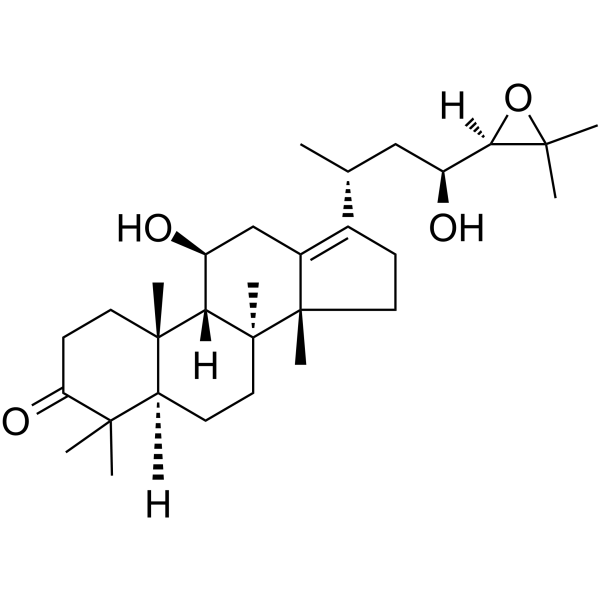
Alisol B is a triterpene with diverse biological activities. Alisol B binds human soluble epoxide hydrolase (sEH) with a Ki of 5.97 μM and reduces sEH activity. Alisol B inhibits RANKL-induced JNK phosphorylation, NFATc1 and c-Fos expression, osteoclast formation, mature osteoclast pit-forming and actin ring activity, and SERCA pump activity. Alisol B induces calcium mobilization, CaMKK-AMPK-mTOR pathway activation, autophagic flux, autophagosome formation, G1 phase cell cycle arrest, endoplasmic reticulum stress, unfolded protein responses, and cancer cell apoptosis. Alisol B can be used for the research of hypercalcemia, osteoporosis, rheumatoid arthritis, periodontitis, acute kidney injury, and breast cancer.
For research use only. We do not sell to patients.
- Purity : 99.57%
- CAS No.: 18649-93-9
- Formula: C30H48O4
- Molecular Weight:472.70
-
Storage:
4°C, protect from light
* In solvent : -80°C, 6 months; -20°C, 1 month (protect from light)

To place orders, for customer services and technical support, please contact: MedChemExpress USA
Tel: 609-228-6898 E-mail: [email protected] [email protected]


-
 Biological Activity
-
Chemical Information
-
Solvent & Solubility
- Protocols
- Purity & Documentation
- References
-
 Help & FAQs




Publications Citing Use of MedChemExpress (MCE) Alisol B
More

Biological Activity
Description
Cellular Effect
|
Cell Line

|
Type | Value | Description | References |
|---|---|---|---|---|
| HepG2 | EC50 |
8.8 μM
Compound: 25
|
Transactivation of FXR (unknown origin) transfected in HepG2 cells co-expressing pBSEP/pGL4.74 incubated for 24 hrs by luciferase reporter gene assay
Transactivation of FXR (unknown origin) transfected in HepG2 cells co-expressing pBSEP/pGL4.74 incubated for 24 hrs by luciferase reporter gene assay
|
[PMID: 31494470] |
In Vitro
Alisol B (0.5-5 μM; 6 days) dose-dependently inhibits 1α,25(OH)2D3-induced osteoclast formation in co-cultures of mouse bone marrow cells and primary calvarial osteoblasts, with complete inhibition at 5 μM[1].
Alisol B (0.5-5 μM; 10 min) inhibits RANKL-induced JNK phosphorylation in mouse BMMs, and suppresses RANKL-induced activation of NFATc1 and expression of c-Fos, key transcription factors for osteoclastogenesis[1].
Alisol B (1, 5 μM; 48 h) suppresses the pit-forming activity and disrupts actin ring formation of mature mouse osteoclasts on dentin slices[1].
Alisol B (20 μM; 1 h pre-incubation, 24 h co-incubation with Cisplatin (HY-17394)) attenuates cisplatin-induced apoptosis, inflammation, and oxidative stress in HK-2 renal proximal tubule cells via a GSK3β-dependent pathway[2].
Alisol B potently inhibits SERCA1A activity in rabbit skeletal muscle sarcoplasmic reticulum membranes with an IC50 of 27 μM, and inhibits SERCA2B activity in porcine brain microsomes with an IC50 of 53 μM[3].
Alisol B (30 μM; 16-24 h) induces autophagosome formation in MCF-7 cells, as shown by increased GFP-LC3 puncta formation[3].
Alisol B (48 h) induces cytotoxicity across a panel of cancer cell lines with IC50 values ranging from 20.6 μmol/L (HepG2) to 48.7 μM (MDA-MB-231) at 48 h post-treatment[3].
Alisol B (30 μM; 8-48 h) induces time-dependent G1 phase cell cycle arrest in MCF-7 cells, with 93.1% of cells in G1 phase after 48 h of treatment[3].
Alisol B (30 μM; 4-24 h) activates the CaMKK-AMPK-mTOR pathway in MCF-7 cells, as shown by increased AMPKα phosphorylation and reduced p70S6 kinase phosphorylation over time[3].
Alisol B (30 μM; 16 h) induces autophagy and cytotoxicity in MCF-7 cells in an intracellular calcium- and CaMKK-dependent manner[3].
Alisol B (30 μM; 8-24 h) activates the UPR in MCF-7 cells through the PERK and ATF6 signaling pathways, but does not activate the IRE1 pathway[3].
Alisol B (30 μM; 24-48 h) induces late apoptotic cell death in MCF-7 cells, as shown by increased Annexin V+7AAD+ cells and PARP cleavage after 48 h of treatment[3].
MedChemExpress (MCE) has not independently confirmed the accuracy of these methods. They are for reference only. Further protocols information, click here.
-
Cell Line:MCF-7 cells expressing GFP-LC3
-
Concentration:30 μM
-
Incubation Time:16 h; 24 h
-
Result:Significantly increased the percentage of cells exhibiting GFP-LC3 puncta, a marker of autophagosome formation.
-
Cell Line:MCF-7 cells
-
Concentration:30 μM
-
Incubation Time:16 h; 24 h
-
Result:Led to detection of numerous double-membraned autophagosomes and autophagic vacuoles containing degraded organelles in treated cells.
-
Cell Line:MCF-7 cells
-
Concentration:30 μM
-
Incubation Time:8 h; 12 h; 16 h; 20 h
-
Result:Increased LC3-II levels over time.
Showed further enhanced LC3-II accumulation when co-treated with lysosomal protease inhibitors, indicating increased autophagosome formation and enhanced autophagic flux.
-
Cell Line:MCF-7 cells
-
Concentration:30 μM
-
Incubation Time:8 h; 16 h; 24 h; 48 h
-
Result:Induced time-dependent accumulation of cells in the G1 phase.
Caused concomitant reductions in S phase and G2-M phase.
-
Cell Line:MCF-7, SK-BR-3, HeLa cells
-
Concentration:30 μM
-
Incubation Time:4 h; 8 h; 16 h; 20 h; 24 h; 48 h
-
Result:Induced time-dependent accumulation of p27 protein in MCF-7, SK-BR-3, and HeLa cells.
In Vivo
Alisol B (15-60 mg/kg; p.o.; daily; 7 days) dose-dependently protects against Cisplatin-induced acute kidney injury in male C57BL/6 wild-type mice by inhibiting sEH activity, and attenuating renal apoptosis, inflammation, and oxidative stress via GSK3β-mediated p53, NF-κB, and Nrf2 signaling pathways[2].
MedChemExpress (MCE) has not independently confirmed the accuracy of these methods. They are for reference only.
-
Animal Model:C57BL/6 wild-type (male, 23-25 g, Cisplatin-induced)[2]
-
Dosage:15 mg/kg; 30 mg/kg; 60 mg/kg
-
Administration:p.o.; daily; 7 days
-
Result:Reduced Cisplatin-induced elevations in blood urea nitrogen and serum creatinine, and reduced the renal weight/body weight ratio while reversing Cisplatin-induced body weight loss.
Reduced acute tubular necrosis scores.
Reduced the number of TUNEL-positive nuclei, reversed cisplatin-induced increases in cleaved-caspase 3, cleaved-PARP, p53 protein levels, and the Bax/Bcl-2 protein ratio.
Reduced cisplatin-induced increases in ICAM-1 and MCP-1 positive staining in renal sections.
Reduced Cisplatin-induced increases in 4-HNE, 8-OXO, and Grp78 positive staining in renal sections; reduced renal malonyldiadehyde (MDA) levels, and increased renal glutathione (GSH) and superoxide dismutase (SOD) levels.
Upregulated mRNA expression of Nrf2, HO-1, GCLC, GCLM, and NQO-1, downregulated Keap1 mRNA expression, and modulated corresponding protein levels to activate the Nrf2 pathway.
Increased renal levels of 8,9-EET, 11,12-EET, and 14,15-EET.


Chemical Information
-
CAS No. 18649-93-9
-
Appearance Solid
-
Molecular Weight 472.70
-
Formula C30H48O4
-
Color White to off-white
-
SMILES
C[C@]([C@@]1(C2=C([C@H](C)C[C@@H]([C@]3([H])C(C)(C)O3)O)CC1)C)(CC[C@@]4([H])C5(C)C)[C@]([C@H](C2)O)([H])[C@]4(CCC5=O)C
-
Structure Classification
-
Initial Source
-
Shipping
Room temperature in continental US; may vary elsewhere.
-
Storage
4°C, protect from light
* In solvent : -80°C, 6 months; -20°C, 1 month (protect from light)


Publications (1)
-
Journal Impact Factor
-
Most Recent


Solvent & Solubility
In Vitro:
DMSO : 100 mg/mL (211.55 mM; Need ultrasonic; Hygroscopic DMSO has a significant impact on the solubility of product, please use newly opened DMSO)
Please refer to the solubility information to select the appropriate solvent. Once prepared, please aliquot and store the solution to prevent product inactivation from repeated freeze-thaw cycles.
Storage method and period of stock solution: -80°C, 6 months; -20°C, 1 month (protect from light). When stored at -80°C, please use it within 6 months. When stored at -20°C, please use it within 1 month.
Please refer to the solubility information to select the appropriate solvent. Once prepared, please aliquot and store the solution to prevent product inactivation from repeated freeze-thaw cycles.
Storage method and period of stock solution: -80°C, 6 months; -20°C, 1 month (protect from light). When stored at -80°C, please use it within 6 months. When stored at -20°C, please use it within 1 month.
Concentration (start) × Volume (start) = Concentration (final) × Volume (final)
In Vivo:
Select the appropriate dissolution method based on your experimental animal and administration route.
- For the following dissolution methods, please ensure to first prepare a clear stock solution using an In Vitro approach and then sequentially add co-solvents:
- To ensure reliable experimental results, the clarified stock solution can be appropriately stored based on storage conditions. As for the working solution for In Vivo experiments, it is recommended to prepare freshly and use it on the same day.
- The percentages shown for the solvents indicate their volumetric ratio in the final prepared solution. If precipitation or phase separation occurs during preparation, heat and/or sonication can be used to aid dissolution.
Add each solvent one by one: 10% DMSO 40% PEG300 5% Tween-80 45% Saline
Solubility: 2.5 mg/mL (5.29 mM); Suspended solution; Need ultrasonic
This protocol yields a suspended solution of 2.5 mg/mL. Suspended solution can be used for oral and intraperitoneal injection.
Taking 1 mL working solution as an example, add 100 μL DMSO stock solution (25.0 mg/mL) to 400 μL PEG300, and mix evenly; then add 50 μL Tween-80 and mix evenly; then add 450 μL Saline to adjust the volume to 1 mL.
Preparation of Saline: Dissolve 0.9 g sodium chloride in ddH₂O and dilute to 100 mL to obtain a clear Saline solution.
Add each solvent one by one: 10% DMSO 90% (20% SBE-β-CD in Saline)
Solubility: ≥ 2.5 mg/mL (5.29 mM); Clear solution
This protocol yields a clear solution of ≥ 2.5 mg/mL (saturation unknown).
Taking 1 mL working solution as an example, add 100 μL DMSO stock solution (25.0 mg/mL) to 900 μL 20% SBE-β-CD in Saline, and mix evenly.
Preparation of 20% SBE-β-CD in Saline (4°C, storage for one week): 2 g SBE-β-CD powder is dissolved in 10 mL Saline, completely dissolve until clear.
In Vivo Dissolution Calculator
Please enter the basic information of animal experiments:
-
-
-
-
Recommended: Prepare an additional quantity of animals to account for potential losses during experiments.
Please enter your animal formula composition:
-
%DMSO +
Recommended: Keep the proportion of DMSO in working solution below 2% if your animal is weak.
-
%+
-
+%Tween-80 + +
-
%Saline +
The co-solvents required include: DMSO, . All of co-solvents are available by MedChemExpress (MCE). , Tween 80. All of co-solvents are available by MedChemExpress (MCE).
Working solution concentration: 0.22 mg/mL
Method for preparing stock solution: mg drug dissolved in μL DMSO. Stock solution concentration: mg/mL. * In solvent : -80°C, 6 months; -20°C, 1 month (protect from light)
1. Take μL DMSO stock solution;
2. Add μL .
μL , mix evenly;
3. Then add μL Tween 80, mix evenly;
4. Then add μL
Please ensure that the stock solution in the first step is dissolved to a clear state, and add co-solvents in sequence. You can use ultrasonic heating (ultrasonic cleaner, recommended frequency 20-40 kHz), vortexing, etc. to assist dissolution.

Protocols
-
Western Blot
Western blotting (WB) is a commonly used experimental method in molecular biology, biochemistry, and immunogenetics for identifying and quantifying target proteins. It combines gel electrophoresis with immunoassay, enabling researchers to analyze protein expression, post-translational modifications, and molecular weight.
-
RNA extraction experimental
By lysing cells, releasing RNA, and removing impurities such as proteins and DNA, high-purity RNA products are finally obtained. The commonly used traditional method is the guanidine isothiocyanate/phenol/chloroform method (Trizol), which is suitable for a variety of animal materials including animal tissues, microorganisms, cultured cells, etc., and most plant materials.
-
Nephrotoxicity Study
This protocol assesses nephrotoxicity by combining functional kidney injury readouts, urinary/tissue injury biomarkers, and renal histopathology. Serum creatinine and BUN reflect impaired kidney function, while KIM-1, NGAL, clusterin, osteopontin, IL-18, cystatin C, nephrin, Oat5, urinary protein, glucose, and alkaline phosphatase have been used to detect tubular injury in cisplatin-, gentamicin-, and acetaminophen-induced nephrotoxicity models.
-
Annexin V plus membrane-impermeant dye apoptosis staining
Annexin V-based apoptosis assays rely on the detection of phosphatidylserine (PS) externalization from the inner leaflet of the plasma membrane to the outer leaflet, an early biochemical hallmark of apoptosis. Fluorescently labeled Annexin V binds PS in a calcium-dependent manner, enabling identification of early apoptotic cells by flow cytometry or fluorescence microscopy. When combined with a membrane-impermeant DNA-binding dye (e. g. , propidium iodide), this approach allows discrimination between viable (Annexin V−/dye−), early apoptotic (Annexin V+/dye−), and late apoptotic or necrotic (Annexin V+/dye+) cell populations by assessing membrane integrity and PS exposure.
-
BrdU Incorporation Assay
Bromodeoxyuridine (BrdU) incorporation assay is based on the principle that BrdU, a thymidine analog, is incorporated into newly synthesized DNA during the S phase of the cell cycle, thereby serving as a marker of DNA replication and cellular proliferation. Incorporated BrdU can be detected using anti-BrdU antibodies following DNA denaturation, enabling visualization or quantification of proliferating cells through immunochemical detection methods such as immunofluorescence or immunohistochemistry.
-
Protocol for Cell Cycle
Cell-cycle analysis by flow cytometry measures DNA content in single cells to estimate the fraction of cells in G0/G1, S, and G2/M phases. Propidium iodide intercalates into DNA, and after RNA removal with RNase, fluorescence intensity reflects cellular DNA content: 2N cells are assigned to G0/G1, cells between 2N and 4N to S phase, and 4N cells to G2/M. DNA-content analysis alone cannot reliably separate G0 from G1 or G2 from M. Ki-67 can distinguish quiescent G0 cells from cycling cells, EdU or BrdU incorporation marks active DNA synthesis in S phase, and phospho-histone H3 staining identifies mitotic cells within the 4N population.
-
Breast Cancer Modeling
Breast cancer is a heterogeneous cancer, and it has been distinguished into four subtypes: luminal A, luminal B, HER2-positive and basal-like. Molecular mutations, epigenetic alterations, hormone exposure and immune microenvironment are related to the progression of breast cancer.
-
Kinase activity and phosphorylation assays
Kinase activity assays measure the ability of kinases to transfer phosphate groups from ATP to specific substrates, while phosphorylation assays detect the presence and levels of phosphorylated proteins. Common methods include radiolabeled ATP incorporation (e. g. ,), ADP release detection via bioluminescence (e. g. ,[3]), enzyme-linked immunosorbent assays (ELISA) for phospho-specific epitopes (e. g. ,[6]), and microtiter-based formats for high-throughput screening (e. g. ,[8]). The ADP-Glo assay quantifies kinase activity by measuring ADP produced during phosphorylation using a luciferase-based system. Radiometric assays involve autoradiography or scintillation counting after incorporation of 32P-labeled ATP into substrate proteins. ELISA-based approaches rely on phospho-specific antibodies to detect activated kinases in cell lysates or purified samples.
-
Collagen-Induced Arthritis
Collagen-induced arthritis (CIA) is an autoimmune murine model of rheumatoid arthritis in which immunization with type II collagen (CII) emulsified in an adjuvant induces a T cell- and autoantibody-driven inflammatory arthritis characterized by synovial hyperplasia, immune cell infiltration, and joint destruction. The model typically relies on genetically susceptible mouse strains (e. g. , DBA/1) and reproduces key features of human rheumatoid arthritis, including anti-collagen immune responses and progressive joint inflammation. Disease onset generally occurs within ~3-4 weeks after immunization, depending on antigen/adjuvant combinations and protocol variation. The immunopathology is driven by adaptive immune activation against CII, leading to systemic and local joint inflammation mediated by pro-inflammatory cytokines and effector immune cells, making CIA a standard preclinical platform for evaluating immunomodulatory and anti-arthritic interventions.
-
Apoptosis
Apoptosis, also called programmed cell death, is generally characterized by distinct morphological characteristics.
-
TUNEL staining for apoptotic DNA fragmentation
TUNEL staining detects DNA strand breaks by using terminal deoxynucleotidyl transferase to add labeled nucleotides to exposed 3′-OH DNA termini, generating either microscopic staining in fixed cells or tissue sections, or fluorescence/cytometric signal in cell suspensions. TUNEL positivity reflects DNA fragmentation but should not be interpreted alone as definitive apoptosis, because TUNEL can also label necrotic, autolytic, mechanically damaged, or DNA-repair-associated DNA breaks.
-
Flow cytometric DNA-content cell-cycle staining
Flow cytometric DNA-content cell-cycle staining measures the fluorescence intensity of DNA-bound fluorochromes in single cells or nuclei to estimate DNA content distributions, allowing assignment of populations to G0/G1, S, and G2/M phases by DNA histogram deconvolution. Propidium iodide (PI) intercalates into DNA, and PI fluorescence is proportional to cellular DNA content when staining is performed under conditions that make DNA accessible and minimize non-DNA signal. Cells with G2/M DNA content are expected to show approximately twice the fluorescence intensity of G0/G1 cells, while S-phase cells occupy intermediate fluorescence values. PI-based DNA-content analysis can also detect cells with fractional DNA content, often reported as sub-G1, when DNA fragmentation and extraction during staining reduce retained DNA signal in apoptotic cells. DAPI is an alternative DNA fluorochrome for univariate DNA-content analysis, while bivariate approaches combining DNA content with proliferation
-
Autophagy
Autophagy is a process in which eukaryotic cells use lysosomes to degrade their own cytoplasmic proteins and damaged organelles under the regulation of autophagy related gene (Atg). Microtubule-associated proteins light chain 3 (LC3) is recognized as autophagy marker, which transfers from cytoplasmic LC3 (LC3-I) to membrane type (LC3-II). LC3-II/I ratio could be detected by Western Blot and fluorescence microscopy.
-
Apoptosis Solutions
Apoptosis is a regulated, generally non-lytic cell-death pathway that removes unwanted, damaged, infected, or abnormal cells through coordinated morphological changes, caspase activation, DNA fragmentation, and membrane remodeling. The intrinsic apoptosis pathway is controlled mainly by mitochondrial outer membrane permeabilization, BCL-2 family proteins, cytochrome c release, apoptosome formation, caspase-9 activation, and downstream executioner caspase-3/7 activation. The extrinsic apoptosis pathway is initiated by death receptors such as Fas, TNFR, and TRAIL receptors, which recruit adaptor proteins and activate caspase-8 before engaging executioner caspases or mitochondrial amplification through BID cleavage. Apoptosis is linked to many phenotypes, including cancer cell killing, tissue homeostasis, immune regulation, neurodegeneration, infection response, and treatment-induced cytotoxicity; unresolved questions include how apoptosis interacts with necroptosis, pyroptosis, ferroptos
-
Protocol for Kinase activity and phosphorylation assays
Kinase activity assays measure transfer of phosphate from ATP to a protein or peptide substrate, generating phosphorylated substrate, ADP, or incorporated radiolabeled phosphate as the readout; phosphorylation assays measure site-specific phosphorylation in cells or tissues as a proxy for kinase-pathway activation, inhibition, or substrate regulation. Phosphorylation can be detected by phospho-specific Western blot, immunoprecipitation kinase assay, phospho-immunofluorescence, phospho-flow cytometry, luminescent ADP detection, radiolabeled ATP incorporation, or reporter-based pathway assays, and these readouts can be applied to cancer cells, primary neurons, mouse tumors, organoids, inflammatory macrophages, ferroptosis studies, and mitophagy studies when the kinase target is biologically relevant.
-
Macroautophagy Solutions
Macroautophagy is a conserved lysosome-dependent degradation pathway in which cytoplasmic material is sequestered into double-membrane autophagosomes and delivered to lysosomes for degradation and recycling. The pathway supports cellular homeostasis during nutrient limitation, organelle stress, protein-aggregate accumulation, infection, differentiation, and tissue remodeling by coupling cargo sequestration, autophagosome maturation, lysosomal fusion, and degradation of cargo-derived macromolecules. The core molecular sequence includes initiation by nutrient- and stress-regulated autophagy machinery, autophagosome nucleation, LC3/ATG8-family conjugation to autophagosomal membranes, cargo selection through receptors such as SQSTM1/p62, autophagosome-lysosome fusion, and lysosomal degradation. LC3 was identified as a mammalian homolog of yeast Atg8 that localizes to autophagosomal membranes after processing, and p62/SQSTM1 was shown to connect ubiquitinated cargo with autophagic degradati
-
Osteoclast differentiation from monocyte/macrophage precursors
Osteoclast differentiation is an in vitro induction assay in which monocyte/macrophage-lineage precursors are exposed to macrophage colony-stimulating factor (M-CSF) and receptor activator of NF-κB ligand (RANKL), generating multinucleated osteoclasts that are commonly identified by tartrate-resistant acid phosphatase (TRAP) staining and functionally confirmed by resorption pits on dentin, bone, or mineralized substrates. M-CSF supports survival and expansion of osteoclast precursors, while RANKL binding to RANK drives osteoclast commitment, fusion, maturation, and resorptive function; osteoprotegerin inhibits this pathway by binding RANKL and preventing RANK activation. The main readouts are the number of TRAP-positive multinucleated cells, formation of F-actin rings, and resorbed surface area; TRAP-positive multinucleated cells indicate osteoclast differentiation, whereas pit formation on dentin, bone, or mineralized coating indicates functional bone-resorbing activity.


Purity & Documentation
-
Data Sheet (288 KB)
-
SDS (393 KB)
- English - EN (393 KB)
- Français - FR (393 KB)
- Deutsch - DE (393 KB)
- Norwegian - NO (393 KB)
- Español - ES (393 KB)
- Swedish - SV (393 KB)
- Italian - IT (393 KB)
- Korean - KR (393 KB)
- Portuguese - PT (393 KB)
-
Handling Instructions (2659 KB)
References
[1]. Lee JW, et al. Alisol-B, a novel phyto-steroid, suppresses the RANKL-induced osteoclast formation and prevents bone loss in mice. Biochem Pharmacol. 2010;80(3):352-361. [Content Brief]
[2]. Zhang J, et al. Direct targeting of sEH with alisol B alleviated the apoptosis, inflammation, and oxidative stress in cisplatin-induced acute kidney injury. Int J Biol Sci. 2023;19(1):294-310. Published 2023 Jan 1. [Content Brief]
[3]. Law BY, et al. Alisol B, a novel inhibitor of the sarcoplasmic/endoplasmic reticulum Ca(2+) ATPase pump, induces autophagy, endoplasmic reticulum stress, and apoptosis. Mol Cancer Ther. 2010;9(3):718-730. [Content Brief]


Complete Stock Solution Preparation Table
Please refer to the solubility information to select the appropriate solvent. Once prepared, please aliquot and store the solution to prevent product inactivation from repeated freeze-thaw cycles.
Storage method and period of stock solution: -80°C, 6 months; -20°C, 1 month (protect from light). When stored at -80°C, please use it within 6 months. When stored at -20°C, please use it within 1 month.
| Optional Solvent | Concentration Solvent Mass | 1 mg | 5 mg | 10 mg | 25 mg |
|---|---|---|---|---|---|
| DMSO | 1 mM | 2.1155 mL | 10.5775 mL | 21.1551 mL | 52.8877 mL |
| 5 mM | 0.4231 mL | 2.1155 mL | 4.2310 mL | 10.5775 mL | |
| 10 mM | 0.2116 mL | 1.0578 mL | 2.1155 mL | 5.2888 mL | |
| 15 mM | 0.1410 mL | 0.7052 mL | 1.4103 mL | 3.5258 mL | |
| 20 mM | 0.1058 mL | 0.5289 mL | 1.0578 mL | 2.6444 mL | |
| 25 mM | 0.0846 mL | 0.4231 mL | 0.8462 mL | 2.1155 mL | |
| 30 mM | 0.0705 mL | 0.3526 mL | 0.7052 mL | 1.7629 mL | |
| 40 mM | 0.0529 mL | 0.2644 mL | 0.5289 mL | 1.3222 mL | |
| 50 mM | 0.0423 mL | 0.2116 mL | 0.4231 mL | 1.0578 mL | |
| 60 mM | 0.0353 mL | 0.1763 mL | 0.3526 mL | 0.8815 mL | |
| 80 mM | 0.0264 mL | 0.1322 mL | 0.2644 mL | 0.6611 mL | |
| 100 mM | 0.0212 mL | 0.1058 mL | 0.2116 mL | 0.5289 mL |


Alisol B Related Classifications
HY-N0805A Related Classifications
 Powered by Bioz