



F16

Based on 1 Customer Validation
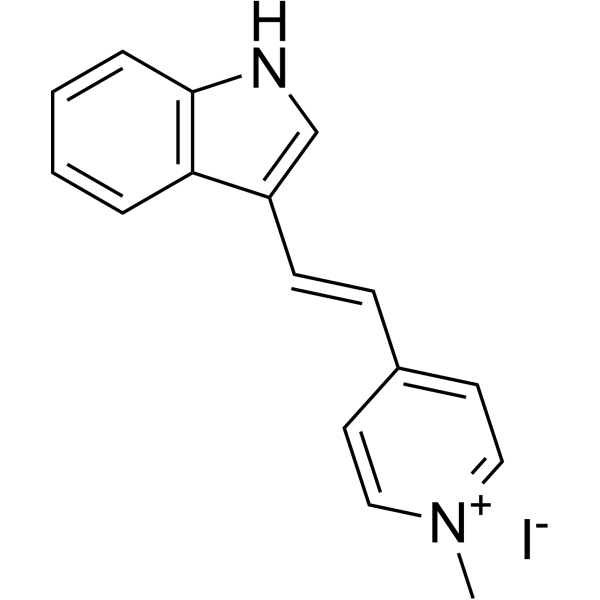
F16 is a mitochondrial permeability transition pore (PTP) modulator with an EC50 of 30 μM in mice. F16 promotes PTP opening, accumulates in cancer cell mitochondria, and induces mitochondrial depolarization, swelling, cristae disruption, outer membrane rupture, ATP depletion, reactive oxygen species (ROS) production, cytochrome c release and mitochondrial uncoupling. F16 induces cell cycle arrest at the G1 (occasionally G2) phase, reduces the phosphotyrosine content of Neu, as well as the levels of phosphorylated PKB/Akt and phosphorylated MAP kinase, downregulates the protein expression levels of Neu and PKB, triggers apoptosis in cells with moderate Bcl-2 expression, and induces necrosis in cells with overexpressed Bcl-2. F16 can be used in research related to breast cancer and gastric cancer.
For research use only. We do not sell to patients.
- Purity : 98.67%
- CAS No.: 36098-33-6
- Formula: C16H15IN2
- Molecular Weight:362.21
-
Storage:
4°C, sealed storage, away from moisture
* In solvent : -80°C, 6 months; -20°C, 1 month (sealed storage, away from moisture)

To place orders, for customer services and technical support, please contact: MedChemExpress USA
Tel: 609-228-6898 E-mail: [email protected] [email protected]


-
 Biological Activity
-
Chemical Information
-
Solvent & Solubility
- Protocols
- Purity & Documentation
- References
-
 Help & FAQs


-

HY-100395R
F16 (Standard)Reference Standard -
HY-N0164
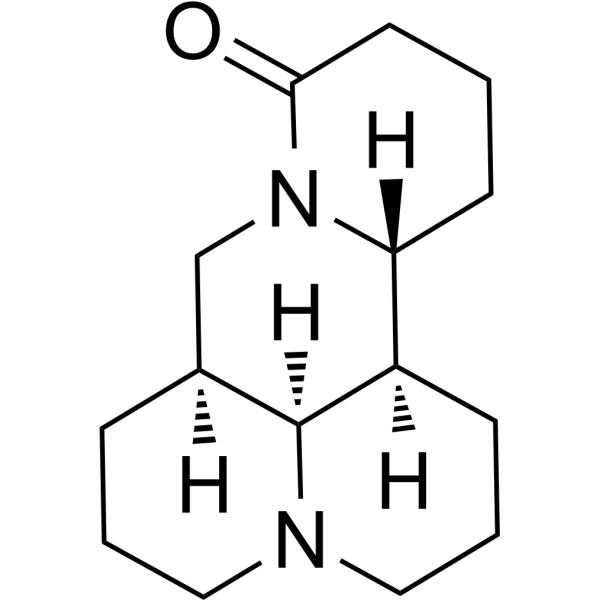
MatrineAnticancer Agent -
HY-10529
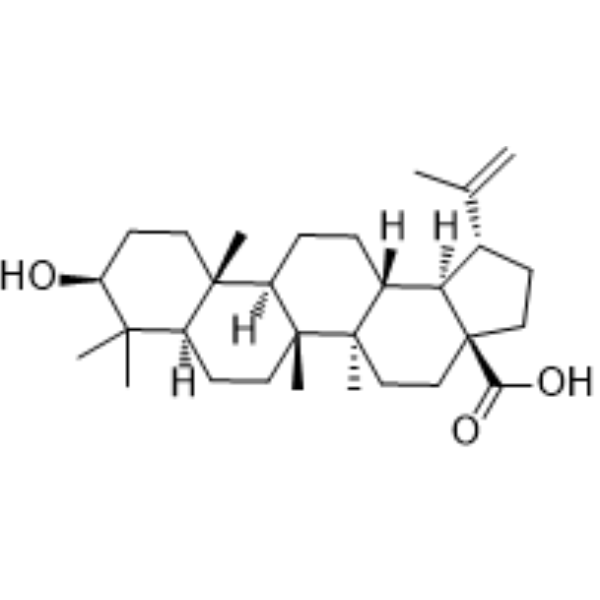
Betulinic acidApoptosis Inducer -
HY-N0848
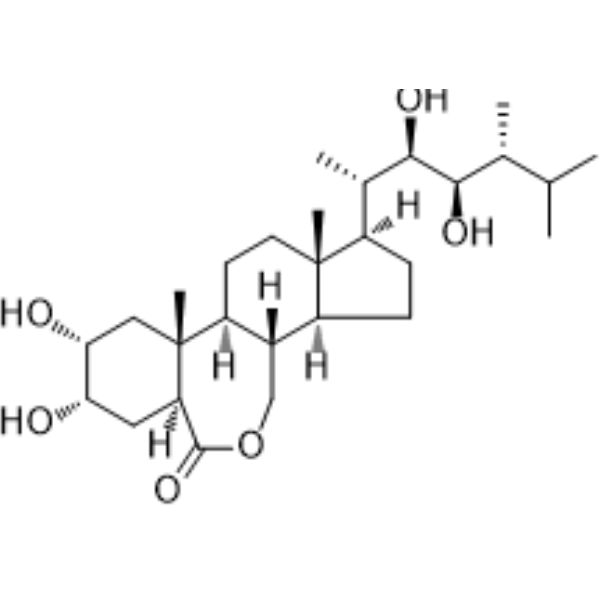
EpibrassinolideApoptosis Inducer -
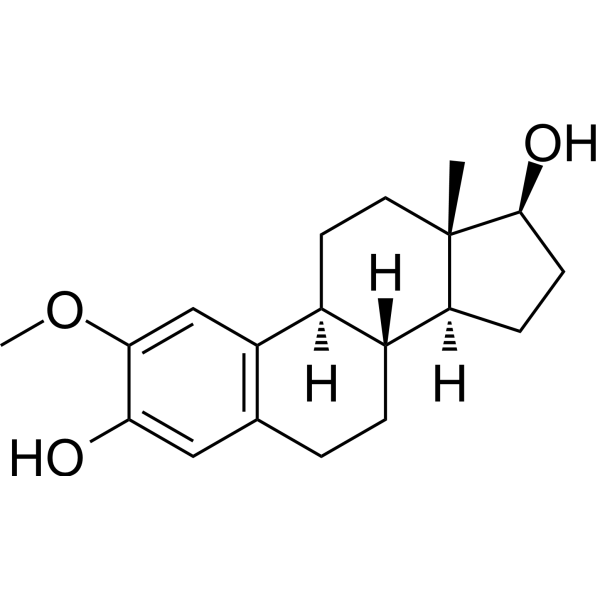
HY-12033
2-MethoxyestradiolSteroid Metabolite -
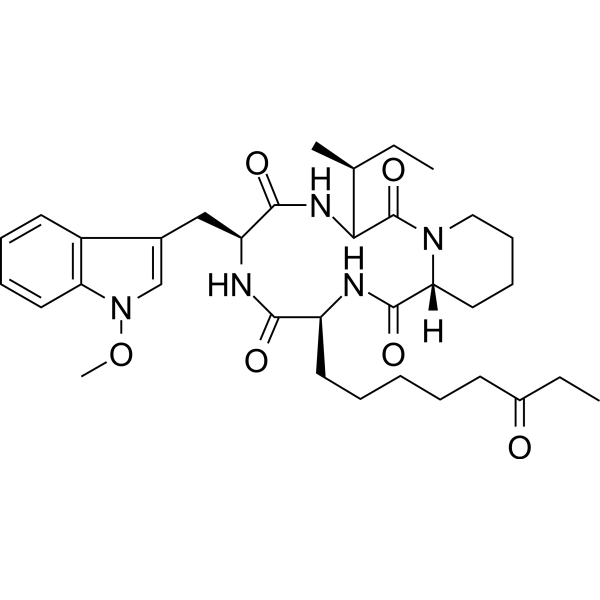
HY-N6735
ApicidinHDAC Inhibitor -
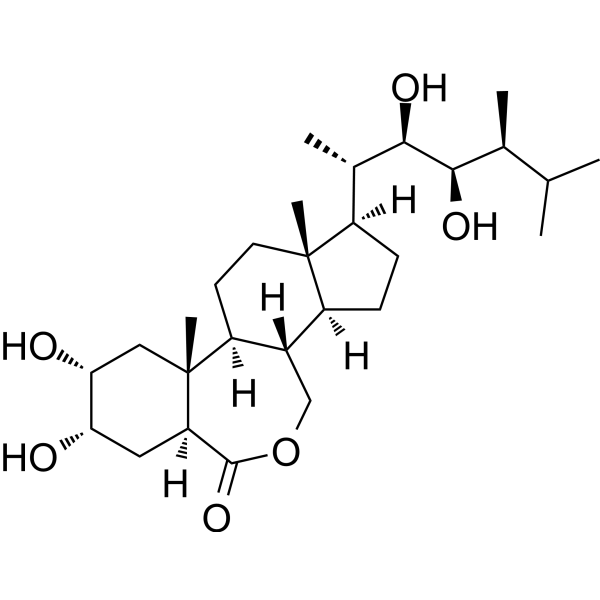
HY-N0273
BrassinolideApoptosis Inducer -
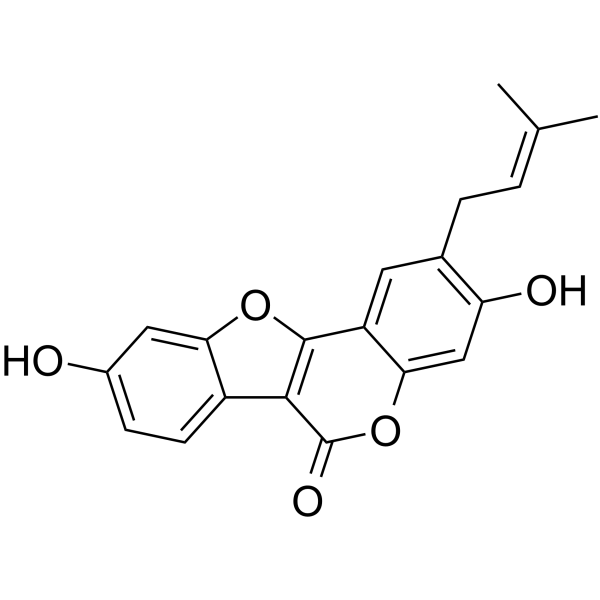
HY-N0232
PsoralidinCOX-2/5-LOX Inhibitor -
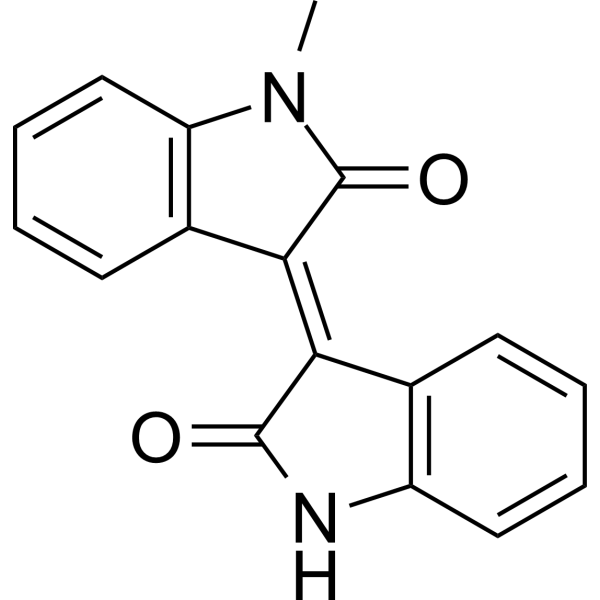
HY-13680
MeisoindigoApoptosis Inducer -
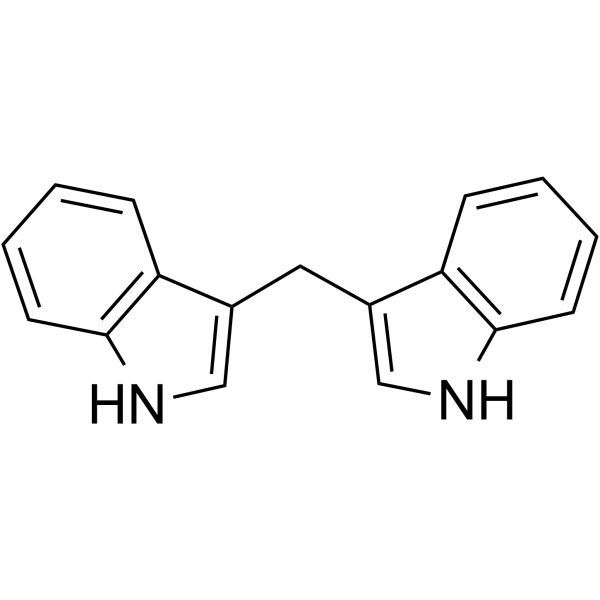
HY-15758
3,3'-DiindolylmethaneAndrogen Receptor Antagonist


Biological Activity
Description
|
PTP 30 μM (EC50) |
PKB |
Akt |
MAP |
Neu |
Bcl-2 |
Cellular Effect
|
Cell Line

|
Type | Value | Description | References |
|---|---|---|---|---|
| SGC-7901 | IC50 |
3.45 μM
|
Inhibits SGC-7901 cells growth.
Inhibits SGC-7901 cells growth.
|
29069523 |
| MCF7 | IC50 |
18.99 μM
|
Inhibits mcf-7 cells growth.
Inhibits mcf-7 cells growth.
|
29069523 |
| GES1 | IC50 |
41.79 μM
|
Inhibits GES-1 cells growth.
Inhibits GES-1 cells growth.
|
29069523 |
| HEK293 | IC50 |
38.49 μM
|
Inhibits HEK-293 cells growth.
Inhibits HEK-293 cells growth.
|
29069523 |
In Vitro
F16 (3 μM; 36 h-3 days) induces cell cycle arrest (primarily G1 arrest) in EpH4-A6 neu-overexpressing mouse mammary epithelial cells and sensitive mouse and human breast tumor cell lines[1].
F16 (24 h) induces S phase cell cycle arrest in SGC-7901 cells after 24 h of incubation[3].
F16 (0.3-3 μM; 48 h) induces oligonucleosomal DNA fragmentation (apoptosis) in apoptosis-sensitive EpH4-A6 and SMF cells, but not in apoptosis-resistant EpH4, Bcl-2-overexpressing EpH4-A6.C13, EpH4-A6.C18, SMF-Bcl-2, or NF324-1C cells[2].
F16 (3 μM; 18-36 h) induces cytochrome c release (an apoptotic marker) in apoptosis-sensitive EpH4-A6 cells within 18 h, but not in apoptosis-resistant Bcl-2-overexpressing EpH4-A6.C13 and EpH4-A6.C18 cells, where delayed cytochrome c localization changes are associated with mitochondrial breakdown rather than apoptosis[2].
F16 (3 μM; 24 h) induces caspase-3 activation (an apoptotic marker) in apoptosis-sensitive EpH4-A6 and SMF cells, but not in apoptosis-resistant Bcl-2-overexpressing EpH4-A6.C13, EpH4-A6.C18, SMF-Bcl-2, or NF324-1C cells[2].
F16 (Various concentrations; 24 h) induces apoptosis in SGC-7901 cells in a concentration-dependent manner after 24 h of incubation[3].
F16 (3 μM; 48 h) induces apoptotic morphological changes in EpH4-A6 cells and necrotic morphological changes in Bcl-2-overexpressing EpH4-A6.C13 cells after 48 h of incubation[2].
F16 (48 h) has its cytotoxicity on SGC-7901 cells almost completely reversed by ATP pre-treatment 0.5 h before F16, indicating that decreased intracellular ATP availability is a major factor in F16-mediated cytotoxicity[3].
F16 (48 h) reduces intracellular ATP levels in SGC-7901 cells after 48 h of incubation, with no additional effect at higher concentrations[3].
F16 (10 µM; higher concentrations) induces dose-dependent structural damage to isolated rat liver mitochondria, including swelling at 10 µM and membrane rupture at higher concentrations[3].
F16 enhances H+ and K+ permeabilization of the inner membrane of isolated rat liver mitochondria in a concentration-dependent manner[3].
F16 immediately increases the membrane fluidity of isolated rat liver mitochondria, as measured by reduced fluorescence anisotropy of HP-labeled mitochondria[3].
F16 (75 µM) increases state 4 oxygen consumption rate of isolated rat liver mitochondria in a dose-dependent manner, with a 3-fold increase at 75 µM, indicating an uncoupling effect[3].
F16 (20 µM) increases the metabolic thermogenic output of isolated rat liver mitochondria at 20 µM, consistent with an uncoupling effect on oxidative phosphorylation[3].
F16 causes a concentration-dependent decrease in mitochondrial membrane potential (ΔΨm) in isolated rat liver mitochondria, which is mediated by mitochondrial permeability transition (MPT)[3].
F16 (1 h) induces concentration-dependent release of cytochrome c from isolated rat liver mitochondria after 1 h of incubation at 4 °C[3].
F16 (3 μM; 1 h) accumulation in mitochondria is driven and retained by the mitochondrial transmembrane potential (ΔΨm), and lack of accumulation in resistant cell lines is not mediated by MDR-1 or MRP-1 pumps[1].
F16 (1 μM; 1 h) does not alter accumulation in EpH4-A6 cells due to Bcl-2 overexpression, with F16-sensitive cell lines showing higher mitochondrial accumulation than F16-resistant cell lines[2].
MedChemExpress (MCE) has not independently confirmed the accuracy of these methods. They are for reference only.
-
Cell Line:EpH4-A6 neu-overexpressing mouse mammary epithelial cells, EpH4-EV control mouse mammary epithelial cells
-
Concentration:10-15 μM; 1 μM; 100 nM
-
Incubation Time:36-40 h; (secondary screen, no time specified); (dose-response assay, no time specified)
-
Result:Selectively inhibited BrdU incorporation in EpH4-A6 cells relative to control cells at 10-15 μM.
Partially inhibited BrdU incorporation in EpH4-A6 cells at 1 μM.
Showed partial inhibition in a dose-response format at 100 nM.
-
Cell Line:neu-, v-Ha-ras-, β-catenin-, c-myc-initiated mouse tumor cell lines, human breast cancer cell lines
-
Concentration:3 μM
-
Incubation Time:3 days; 7 days
-
Result:Reduced cell number by 2-5 fold at 3 days and 10-40 fold at 7 days in neu- or v-Ha-ras-initiated mouse mammary tumor cell lines.
Reduced cell number by 2-4 fold in β-catenin-initiated mouse mammary tumor cell lines.
Showed no effect on c-myc-initiated mouse mammary tumor cell lines and v-Ha-ras-initiated mouse fibrosarcoma cell lines.
Inhibited proliferation in 8 of 10 human breast cancer cell lines, with no effect on MDA-MB-231 and MDA-MB-435.
-
Cell Line:EpH4-A6 neu-overexpressing mouse mammary epithelial cells, EpH4-EV control cells, sensitive mouse tumor cell lines, sensitive human breast cancer cell lines
-
Concentration:3 μM
-
Incubation Time:36 h (mouse cells); 3 days (human cells)
-
Result:Caused a dramatic decrease in S-phase cells and an increase in G1-phase cells in EpH4-A6 cells.
Induced similar decreases in S-phase cells in sensitive mouse tumor and human breast cancer cell lines, with most showing G1 arrest and a few showing both G1 and G2 arrest.
Caused no significant changes in EpH4-EV control cells.
-
Cell Line:EpH4-A6 neu-overexpressing mouse mammary epithelial cells, EpH4-EV control cells
-
Concentration:3 μM
-
Incubation Time:48, 60, 72 h (DNA fragmentation); 24, 48, 72 h (Annexin V/7-AAD staining); 15, 24, 48 h (cytochrome c detection)
-
Result:Induced oligonucleosomal DNA fragmentation in EpH4-A6 cells after 48, 60, and 72 h, with no fragmentation in EpH4-EV cells.
Triggered early apoptosis in a subpopulation of EpH4-A6 cells after 24 h, with increased late apoptosis or cell death at longer incubation times; no significant apoptosis in EpH4-EV cells.
Induced early cytochrome c release in EpH4-A6 cells, with loss of punctate mitochondrial staining and appearance of diffuse cytosolic staining.
-
Cell Line:EpH4-A6 neu-overexpressing mouse mammary epithelial cells, EpH4-EV control cells
-
Concentration:3 μM
-
Incubation Time:24, 48 h
-
Result:Decreased phosphotyrosine content of Neu, phosphorylated PKB, and phosphorylated MAPK in EpH4-A6 cells.
Reduced Neu and PKB protein levels in EpH4-A6 cells.
Left MAPK and β-actin levels unchanged in EpH4-A6 cells.
Caused no significant changes in EpH4-EV cells.
-
Cell Line:mouse mammary epithelial EpH4-A6 cells, Bcl-2-overexpressing EpH4-A6.C13 cells, Bcl-2-overexpressing EpH4-A6.C18 cells, mouse mammary adenocarcinoma SMF cells, Bcl-2-overexpressing SMF cells, mouse mammary tumor NF324-1C cells
-
Concentration:3 μM
-
Incubation Time:24 h, 48 h, 96 h
-
Result:Reduced EpH4-A6 cell number by 9.5-fold after 24 h and 32-fold after 96 h.
Reduced EpH4-A6.C13 cell number by 5-fold after 24 h and 20-fold after 96 h.
Reduced EpH4-A6.C18 cell number by 4.2-fold after 24 h and 19-fold after 96 h.
Reduced SMF cell number by 6.4-fold after 48 h.
Reduced Bcl-2-overexpressing SMF cell number by 3.6-fold after 48 h.
Reduced NF324-1C cell number by 2.9-fold after 48 h.
-
Cell Line:mouse mammary epithelial EpH4-A6 cells, Bcl-2-overexpressing EpH4-A6.C13 cells, Bcl-2-overexpressing EpH4-A6.C18 cells
-
Concentration:3 μM; 50 μM zVAD-fmk (Z-VAD-FMK) (HY-16658B) (co-incubated with F16); 28 mM Glucose (D-Glucose) (HY-B0389) (co-incubated with F16); 1 mM Tiron (HY-D0261) (co-incubated with F16)
-
Incubation Time:24 h, 48 h
-
Result:Induced an annexin V positive/7-AAD negative apoptotic population in EpH4-A6 cells.
Induced an annexin V negative/7-AAD positive necrotic population in Bcl-2-overexpressing EpH4-A6.C13 and EpH4-A6.C18 cells.
Caused 22% cell death in EpH4-A6 cells after 24 h, which was reduced to 11% with zVAD-fmk.
Caused 46% cell death in EpH4-A6 cells after 48 h, which was reduced to 28% with zVAD-fmk.
Caused 12% cell death in EpH4-A6.C13 cells after 24 h, which was reduced to 3% with zVAD-fmk plus glucose plus Tiron.
Caused 36% cell death in EpH4-A6.C13 cells after 48 h, which was reduced to 15% with zVAD-fmk plus glucose plus Tiron.
-
Cell Line:mouse mammary epithelial EpH4-A6 cells, Bcl-2-overexpressing EpH4-A6.C13 cells, Bcl-2-overexpressing EpH4-A6.C18 cells, mouse mammary adenocarcinoma SMF cells, Bcl-2-overexpressing SMF cells, mouse mammary tumor NF324-1C cells
-
Concentration:3 μM
-
Incubation Time:24 h
-
Result:Induced appearance of the cleaved (18 kDa) active form of caspase-3 in EpH4-A6 and SMF cells.
Showed no detectable cleaved caspase-3 in EpH4-A6.C13, EpH4-A6.C18, SMF-Bcl-2, or NF324-1C cells.
-
Cell Line:human gastric carcinoma (SGC-7901)
-
Concentration:3 µM
-
Incubation Time:24 h
-
Result:Showed strong overlap with MitoTracker® Red CM-H2XRos fluorescence, indicating selective accumulation in mitochondria.
In Vivo
MedChemExpress (MCE) has not independently confirmed the accuracy of these methods. They are for reference only.
-
Animal Model:Nude mice[1]
-
Dosage:20 mg/kg
-
Administration:i.p.
-
Result:Retarded the growth of subcutaneous tumors derived from EpH4-A6 cells.
- RNA extraction experimental
- Western Blot
- Mitochondrial membrane-potential fluorescent assay
- Annexin V plus membrane-impermeant dye apoptosis staining
- ROS/oxidative-stress fluorescent staining
- BrdU Incorporation Assay
- Protocol for Cell Cycle
- Breast Cancer Modeling
- Protocol For Protein Expression And Purification
- Detection of Apoptosis
- TUNEL staining for apoptotic DNA fragmentation
- Flow cytometric DNA-content cell-cycle staining
- Transepithelial/transendothelial electrical resistance assay
- Apoptosis Solutions
Clinical Trial
| NCT Number | Sponsor | Condition | Start Date |
Phase
|
|---|---|---|---|---|
| NCT01329991 | 2011-05 | PHASE1 |


Chemical Information
-
CAS No. 36098-33-6
-
Appearance Solid
-
Molecular Weight 362.21
-
Formula C16H15IN2
-
Color Yellow to orange
-
SMILES
C[N+]1=CC=C(/C=C/C2=CNC3=C2C=CC=C3)C=C1.[I-]
-
Shipping
Room temperature in continental US; may vary elsewhere.
-
Storage
4°C, sealed storage, away from moisture
* In solvent : -80°C, 6 months; -20°C, 1 month (sealed storage, away from moisture)


Solvent & Solubility
In Vitro:
DMSO : ≥ 31 mg/mL (85.59 mM; Hygroscopic DMSO has a significant impact on the solubility of product, please use newly opened DMSO)
Ethanol : 1 mg/mL (2.76 mM; Need ultrasonic)
* "≥" means soluble, but saturation unknown.
Please refer to the solubility information to select the appropriate solvent. Once prepared, please aliquot and store the solution to prevent product inactivation from repeated freeze-thaw cycles.
Storage method and period of stock solution: -80°C, 6 months; -20°C, 1 month (sealed storage, away from moisture). When stored at -80°C, please use it within 6 months. When stored at -20°C, please use it within 1 month.
Please refer to the solubility information to select the appropriate solvent. Once prepared, please aliquot and store the solution to prevent product inactivation from repeated freeze-thaw cycles.
Storage method and period of stock solution: -80°C, 6 months; -20°C, 1 month (sealed storage, away from moisture). When stored at -80°C, please use it within 6 months. When stored at -20°C, please use it within 1 month.
Concentration (start) × Volume (start) = Concentration (final) × Volume (final)


Purity & Documentation
-
Data Sheet (307 KB)
-
SDS (393 KB)
- English - EN (393 KB)
- Français - FR (393 KB)
- Deutsch - DE (393 KB)
- Norwegian - NO (393 KB)
- Español - ES (393 KB)
- Swedish - SV (393 KB)
- Italian - IT (393 KB)
- Korean - KR (393 KB)
- Portuguese - PT (393 KB)
-
Handling Instructions (2659 KB)
References
[1]. Fantin VR, et al. A novel mitochondriotoxic small molecule that selectively inhibits tumor cell growth. Cancer cell. 2002 Jul;2(1):29-42. [Content Brief]
[2]. Fantin VR, et al. F16, a mitochondriotoxic compound, triggers apoptosis or necrosis depending on the genetic background of the target carcinoma cell. Cancer research. 2004 Jan 01;64(1):329-36. [Content Brief]


Complete Stock Solution Preparation Table
Please refer to the solubility information to select the appropriate solvent. Once prepared, please aliquot and store the solution to prevent product inactivation from repeated freeze-thaw cycles.
Storage method and period of stock solution: -80°C, 6 months; -20°C, 1 month (sealed storage, away from moisture). When stored at -80°C, please use it within 6 months. When stored at -20°C, please use it within 1 month.
| Optional Solvent | Concentration Solvent Mass | 1 mg | 5 mg | 10 mg | 25 mg |
|---|---|---|---|---|---|
| Ethanol / DMSO | 1 mM | 2.7608 mL | 13.8041 mL | 27.6083 mL | 69.0207 mL |
| DMSO | 5 mM | 0.5522 mL | 2.7608 mL | 5.5217 mL | 13.8041 mL |
| 10 mM | 0.2761 mL | 1.3804 mL | 2.7608 mL | 6.9021 mL | |
| 15 mM | 0.1841 mL | 0.9203 mL | 1.8406 mL | 4.6014 mL | |
| 20 mM | 0.1380 mL | 0.6902 mL | 1.3804 mL | 3.4510 mL | |
| 25 mM | 0.1104 mL | 0.5522 mL | 1.1043 mL | 2.7608 mL | |
| 30 mM | 0.0920 mL | 0.4601 mL | 0.9203 mL | 2.3007 mL | |
| 40 mM | 0.0690 mL | 0.3451 mL | 0.6902 mL | 1.7255 mL | |
| 50 mM | 0.0552 mL | 0.2761 mL | 0.5522 mL | 1.3804 mL | |
| 60 mM | 0.0460 mL | 0.2301 mL | 0.4601 mL | 1.1503 mL | |
| 80 mM | 0.0345 mL | 0.1726 mL | 0.3451 mL | 0.8628 mL |


F16 Related Classifications
HY-100395 Related Classifications
 Powered by Bioz
Keywords
- F16
- 36098-33-6
- F 16
- F-16
- Mitochondrial Metabolism
- Reactive Oxygen Species (ROS)
- Akt
- p38 MAPK
- Bcl-2 Family
- Apoptosis
- Bcl-2
- carcinoma cell mitochondria
- MAP kinase
- normal mammary epithelial cells
- human breast cancer cells
- PKB/Akt
- nude mice
- mitochondrial permeability transition pore
- Neu
- EpH4-A6 neu-overexpressing mouse mammary epithelial cells
- Inhibitor
- inhibitor
- inhibit