



JPS016 TFA
Based on 1 publication(s) in Google Scholar
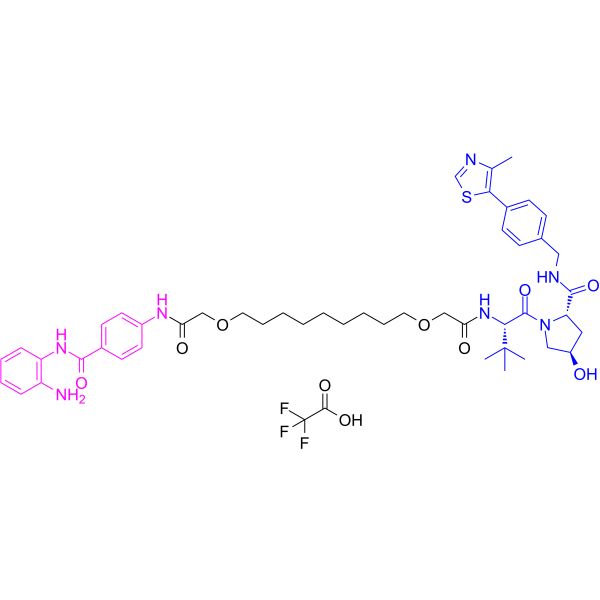
JPS016 TFA is a class I histone deacetylase (HDAC) PROTAC inhibitor. JPS016 TFA recruits the VHL E3 ligase (Ligands for E3 Ligase) to mediate the ubiquitination and proteasomal degradation of HDAC1, HDAC2 and HDAC3. JPS016 TFA reduces the viability of colon cancer cells and induces Apoptosis. JPS016 TFA activates the PINK1/Parkin mitochondrial Autophagy pathway, enhances cardiomyocyte viability, alleviates mitochondrial damage, and reduces mitochondrial ROS production in cells. JPS016 TFA is applicable to research related to colon cancer and sepsis cardiomyopathy.
(Pink: HDAC ligand (HY-50934); Blue: VHL ligand (HY-125845); Black: linker (HY-175977)).
연구목적의 판매만을 진행합니다. 환자를 대상으로 한 판매는 하지 않습니다.
- Purity : 99.47%
- 화학식: C50H64F3N7O10S
- 분자량:1012.14
-
보관:
-20°C, protect from light, stored under nitrogen
* In solvent : -80°C, 6 months; -20°C, 1 month (protect from light, stored under nitrogen)

To place orders, for customer services and technical support, please contact: MedChemExpress USA
Tel: 609-228-6898 E-mail: [email protected] [email protected]


-
 Biological Activity
-
Chemical Information
-
용액&용해도
- Protocol
- 순도&문서
- References
-
 Help & FAQs


Publications Citing Use of MedChemExpress (MCE) JPS016 TFA
MoreAll PROTACs Isoforms
More

Biological Activity
제품 설명
In Vitro
JPS016 (Compound 9) (0.001-100 μM; 24 h) TFA potently degrades HDAC1 (DC50 = 0.55 μM, Dmax = 77%) and HDAC3 (DC50 = 0.53 ± 0.13 μM, Dmax = 66%) in HCT116 cells after 24 h of treatment[1].
JPS016 (10 μM; 2-48 h) TFA upregulates the acetylation level of histone H3K56 in HCT116 cells in a time-dependent manner in vitro, with the acetylation peak occurring at 36 h[1].
JPS016 (1-10 μM; 24-48 h) TFA reduces the stability of LSD1 and SIN3A, components of the HDAC1/2 corepressor complex, in HCT116 cells[1].
JPS016 (0.1-100 μM; 48 h) TFA reduces the viability of HCT116 cells, with an EC50 of 5.3 μM after 48 h of treatment[1].
JPS016 (10 μM; 24-48 h) TFA induces apoptosis in HCT116 cells. After 48 h of treatment, 70% of cells are present in the apoptotic sub-G1 population, and the drug significantly enriches genes related to cell cycle arrest and apoptosis[1].
JPS016 (24 h) TFA protects HL-1 mouse cardiomyocytes against LPS (HY-D1056)-induced injury by restoring cell viability and reducing cytotoxicity, and decreases LPS-induced mitochondrial ROS production in cells[2].
JPS016 (0.01-10 μM) TFA induces dose-dependent degradation of class I HDACs in both untreated and LPS-stimulated HL-1 mouse cardiomyocytes, with preferential activity against HDAC1, HDAC3 and HDAC8[2].
JPS016 (24 h) TFA enhances histone acetylation and lactylation modifications in HL-1 mouse cardiomyocytes. Specifically, under LPS-induced SCM stress conditions, it reverses the LPS-induced pathogenic gene program, regulates mitochondria-related cellular processes in HL-1 mouse cardiomyocytes, and promotes exosome formation and mitochondrial extrusion in HL-1 mouse cardiomyocytes under LPS-induced SCM stress[2].
JPS016 (administered for 24 h) TFA activates the PINK1/Parkin mitophagy pathway in HL-1 mouse cardiomyocytes under LPS-induced SCM stress[2].
MedChemExpress (MCE) has not independently confirmed the accuracy of these methods. They are for reference only.
-
Cell Line:HCT116 human colon carcinoma cells
-
Concentration:0.01-10 μM (24 h dose-response); 10 μM (time-course)
-
Incubation Time:2-48 h (time-course); 24 h (dose-response)
-
Result:Reduced HDAC1 to 25%, HDAC2 to 50%, HDAC3 to 50% at 0.1 μM for 24 h.
Reduced HDAC1 to 25%, HDAC2 to 75%, HDAC3 to 25% at 1 μM for 24 h.
Reduced HDAC1 to 25%, HDAC2 to 75%, HDAC3 to ~100% (hook effect) at 10 μM for 24 h.
Reached 84% degradation of HDAC1 and 51% degradation of HDAC2 by 48 h at 10 μM.
Reached ~50% degradation of HDAC3 at 36 and 48 h at 10 μM.
Showed DC50 values of 0.55 ± 0.18 μM (HDAC1) and 0.53 ± 0.13 μM (HDAC3), with Dmax values of 77% (HDAC1), 45% (HDAC2), 66% (HDAC3) after 24 h dose-response testing.
-
Cell Line:HCT116 human colon carcinoma cells
-
Concentration:10 μM
-
Incubation Time:24, 48 h
-
Result:Induced 30% of cells in apoptotic sub-G1 population at 24 h.
Induced 70% of cells in apoptotic sub-G1 population at 48 h.
- Detection of Apoptosis
- TUNEL staining for apoptotic DNA fragmentation
- LPS-Induced Endotoxemia/Systemic Inflammation
- Annexin V plus membrane-impermeant dye apoptosis staining
- ROS/oxidative-stress fluorescent staining
- Autophagy
- Apoptosis Solutions
- Lysosome and acidic-vesicle live-cell staining
- Mitophagy Solutions
- Macroautophagy Solutions
- Cell Viability Determination by MTT Colorimetric Assay


Chemical Information
-
Appearance Solid
-
분자량 1012.14
-
화학식 C50H64F3N7O10S
-
Color White to light yellow
-
SMILES
O=C(N(C[C@@H]1O)[C@@H](C1)C(NCC2=CC=C(C(SC=N3)=C3C)C=C2)=O)[C@H](C(C)(C)C)NC(COCCCCCCCCCOCC(NC(C=C4)=CC=C4C(NC(C=CC=C5)=C5N)=O)=O)=O.OC(C(F)(F)F)=O
-
선적
Room temperature in continental US; may vary elsewhere.
-
보관
-20°C, protect from light, stored under nitrogen
* In solvent : -80°C, 6 months; -20°C, 1 month (protect from light, stored under nitrogen)


Publications (1)
-
Journal Impact Factor
-
Most Recent
-
Int J Biochem Cell Biol
PROTAC-mediated degradation of Class I HDACs by JPS016 alleviates septic cardiomyopathy via mitophagy-driven exopher formation and mitochondrial quality control. [Abstract]2026 Mar:192:106910. PMID: 41687730


용액&용해도
In Vitro:
DMSO : ≥ 100 mg/mL (98.80 mM; Hygroscopic DMSO has a significant impact on the solubility of product, please use newly opened DMSO)
* "≥" means soluble, but saturation unknown.
Please refer to the solubility information to select the appropriate solvent. Once prepared, please aliquot and store the solution to prevent product inactivation from repeated freeze-thaw cycles.
Storage method and period of stock solution: -80°C, 6 months; -20°C, 1 month (protect from light, stored under nitrogen). When stored at -80°C, please use it within 6 months. When stored at -20°C, please use it within 1 month.
Please refer to the solubility information to select the appropriate solvent. Once prepared, please aliquot and store the solution to prevent product inactivation from repeated freeze-thaw cycles.
Storage method and period of stock solution: -80°C, 6 months; -20°C, 1 month (protect from light, stored under nitrogen). When stored at -80°C, please use it within 6 months. When stored at -20°C, please use it within 1 month.
Concentration (start) × Volume (start) = Concentration (final) × Volume (final)


순도&문서
-
Data Sheet (277 KB)
-
SDS (252 KB)
- English - EN (252 KB)
- Français - FR (252 KB)
- Deutsch - DE (252 KB)
- Norwegian - NO (252 KB)
- Español - ES (252 KB)
- Swedish - SV (252 KB)
- Italian - IT (252 KB)
- Korean - KR (252 KB)
- Portuguese - PT (252 KB)
-
Handling Instructions (2659 KB)
References
[1]. Smalley JP, et al. Optimization of Class I Histone Deacetylase PROTACs Reveals that HDAC1/2 Degradation is Critical to Induce Apoptosis and Cell Arrest in Cancer Cells. J Med Chem. 2022;65(7):5642-5659. [Content Brief]
[2]. Li Z, et al. PROTAC-mediated degradation of Class I HDACs by JPS016 alleviates septic cardiomyopathy via mitophagy-driven exopher formation and mitochondrial quality control. Int J Biochem Cell Biol. 2026;192:106910. [Content Brief]


Complete Stock Solution Preparation Table
Please refer to the solubility information to select the appropriate solvent. Once prepared, please aliquot and store the solution to prevent product inactivation from repeated freeze-thaw cycles.
Storage method and period of stock solution: -80°C, 6 months; -20°C, 1 month (protect from light, stored under nitrogen). When stored at -80°C, please use it within 6 months. When stored at -20°C, please use it within 1 month.
| Optional Solvent | Concentration Solvent Mass | 1 mg | 5 mg | 10 mg | 25 mg |
|---|---|---|---|---|---|
| DMSO | 1 mM | 0.9880 mL | 4.9400 mL | 9.8801 mL | 24.7001 mL |
| 5 mM | 0.1976 mL | 0.9880 mL | 1.9760 mL | 4.9400 mL | |
| 10 mM | 0.0988 mL | 0.4940 mL | 0.9880 mL | 2.4700 mL | |
| 15 mM | 0.0659 mL | 0.3293 mL | 0.6587 mL | 1.6467 mL | |
| 20 mM | 0.0494 mL | 0.2470 mL | 0.4940 mL | 1.2350 mL | |
| 25 mM | 0.0395 mL | 0.1976 mL | 0.3952 mL | 0.9880 mL | |
| 30 mM | 0.0329 mL | 0.1647 mL | 0.3293 mL | 0.8233 mL | |
| 40 mM | 0.0247 mL | 0.1235 mL | 0.2470 mL | 0.6175 mL | |
| 50 mM | 0.0198 mL | 0.0988 mL | 0.1976 mL | 0.4940 mL | |
| 60 mM | 0.0165 mL | 0.0823 mL | 0.1647 mL | 0.4117 mL | |
| 80 mM | 0.0124 mL | 0.0618 mL | 0.1235 mL | 0.3088 mL |


JPS016 TFA Related Classifications
HY-145816A Related Classifications
 Powered by Bioz