



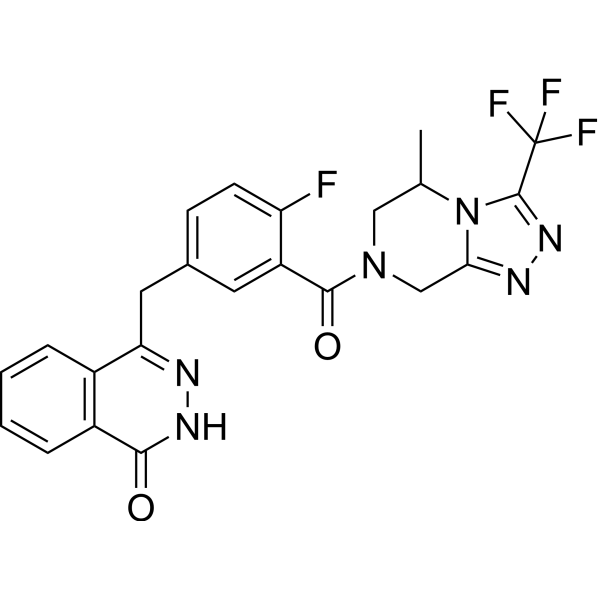
Simmiparib

Based on 1 Customer Validation
Simmiparib is a highly potent and orally active PARP1 and PARP2 inhibitor with IC50 values of 1.75 nM and 0.22 nM, respectively. Simmiparib has more potent PARP1/2 inhibition than its parent Olaparib (HY-10162). Simmiparib induces DNA double-strand breaks (DSB) accumulation and G2/M arrest in homologous recombination repair (HR)-deficient cells, thereby inducing apoptosis. Simmiparib exhibits remarkable anticancer activities in cells and nude mice bearing xenografts.
For research use only. We do not sell to patients.
- Purity : 99.01%
- CAS No.: 1551355-46-4
- Formula: C23H18F4N6O2
- Molecular Weight:486.42
-
Storage:Powder -20°C, 3 years , 4°C, 2 years ; In solvent -80°C, 6 months , -20°C, 1 month

To place orders, for customer services and technical support, please contact: MedChemExpress USA
Tel: 609-228-6898 E-mail: [email protected] [email protected]


-
 Biological Activity
-
Chemical Information
-
Solvent & Solubility
- Protocols
- Purity & Documentation
- References
-
 Help & FAQs




Biological Activity
Description
IC50 & Target
[1]|
PARP1 0.74 nM (IC50) |
PARP2 0.22 nM (IC50) |
Cellular Effect
|
Cell Line

|
Type | Value | Description | References |
|---|---|---|---|---|
| MDA-MB-436 | IC50 |
1.3 nM
Compound: 9
|
Antiproliferative activity against human MDA-MB-436 BRCA1-/- cells assessed as inhibition of cell growth incubated for 7 days by CCK-8 assay
Antiproliferative activity against human MDA-MB-436 BRCA1-/- cells assessed as inhibition of cell growth incubated for 7 days by CCK-8 assay
|
[PMID: 37567056] |
In Vitro
Simmiparib (0-10 μM; 3 days) exhibits anti-proliferative activity against various cancer cells[1].
Simmiparib (0-10 μM; 48 h) induces typical G2/M arrest in Capan-1 cells[1].
Simmiparib (0.1-2 μM; 24 h) induces apoptosis in MDA-MB-436 and V-C8 (BRCA2-/-) cells, and increases dose-dependently the levels of γH2AX[1].
Simmiparib (1-10 μM; 48 h or 72 h) increases the phosphorylation levels of Chk1 and Chk2 and the protein levels of p-Cyclin B1 (S147), Cyclin B1, p-CDK1 (Y15) and CDK1[1].
MedChemExpress (MCE) has not independently confirmed the accuracy of these methods. They are for reference only. Further protocols information, click here.
-
Cell Line:Various cancer cells harboring deficient BRCA1, BRCA2, PTEN and EWS-FLI1
-
Concentration:0-10 μM
-
Incubation Time:3 days
-
Result:Exhibited anti-proliferative activity against MDA-MB-436 (BRCA1-/-), RD-ES (EWS-FLI1), DoTc2-4510 (BRCA2-/-), Capan-1 (BRCA2-/-) and U251 (PTEN-/-) with IC50s of 0.2 nM, 4.6 nM, 20 nM, 21 nM and 36 nM, respectively.
-
Cell Line:Capan-1 cells
-
Concentration:0, 1, 3 and 10 μM
-
Incubation Time:48 h
-
Result:Induced typical G2/M arrest in a concentration-dependent manner.
-
Cell Line:MDA-MB-436
-
Concentration:0.1 and 1 μM
-
Incubation Time:24 h
-
Result:Led to 39.64% and 42.98% apoptosis at 0.1 and 1 μM, respectively.
Increased dose-dependently the levels of γH2AX.
-
Cell Line:V-C8 (BRCA2-/-)
-
Concentration:0.5 and 2 μM
-
Incubation Time:24 h
-
Result:Caused more than 57% apoptosis.
-
Cell Line:Capan-1
-
Concentration:1 and 10 μM
-
Incubation Time:48 h or 72 h
-
Result:Increased the phosphorylation levels of Chk1 and Chk2 but did not change the levels of the corresponding total proteins.
Increased the protein levels of p-Cyclin B1 (S147), Cyclin B1, p-CDK1 (Y15) and CDK1.
In Vivo
Simmiparib (10 and 50 mg/kg; p.o.; qd, for 42 days) inhibits the growth of BRCA1-mutated breast cancer in xenograft mice model[1].
MedChemExpress (MCE) has not independently confirmed the accuracy of these methods. They are for reference only.
-
Animal Model:Female BALB/cA nude mice (Subcutaneously injected with BRCA2-/- V-C8 cells and BRCA2-/- MDA-MB-436 cells)[1]
-
Dosage:2, 4 and 8 mg/kg
-
Administration:p.o.; qd, for 14 days
-
Result:Apparently inhibited the growth of the V-C8 tumor with an inhibition rate of 74.53% at 8 mg/kg.
Suppressed the growth of the BRCA1-deficient MDA-MB-436 xenografts in a dose-dependent manner with its average inhibition rates of 64.93, 82.98 and 85.79% at 2, 4 and 8 mg/kg.
Did not cause significant loss of body weight.
-
Animal Model:Female BALB/cA nude mice (Subcutaneously injected with cancer cells derived from BRCA1-mutated BR-05-0028 breast cancer tissue)[1]
-
Dosage:10 and 50 mg/kg
-
Administration:p.o.; qd, for 42 days
-
Result:Elicited dose-dependent growth inhibition with the inhibition rate of 76.73% and 93.82% at 10 mg/kg and 50 mg/kg, respectively.
Clinical Trial
| NCT Number | Sponsor | Condition | Start Date |
Phase
|
|---|---|---|---|---|
| NCT01329991 | Plexxikon| | 2011-05 | PHASE1 |


Chemical Information
-
CAS No. 1551355-46-4
-
Appearance Solid
-
Molecular Weight 486.42
-
Formula C23H18F4N6O2
-
Color White to off-white
-
SMILES
O=C1NN=C(CC2=CC=C(F)C(C(N3CC4=NN=C(C(F)(F)F)N4C(C)C3)=O)=C2)C5=C1C=CC=C5
-
Shipping
Room temperature in continental US; may vary elsewhere.
-
Storage
Powder -20°C 3 years 4°C 2 years In solvent -80°C 6 months -20°C 1 month


Solvent & Solubility
In Vitro:
DMSO : 100 mg/mL (205.58 mM; ultrasonic and warming and heat to 60°C; Hygroscopic DMSO has a significant impact on the solubility of product, please use newly opened DMSO)
Please refer to the solubility information to select the appropriate solvent. Once prepared, please aliquot and store the solution to prevent product inactivation from repeated freeze-thaw cycles.
Storage method and period of stock solution: -80°C, 6 months; -20°C, 1 month. When stored at -80°C, please use it within 6 months. When stored at -20°C, please use it within 1 month.
Please refer to the solubility information to select the appropriate solvent. Once prepared, please aliquot and store the solution to prevent product inactivation from repeated freeze-thaw cycles.
Storage method and period of stock solution: -80°C, 6 months; -20°C, 1 month. When stored at -80°C, please use it within 6 months. When stored at -20°C, please use it within 1 month.
Concentration (start) × Volume (start) = Concentration (final) × Volume (final)

Protocols
-
CRISPR-Cas9 HDR knock-in/precise editing
CRISPR-Cas9 HDR knock-in uses a guide RNA to direct Cas9 to a genomic target adjacent to a PAM, where Cas9 creates a double-strand break; if a donor DNA template with homology to the cut region is present, cellular HDR can copy the donor sequence into the genome, producing a precise substitution, tag, reporter, or insertion rather than an indel. The readout is the fraction of alleles or cells carrying the intended donor-derived edit, measured by junction PCR, restriction-fragment analysis, Sanger sequencing, amplicon deep sequencing, flow cytometry for reporter knock-in, or clone genotyping; NHEJ indels and partial or non-HDR insertions are measured in parallel because they compete with or confound precise HDR outcomes.
-
Detection of Apoptosis
Apoptosis, also called programmed cell death, is generally characterized by distinct morphological characteristics.
-
TUNEL staining for apoptotic DNA fragmentation
TUNEL staining detects DNA strand breaks by using terminal deoxynucleotidyl transferase to add labeled nucleotides to exposed 3′-OH DNA termini, generating either microscopic staining in fixed cells or tissue sections, or fluorescence/cytometric signal in cell suspensions. TUNEL positivity reflects DNA fragmentation but should not be interpreted alone as definitive apoptosis, because TUNEL can also label necrotic, autolytic, mechanically damaged, or DNA-repair-associated DNA breaks.
-
Flow cytometric DNA-content cell-cycle staining
Flow cytometric DNA-content cell-cycle staining measures the fluorescence intensity of DNA-bound fluorochromes in single cells or nuclei to estimate DNA content distributions, allowing assignment of populations to G0/G1, S, and G2/M phases by DNA histogram deconvolution. Propidium iodide (PI) intercalates into DNA, and PI fluorescence is proportional to cellular DNA content when staining is performed under conditions that make DNA accessible and minimize non-DNA signal. Cells with G2/M DNA content are expected to show approximately twice the fluorescence intensity of G0/G1 cells, while S-phase cells occupy intermediate fluorescence values. PI-based DNA-content analysis can also detect cells with fractional DNA content, often reported as sub-G1, when DNA fragmentation and extraction during staining reduce retained DNA signal in apoptotic cells. DAPI is an alternative DNA fluorochrome for univariate DNA-content analysis, while bivariate approaches combining DNA content with proliferation
-
Annexin V plus membrane-impermeant dye apoptosis staining
Annexin V-based apoptosis assays rely on the detection of phosphatidylserine (PS) externalization from the inner leaflet of the plasma membrane to the outer leaflet, an early biochemical hallmark of apoptosis. Fluorescently labeled Annexin V binds PS in a calcium-dependent manner, enabling identification of early apoptotic cells by flow cytometry or fluorescence microscopy. When combined with a membrane-impermeant DNA-binding dye (e. g. , propidium iodide), this approach allows discrimination between viable (Annexin V−/dye−), early apoptotic (Annexin V+/dye−), and late apoptotic or necrotic (Annexin V+/dye+) cell populations by assessing membrane integrity and PS exposure.
-
Apoptosis Solutions
Apoptosis is a regulated, generally non-lytic cell-death pathway that removes unwanted, damaged, infected, or abnormal cells through coordinated morphological changes, caspase activation, DNA fragmentation, and membrane remodeling. The intrinsic apoptosis pathway is controlled mainly by mitochondrial outer membrane permeabilization, BCL-2 family proteins, cytochrome c release, apoptosome formation, caspase-9 activation, and downstream executioner caspase-3/7 activation. The extrinsic apoptosis pathway is initiated by death receptors such as Fas, TNFR, and TRAIL receptors, which recruit adaptor proteins and activate caspase-8 before engaging executioner caspases or mitochondrial amplification through BID cleavage. Apoptosis is linked to many phenotypes, including cancer cell killing, tissue homeostasis, immune regulation, neurodegeneration, infection response, and treatment-induced cytotoxicity; unresolved questions include how apoptosis interacts with necroptosis, pyroptosis, ferroptos
-
Protocol for Cell Cycle
Cell-cycle analysis by flow cytometry measures DNA content in single cells to estimate the fraction of cells in G0/G1, S, and G2/M phases. Propidium iodide intercalates into DNA, and after RNA removal with RNase, fluorescence intensity reflects cellular DNA content: 2N cells are assigned to G0/G1, cells between 2N and 4N to S phase, and 4N cells to G2/M. DNA-content analysis alone cannot reliably separate G0 from G1 or G2 from M. Ki-67 can distinguish quiescent G0 cells from cycling cells, EdU or BrdU incorporation marks active DNA synthesis in S phase, and phospho-histone H3 staining identifies mitotic cells within the 4N population.


Purity & Documentation
-
Data Sheet (280 KB)
-
SDS (251 KB)
- English - EN (251 KB)
- Français - FR (251 KB)
- Deutsch - DE (251 KB)
- Norwegian - NO (251 KB)
- Español - ES (251 KB)
- Swedish - SV (251 KB)
- Italian - IT (251 KB)
- Korean - KR (251 KB)
- Portuguese - PT (251 KB)
-
Handling Instructions (2659 KB)
References


Complete Stock Solution Preparation Table
Please refer to the solubility information to select the appropriate solvent. Once prepared, please aliquot and store the solution to prevent product inactivation from repeated freeze-thaw cycles.
Storage method and period of stock solution: -80°C, 6 months; -20°C, 1 month. When stored at -80°C, please use it within 6 months. When stored at -20°C, please use it within 1 month.
| Optional Solvent | Concentration Solvent Mass | 1 mg | 5 mg | 10 mg | 25 mg |
|---|---|---|---|---|---|
| DMSO | 1 mM | 2.0558 mL | 10.2792 mL | 20.5584 mL | 51.3959 mL |
| 5 mM | 0.4112 mL | 2.0558 mL | 4.1117 mL | 10.2792 mL | |
| 10 mM | 0.2056 mL | 1.0279 mL | 2.0558 mL | 5.1396 mL | |
| 15 mM | 0.1371 mL | 0.6853 mL | 1.3706 mL | 3.4264 mL | |
| 20 mM | 0.1028 mL | 0.5140 mL | 1.0279 mL | 2.5698 mL | |
| 25 mM | 0.0822 mL | 0.4112 mL | 0.8223 mL | 2.0558 mL | |
| 30 mM | 0.0685 mL | 0.3426 mL | 0.6853 mL | 1.7132 mL | |
| 40 mM | 0.0514 mL | 0.2570 mL | 0.5140 mL | 1.2849 mL | |
| 50 mM | 0.0411 mL | 0.2056 mL | 0.4112 mL | 1.0279 mL | |
| 60 mM | 0.0343 mL | 0.1713 mL | 0.3426 mL | 0.8566 mL | |
| 80 mM | 0.0257 mL | 0.1285 mL | 0.2570 mL | 0.6424 mL | |
| 100 mM | 0.0206 mL | 0.1028 mL | 0.2056 mL | 0.5140 mL |


Simmiparib Related Classifications
HY-115552 Related Classifications
 Powered by Bioz