



Triphenyl phosphate

Based on 1 Customer Validation
Triphenyl phosphate is an orally active, blood-brain barrier-permeable aryl organophosphate flame retardant and endocrine disruptor. Triphenyl phosphate disrupts mitochondrial dynamic balance through oxidative stress, induces excessive mitophagy and apoptosis, and ultimately leads to myocardial fibrosis. In the brain, Triphenyl phosphate activates the NF-κB inflammatory pathway by disrupting the gut microbiota, alters tryptophan metabolism and elevates neurotoxins, thereby inducing anxiety- and depression-like behaviors. In the skeletal and reproductive systems, Triphenyl phosphate inhibits osteoblast differentiation and induces germ cell apoptosis by suppressing the MAPK/ERK pathway and activating the JNK signal, respectively. In adipose and placental tissues, Triphenyl phosphate promotes lipid accumulation by activating the PI3K/AKT-PPARγ axis, and disrupts placental metabolism via the MAOA/ROS/NF-κB cascade, impairing neurodevelopment of offspring.
For research use only. We do not sell to patients.
- Purity : 98.0%
- CAS No.: 115-86-6
- Formula: C18H15O4P
- Molecular Weight:326.28
-
Storage:
Store at room temperature 3 years.
In solvent -80°C, 2 years , -20°C, 1 year


To place orders, for customer services and technical support, please contact: MedChemExpress USA
Tel: 609-228-6898 E-mail: [email protected] [email protected]


-
 Biological Activity
-
Chemical Information
-
Solvent & Solubility
- Protocols
- Purity & Documentation
- References
-
 Help & FAQs


-

HY-107859
Tris(2-chloroethyl) phosphateFlame-retardant Plasticizer -

HY-W016414
Triethyl phosphateSmooth Muscle Relaxant -
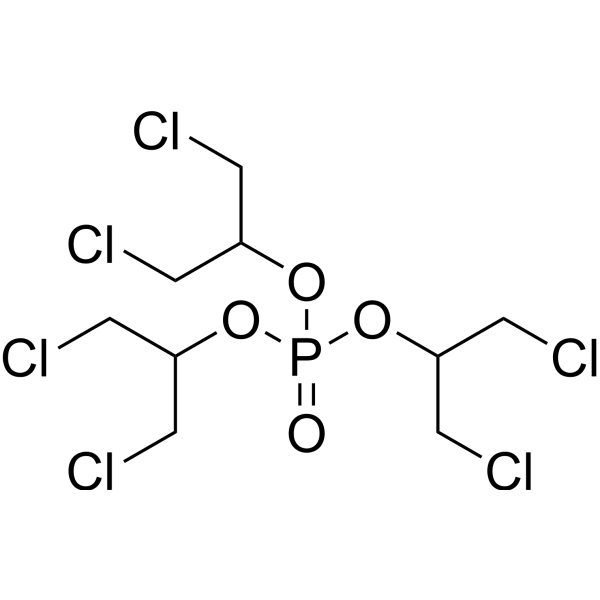
HY-108712
TDCPPFlame Retardant -

HY-W008954
Tris(2-ethylhexyl) phosphateOrganophosphorus Flame Retardant Analog -

HY-W023144
Tris(1-chloro-2-propyl) phosphateApoptotic Inducer -

HY-W011086
Tri-O-tolyl phosphateBiochemical Reagent -
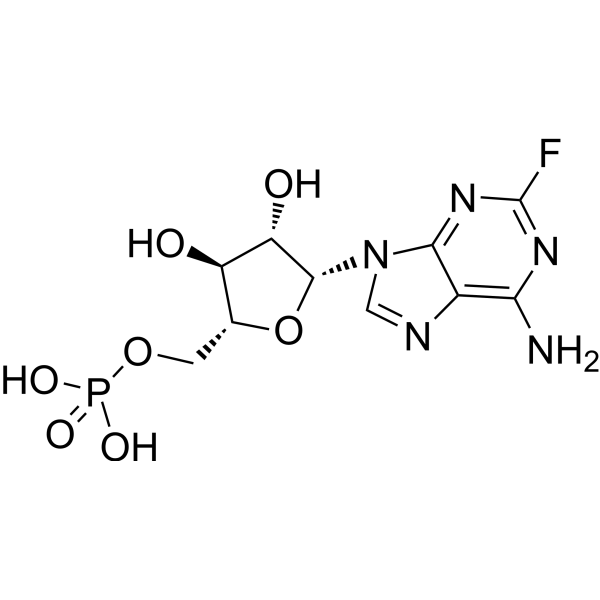
HY-B0028
Fludarabine phosphateApoptosis Inducer -

HY-W016414R
Triethyl phosphate (Standard) -
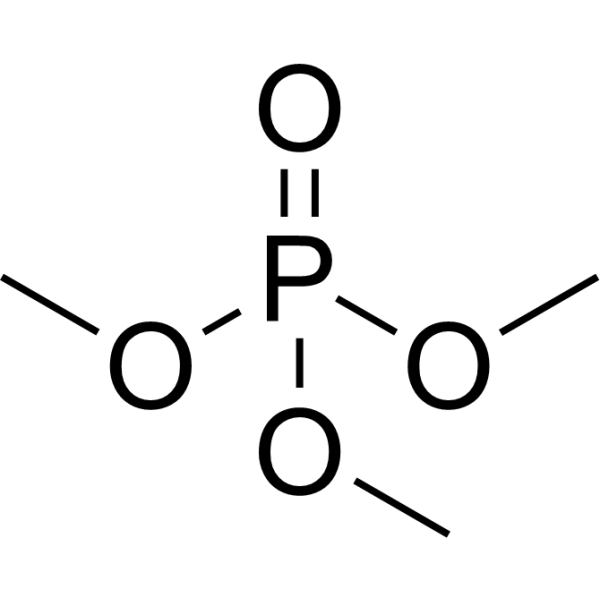
HY-A0108A
Trimethyl phosphateBiochemical Reagent -

HY-135604
Dibutyl phosphateOrganophosphate esters metabolite -
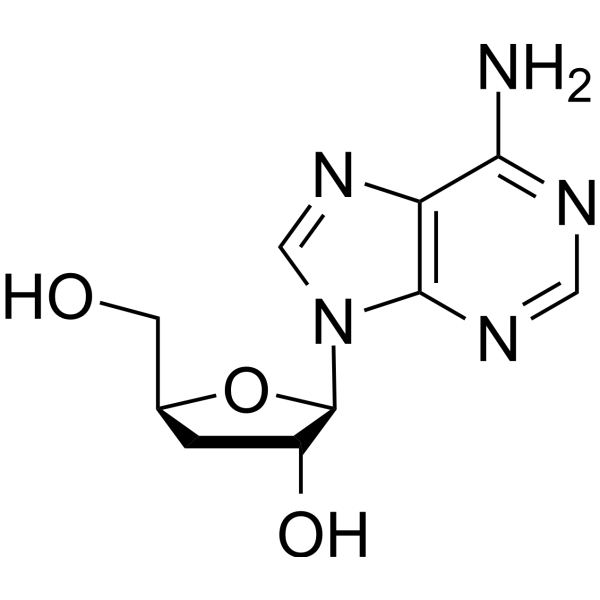
HY-N0262
CordycepinBacterial Inhibitor -

HY-W011086R
Tri-O-tolyl phosphate (Standard)Biochemical Reagent


Biological Activity
Description
IC50 & Target
|
IL-6 |
In Vitro
Triphenyl phosphate (10-100 μM; 48 h) inhibits the migration of MC3T3-E1 osteoblasts in a dose-dependent manner[1].
Triphenyl phosphate (0-100 μM; 24-120 h) reduces the proliferation capacity and survival rate of MC3T3-E1 osteoblasts in a dose- and time-dependent manner[1].
Triphenyl phosphate (10-40 μM; 24 h) dose-dependently inhibits the invasion and migration of MC3T3-E1 osteoblasts[1].
Triphenyl phosphate (10-40 μM; 48 h) inhibits the MEK/ERK axis of the MAPK signaling pathway in MC3T3-E1 osteoblasts and alters the expression of EMT-related proteins, and these effects are reversed by MEK/ERK activation[1].
Triphenyl phosphate (40 μM; 48 h) downregulates the expression of NR3C1, IGF1R, MAP3K1, BRAF, WNK4 and CNR2 genes in MC3T3-E1 osteoblasts[1].
Triphenyl phosphate (50-150 μM) significantly increases the intracellular ROS level in H9c2 cardiomyocytes[2].
Triphenyl phosphate (150 μM) reduces the fluorescence intensity of MitoTracker Red in H9c2 cardiomyocytes, indicating impaired mitochondrial morphology[2].
Triphenyl phosphate (150 μM) increases the fluorescence intensity of LysoTracker Green in H9c2 cardiomyocytes, indicating altered lysosomal activity[2].
Triphenyl phosphate (150 μM) significantly reduces the proportion of cells with high mitochondrial membrane potential in H9c2 cardiomyocytes[2].
Triphenyl phosphate (150 μM) upregulates the expression of mitophagy-related proteins Parkin, Pink1, and LC3II/I in H9c2 cardiomyocytes[2].
Triphenyl phosphate (150 μM) significantly increases the apoptosis rate of H9c2 cardiomyocytes[2].
Triphenyl phosphate (3.3-33 μM; 48 h) interferes with tryptophan metabolism in human trophoblast JEG-3 cells by activating NF-κB via MAOA-mediated oxidative stress, and the relevant effect is observable even at a concentration as low as 3.3 μM after 48 h of exposure[3].
Triphenyl phosphate (10 μM; 10 days) induces significant triglyceride accumulation and lipid droplet formation in differentiating 3T3-L1 preadipocytes[4].
Triphenyl phosphate (0.1-10 μM; 10 days) promotes adipogenic differentiation of 3T3-L1 preadipocytes. Specifically, the 10 μM concentration significantly upregulates the expression of key adipogenic genes and proteins, and disrupts lipid homeostasis by enhancing lipogenesis and lipolysis[4].
Triphenyl phosphate (10 μM; 10 days) induces lipid metabolism disorder in differentiating 3T3-L1 preadipocytes, alters the levels of multiple lipid species, and disrupts key metabolic pathways[4].
Triphenyl phosphate (10 μM; 10 days) alters global gene expression in differentiating 3T3-L1 preadipocytes, activates the PPAR signaling pathway and fatty acid metabolism, thereby promoting lipid accumulation and adipocyte differentiation[4].
Triphenyl phosphate (10 μM; 10 days) activates the PI3K/AKT signaling pathway in differentiating 3T3-L1 preadipocytes, and this activation is essential for TPHP-induced lipid accumulation and adipogenic differentiation, as inhibition with LY294002 reverses these effects[4].
MedChemExpress (MCE) has not independently confirmed the accuracy of these methods. They are for reference only.
-
Cell Line:murine pre-osteoblastic MC3T3-E1 cells
-
Concentration:10, 25, 50, 100 μM
-
Incubation Time:48 h
-
Result:Inhibited MC3T3-E1 cell migration in a concentration-dependent manner, with significant reductions in migration rate observed at 10, 25, 50, and 100 μM compared to control.
-
Cell Line:murine pre-osteoblastic MC3T3-E1 cells
-
Concentration:10, 20, 40 μM
-
Incubation Time:24 h
-
Result:Significantly suppressed MC3T3-E1 cell invasion and migration in a concentration-dependent manner, with significant reductions in relative cell count observed at 10, 20, and 40 μM compared to control.
-
Cell Line:murine pre-osteoblastic MC3T3-E1 cells
-
Concentration:10, 20, 40 μM (single treatment); 40 μM (co-treatment with 1 μM C16-PAF (HY-108635) or 10 μM MEK-IN-6 (HY-153445))
-
Incubation Time:48 h
-
Result:Significantly decreased phosphorylation levels of p-MEK and p-ERK1/2 (with no change to p-P38 or p-JNK), upregulated E-Cadherin expression, and downregulated N-Cadherin expression.
Reversed these changes when co-treated with the MEK/ERK activator C16-PAF, restoring p-MEK and p-ERK1/2 phosphorylation and normalizing E-Cadherin and N-Cadherin levels.
Did not reverse the effects when co-treated with MEK inhibitor MEK-IN-6.
-
Cell Line:murine pre-osteoblastic MC3T3-E1 cells
-
Concentration:40 μM
-
Incubation Time:48 h
-
Result:Significantly downregulated the mRNA expression levels of NR3C1, IGF1R, MAP3K1, BRAF, WNK4, and CNR2 compared to the control group.
In Vivo
Triphenyl phosphate (0.5-2 mg/kg; p.o.; daily; from gestational day 0 to gestational day 12) induces placental oxidative stress, activates inflammatory cytokines, and disrupts tryptophan metabolism in pregnant C57BL/6 mice[3].
Triphenyl phosphate (1-150 mg/kg; p.o.; once daily; for consecutive 60 days) induces sex-specific lipid metabolism disorders, and promotes obesity in male mice by dose-dependently increasing the inguinal adipose tissue coefficient, promoting adipocyte hypertrophy, and upregulating adipogenesis- and lipid metabolism-related genes, but exerts no significant effect on adipose tissue morphology in female mice[4].
Triphenyl phosphate (1-500 μg/L; exposed in potassium solution; 72 h) induces concentration-dependent reproductive toxicity in *Caenorhabditis elegans* by disrupting the JNK signaling pathway[5].
Triphenyl phosphate (0.89-9.19 μg/kg; p.o.; once daily; 28 weeks) induces significant anxiety-like and depression-like behaviors in female BALB/c mice by disrupting the gut-brain axis, including intestinal dysbiosis, systemic oxidative stress and inflammatory responses, as well as metabolic and signaling pathway disorders in the prefrontal cortex[6].
MedChemExpress (MCE) has not independently confirmed the accuracy of these methods. They are for reference only.
-
Animal Model:C57BL/6 J (adult male, 20-25 g)[2]
-
Dosage:5 mg/kg; 50 mg/kg
-
Administration:p.o.; daily; 30 days
-
Result:Induced disordered myocardial cell arrangement and increased eosinophilic cardiomyocytes at 50 mg/kg.
Elevated serum creatine kinase isoenzymes (CK-MB) and lactate dehydrogenase (LDH) levels significantly at 50 mg/kg.
Increased heart malondialdehyde (MDA) levels, while decreased superoxide dismutase (SOD) and serum glutathione peroxidase (GSH-Px) activities at 50 mg/kg.
Caused irregular cardiomyocyte mitochondrial shapes and disordered cristae at 50 mg/kg.
Decreased protein expression of mitochondrial fusion/fission factors (Mfn1, Mfn2, Opa1, Drp1, Fis1) significantly at 50 mg/kg.
Induced autophagosomes in cardiomyocytes, with increased protein expression of Parkin, Pink1, and LC3II/I at 50 mg/kg.
Increased TUNEL-positive apoptotic cardiomyocytes at 50 mg/kg.
Increased protein expression of Bax, CytC, and Cleaved-Caspase 3, decreased Bcl-2 expression, and increased Cleaved-Caspase 9 expression at 50 mg/kg.
Increased cardiac collagen deposition, with increased protein expression of Wnt, β-catenin, p-β-catenin, collagen I, collagen III, CTGF, and fibronectin at 50 mg/kg.
Showed no significant changes in myocardial histopathology, serum CK-MB/LDH levels, oxidative stress markers, mitochondrial structure/factor expression, or cardiac fibrosis markers at 5 mg/kg.
Increased Cleaved-Caspase 9 protein expression significantly, with no change in TUNEL-positive apoptotic cells at 5 mg/kg.
-
Animal Model:C57BL/6 (6-8 weeks old, female, pregnant)[3]
-
Dosage:0.5 mg/kg; 1 mg/kg; 2 mg/kg
-
Administration:p.o.; daily; E0 to E12
-
Result:Increased placental GSH to ~100 μmol/g, MDA to ~4 nmol/mgprot, and SOD vitality to ~150 U/mgprot at 2 mg/kg.
Increased placental MDA to ~3 nmol/mgprot and decreased SOD vitality to ~100 U/mgprot at 1 mg/kg.
Increased placental NFκB, IL6, MAOA, and KYNU gene expression, and decreased TPH1 and DDC gene expression at 0.5 mg/kg.
Increased placental NFκB, TNFα, IL6, MAOA, KYNU, and IDO1 gene expression, and decreased TPH1 and DDC gene expression at 1 mg/kg.
Increased placental NFκB, TNFα, IL6, MAOA, KMO, and KYNU gene expression, and decreased TPH1 and DDC gene expression at 2 mg/kg.
Increased placental NFκB, IDO1, and MAOA protein expression, and decreased TPH1 protein expression at 0.5 mg/kg.
Increased placental NFκB, TNFα, IL6, IDO1, TDO2, and MAOA protein expression, and decreased TPH1 protein expression at 1 mg/kg.
Increased placental NFκB, TNFα, IL6, IDO1, TDO2, and MAOA protein expression, and decreased TPH1 protein expression at 2 mg/kg.
Decreased placental tryptophan to ~25 μg/g FW and 5-HTP to ~0.015 μg/g FW at 1 mg/kg.
Increased placental serotonin to ~0.15 μg/g FW, 5-HIAA to ~0.3 μg/g FW, and KYN to ~25 μg/g FW at 1 mg/kg.
Showed a trend toward increased 3-HK levels at 1 mg/kg.
-
Animal Model:BALB/c (male, female, 3 weeks old at study start, oral exposure to triphenyl phosphate for 60 days to induce lipid metabolism disorder)[4]
-
Dosage:1 mg/kg/day; 10 mg/kg/day; 150 mg/kg/day
-
Administration:p.o.; daily; 60 days
-
Result:Increased inguinal adipose tissue coefficient in a dose-dependent manner in male mice.
Induced significant adipocyte hypertrophy across all doses in male mice, with mean adipocyte area significantly larger than control.
Increased serum total cholesterol (TC) and high-density lipoprotein cholesterol (HDL-C) levels in male mice treated with 150 mg/kg/day, while all doses reduced serum triglyceride (TG) levels in male mice.
Upregulated PPARγ mRNA expression in a dose-dependent manner in male mice.
Upregulated chemerin mRNA expression in male mice treated with 150 mg/kg/day.
Upregulated lipid synthesis-related genes (Pck1, PDK, ChERBP) and lipolytic genes (Lipe, MGL) in male mice.
Showed an upward trend in serum TG, TC, HDL-C, and low-density lipoprotein cholesterol (LDL-C) levels in female mice treated with 150 mg/kg/day, with no significant changes in inguinal adipose tissue coefficient or adipocyte size compared to control.
-
Animal Model:wild-type Bristol N2; MT1079/egl-15 (n484) X; VC1089/mkk-4 (ok1545) X; VC822/kgb-2 (gk361) IV; JT366/vhp-1(sa366) II (synchronized L1-stage larvae)[5]
-
Dosage:1 μg/L, 10 μg/L, 100 μg/L, 500 μg/L
-
Administration:exposure in K+ solution; daily feeding; 72 hours
-
Result:Reduced mean lifespan by 1.65% (1 μg/L), 12.47% (10 μg/L), 13.3% (100 μg/L), and 25.22% (500 μg/L) relative to controls.
Determined 10-day LC50 as 575.47 μg/L (95% CI: 450.58-819.39 μg/L).
Reduced germ cell counts in the mitotic zone, transition zone, and meiotic prophase by 37.5%/41.0% (1 μg/L/500 μg/L), 30.2%/28.9%, and 36.9%/38.5% respectively.
Increased gonadal apoptotic cell count by 17.2% (1 μg/L), 77.6% (10 μg/L), 133.2% (100 μg/L), and 138.9% (500 μg/L) relative to controls.
Reduced uterine embryo count by 14.2% (1 μg/L), 18.2% (10 μg/L), 18.1% (100 μg/L), and 21.8% (500 μg/L) relative to controls.
Reduced total progeny count by 10.66% (1 μg/L), 13.94% (10 μg/L), 15.25% (100 μg/L), and 17.39% (500 μg/L) relative to controls.
Downregulated transcript levels of egl-15, dlk-1, mkk-4, kgb-2, and vhp-1, while upregulated kgb-1 in 500 μg/L exposed wild-type worms.
Increased gonadal apoptotic cell counts significantly higher than in exposed wild-type worms, and reduced uterine embryo counts and total progeny counts significantly lower than in exposed wild-type worms in mutant strains exposed to 1 μg/L or 500 μg/L TPHP.
-
Animal Model:BALB/c (female, 3 weeks old, 15−18 g)[6]
-
Dosage:0.89 μg/kg/day; 9.19 μg/kg/day
-
Administration:p.o.; daily; 28 weeks
-
Result:Reduced distance traveled in the central area by 67.8%, reduced time spent moving in the central area by 64.1%, significantly reduced upright behavior count, and significantly reduced grooming behavior count (9.19 μg/kg/day, open field test).
Reduced open arm entry frequency by 2.1-fold, reduced open arm retention time by 84.1% (9.19 μg/kg/day, elevated plus maze test).
Reduced sucrose preference index by 40.1% (9.19 μg/kg/day, sucrose preference test).
Reduced uric acid levels, reduced 5-hydroxytryptophan levels, elevated quinolinic acid levels, elevated glutamate levels, significantly elevated reactive oxygen species, nitric oxide, and malondialdehyde levels, upregulated catalase and superoxide dismutase expression, and increased NF-κB p65 and pro-inflammatory factors (TNF-α, IL-1β, IL-6) (9.19 μg/kg/day, prefrontal cortex).
Decreased relative abundance of Bacteroidota, increased Firmicutes, significantly reduced relative abundance of norank_f_Muribaculaceae, Lactobacillus, Alloprevotella, Bacteroides, and g_Akkermansia, significantly increased Lachnospiraceae_NK4A136_group, significantly increased Chao1 index, and showed β-diversity compositional differences from controls (9.19 μg/kg/day, gut microbiota).
Reduced xanthine levels, elevated uric acid levels, reduced 5-hydroxytryptophan levels, and significantly reduced acetic acid, propionic acid, and butyric acid levels.
Significantly upregulated quinolinic acid and glutamate levels, significantly downregulated xanthine, 5-hydroxytryptophan, acetic acid, propionic acid, and butyric acid levels, significantly elevated reactive oxygen species, nitric oxide, malondialdehyde, TNF-α, IL-1β, IL-6, and NF-κB p65 levels, and reached a mean level of 2.09 ng/mL (9.19 μg/kg/day, serum).
Significantly reduced time spent moving in the central area and reduced upright behavior count (0.89 μg/kg/day, open field test).
Showed 1208 upregulated and 1382 downregulated genes relative to controls, altered NF-κB signaling pathway and leukocyte transendothelial migration pathways, and disrupted purine and tryptophan metabolism pathways with trends matching the high-dose group (0.89 μg/kg/day, prefrontal cortex).
Mirrored high-dose group trends but most changes were not statistically significant (0.89 μg/kg/day, gut microbiota).
Reached a mean level of 0.36 ng/mL (0.89 μg/kg/day, serum).
- Collagen: Sirius Red Staining
- Annexin V plus membrane-impermeant dye apoptosis staining
- ROS/oxidative-stress fluorescent staining
- Connective Tissue: Masson's Trichrome/Collagen Trichrome Staining
- Research Protocol for Microbiome Analysis
- Research Protocol for Inflammation-related Diseases
- Fibrosis/Collagen Morphometry
- 3T3-L1 preadipocyte-to-adipocyte differentiation
- Detection of Apoptosis
- TUNEL staining for apoptotic DNA fragmentation
- Apoptosis Solutions
- Mitophagy Solutions
- Lipid Droplets: Oil Red O/Sudan Dye Lipid Staining


Chemical Information
-
CAS No. 115-86-6
-
Appearance Solid
-
Molecular Weight 326.28
-
Formula C18H15O4P
-
Color White to off-white
-
SMILES
O=P(OC1=CC=CC=C1)(OC2=CC=CC=C2)OC3=CC=CC=C3
-
Shipping
Room temperature in continental US; may vary elsewhere.
-
Storage
Store at room temperature 3 years
In solvent -80°C 2 years -20°C 1 year


Solvent & Solubility
In Vitro:
DMSO : 100 mg/mL (306.49 mM; Need ultrasonic; Hygroscopic DMSO has a significant impact on the solubility of product, please use newly opened DMSO)
Please refer to the solubility information to select the appropriate solvent. Once prepared, please aliquot and store the solution to prevent product inactivation from repeated freeze-thaw cycles.
Storage method and period of stock solution: -80°C, 2 years; -20°C, 1 year. When stored at -80°C, please use it within 2 years. When stored at -20°C, please use it within 1 year.
Please refer to the solubility information to select the appropriate solvent. Once prepared, please aliquot and store the solution to prevent product inactivation from repeated freeze-thaw cycles.
Storage method and period of stock solution: -80°C, 2 years; -20°C, 1 year. When stored at -80°C, please use it within 2 years. When stored at -20°C, please use it within 1 year.
Concentration (start) × Volume (start) = Concentration (final) × Volume (final)
In Vivo:
Select the appropriate dissolution method based on your experimental animal and administration route.
- For the following dissolution methods, please ensure to first prepare a clear stock solution using an In Vitro approach and then sequentially add co-solvents:
- To ensure reliable experimental results, the clarified stock solution can be appropriately stored based on storage conditions. As for the working solution for In Vivo experiments, it is recommended to prepare freshly and use it on the same day.
- The percentages shown for the solvents indicate their volumetric ratio in the final prepared solution. If precipitation or phase separation occurs during preparation, heat and/or sonication can be used to aid dissolution.
Add each solvent one by one: 10% DMSO 90% (20% SBE-β-CD in Saline)
Solubility: ≥ 5 mg/mL (15.32 mM); Clear solution
This protocol yields a clear solution of ≥ 5 mg/mL (saturation unknown).
Taking 1 mL working solution as an example, add 100 μL DMSO stock solution (50.0 mg/mL) to 900 μL 20% SBE-β-CD in Saline, and mix evenly.
Preparation of 20% SBE-β-CD in Saline (4°C, storage for one week): 2 g SBE-β-CD powder is dissolved in 10 mL Saline, completely dissolve until clear.
In Vivo Dissolution Calculator
Please enter the basic information of animal experiments:
-
-
-
-
Recommended: Prepare an additional quantity of animals to account for potential losses during experiments.
Please enter your animal formula composition:
-
%DMSO +
Recommended: Keep the proportion of DMSO in working solution below 2% if your animal is weak.
-
%+
-
+%Tween-80 + +
-
%Saline +
The co-solvents required include: DMSO, . All of co-solvents are available by MedChemExpress (MCE). , Tween 80. All of co-solvents are available by MedChemExpress (MCE).
Working solution concentration: 0.22 mg/mL
Method for preparing stock solution: mg drug dissolved in μL DMSO. Stock solution concentration: mg/mL.
1. Take μL DMSO stock solution;
2. Add μL .
μL , mix evenly;
3. Then add μL Tween 80, mix evenly;
4. Then add μL
Please ensure that the stock solution in the first step is dissolved to a clear state, and add co-solvents in sequence. You can use ultrasonic heating (ultrasonic cleaner, recommended frequency 20-40 kHz), vortexing, etc. to assist dissolution.


Purity & Documentation
-
Data Sheet (315 KB)
-
SDS (761 KB)
- English - EN (761 KB)
- Français - FR (761 KB)
- Deutsch - DE (761 KB)
- Norwegian - NO (761 KB)
- Español - ES (761 KB)
- Swedish - SV (761 KB)
- Italian - IT (761 KB)
- Korean - KR (761 KB)
- Portuguese - PT (761 KB)
-
Handling Instructions (2659 KB)
References
[1]. Xu M, et al. Elucidating the mechanism of triphenyl phosphate interference in bone metabolism via network toxicology and molecular docking methodologies. Front Endocrinol (Lausanne). 2025;16:1606877. Published 2025 Jul 7. [Content Brief]
[2]. Xu F, et al. Triphenyl phosphate induces cardiotoxicity through myocardial fibrosis mediated by apoptosis and mitophagy of cardiomyocyte in mice. Environ Pollut. 2024;346:123651. [Content Brief]
[3]. Lu X, et al. Triphenyl phosphate disrupts placental tryptophan metabolism by activating MAOA/ROS/NFκB. Sci Total Environ. 2023;904:166688. [Content Brief]
[4]. Li T, et al. Triphenyl phosphate induces lipid metabolism disorder and promotes obesity through PI3K/AKT signaling pathway. Environ Int. 2025;198:109428. [Content Brief]
[5]. Shi C, et al. Triphenyl phosphate induced reproductive toxicity through the JNK signaling pathway in Caenorhabditis elegans. J Hazard Mater. 2023;446:130643. [Content Brief]
[6]. Dan A, et al. Chronic Exposure to Environmentally Relevant Doses of Triphenyl Phosphate Induces Anxiety- and Depression-Like Behaviors in Mice via the Gut-Brain Axis. Environ Sci Technol. 2025;59(27):13671-13682. [Content Brief]


Complete Stock Solution Preparation Table
Please refer to the solubility information to select the appropriate solvent. Once prepared, please aliquot and store the solution to prevent product inactivation from repeated freeze-thaw cycles.
Storage method and period of stock solution: -80°C, 2 years; -20°C, 1 year. When stored at -80°C, please use it within 2 years. When stored at -20°C, please use it within 1 year.
| Optional Solvent | Concentration Solvent Mass | 1 mg | 5 mg | 10 mg | 25 mg |
|---|---|---|---|---|---|
| DMSO | 1 mM | 3.0649 mL | 15.3243 mL | 30.6485 mL | 76.6213 mL |
| 5 mM | 0.6130 mL | 3.0649 mL | 6.1297 mL | 15.3243 mL | |
| 10 mM | 0.3065 mL | 1.5324 mL | 3.0649 mL | 7.6621 mL | |
| 15 mM | 0.2043 mL | 1.0216 mL | 2.0432 mL | 5.1081 mL | |
| 20 mM | 0.1532 mL | 0.7662 mL | 1.5324 mL | 3.8311 mL | |
| 25 mM | 0.1226 mL | 0.6130 mL | 1.2259 mL | 3.0649 mL | |
| 30 mM | 0.1022 mL | 0.5108 mL | 1.0216 mL | 2.5540 mL | |
| 40 mM | 0.0766 mL | 0.3831 mL | 0.7662 mL | 1.9155 mL | |
| 50 mM | 0.0613 mL | 0.3065 mL | 0.6130 mL | 1.5324 mL | |
| 60 mM | 0.0511 mL | 0.2554 mL | 0.5108 mL | 1.2770 mL | |
| 80 mM | 0.0383 mL | 0.1916 mL | 0.3831 mL | 0.9578 mL | |
| 100 mM | 0.0306 mL | 0.1532 mL | 0.3065 mL | 0.7662 mL |


Triphenyl phosphate Related Classifications
HY-Y1322 Related Classifications
 Powered by Bioz
Keywords