



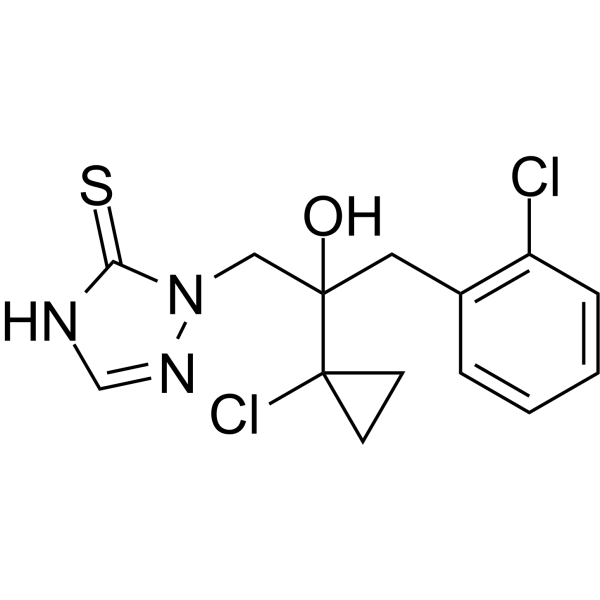
Prothioconazole

Based on 1 Customer Validation
Prothioconazole is an orally active broad-spectrum fungicide. Prothioconazole weakly inhibits CaCYP51 activity in Candida albicans, with an apparent IC50 of approximately 120 μM. Prothioconazole disrupts Microtubule stability by reducing the acetylation level of α-tubulin. Prothioconazole induces Mitochondrial dysfunction, oxidative stress, DNA damage, and Apoptosis. Prothioconazole accumulates 14-methylated sterols and depletes ergosterol in cells, culture media, plants, and animals. Prothioconazole interferes with pyruvate metabolism and glycolysis/gluconeogenesis processes in mouse liver, downregulates Fasn mRNA expression, and induces hepatotoxicity and renal metabolic disorders. Prothioconazole reduces the fertility of female mice. Prothioconazole inhibits body weight gain and increases liver/kidney indices in mice. Prothioconazole can be used in studies related to candidiasis.
For research use only. We do not sell to patients.
- Purity : 98.86%
- CAS No.: 178928-70-6
- Formula: C14H15Cl2N3OS
- Molecular Weight:344.26
-
Storage:Powder -20°C, 3 years ; In solvent -80°C, 6 months , -20°C, 1 month

To place orders, for customer services and technical support, please contact: MedChemExpress USA
Tel: 609-228-6898 E-mail: [email protected] [email protected]


-
 Biological Activity
-
Chemical Information
-
Solvent & Solubility
- Protocols
- Purity & Documentation
- References
-
 Help & FAQs



All DNA/RNA Synthesis Isoforms
More

Biological Activity
Description
IC50 & Target
[1]|
CYP51 |
In Vitro
Prothioconazole shows weak binding affinity to purified *Candida albicans* CaCYP51, with an apparent dissociation constant Kd of 6.3 μM. It generates a type I difference spectrum instead of the typical type II difference spectrum produced by azole antifungal agents[1].
Prothioconazole (100 μM) competitively inhibits the binding of Lanosterol (HY-W020033) to purified *Candida albicans* CaCYP51, increasing the apparent Ks of Lanosterol by 2.5-fold to 62.2 μM[1].
Prothioconazole (0-100 μM) weakly inhibits CaCYP51 activity of Candida albicans in a cell-free system, with an apparent IC50 of approximately 120 μM, and only achieves an inhibition rate of 45% at a concentration of 100 μM[1].
MedChemExpress (MCE) has not independently confirmed the accuracy of these methods. They are for reference only.
In Vivo
Prothioconazole (1-5 mg/kg BW/day; p.o.; daily; 28 days) administration to male ICR mice causes dose-dependent oxidative stress, metabolic disruption, and reduced growth phenotypes, with more severe effects observed in liver tissue compared to kidney tissue[3].
Prothioconazole (1-5 mg/kg; p.o.; daily; 30 days) induces dose-dependent liver metabolic dysfunction and hepatotoxicity in female ICR mice, disrupting glycolipid metabolism via changes in key gene expression, metabolite levels, and liver histology[4].
MedChemExpress (MCE) has not independently confirmed the accuracy of these methods. They are for reference only.
-
Animal Model:ICR (female, 6-8-week-old)[2]
-
Dosage:1 mg/kg/day; 5 mg/kg/day; 10 mg/kg/day
-
Administration:p.o.; daily; 30 days
-
Result:Reduced germinal vesicle breakdown (GVBD) rate to 75.3% (control: 89.5%).
Reduced first polar body extrusion (PBE) rate to 48.3% (control: 78.5%).
Reduced number of ovulated oocytes to 39.7 (control: 55.2).
Reduced fertilization rate to 78.5% (control: 95.9%).
Reduced 8-cell embryo rate to 52.6% (control: 63.8%).
Reduced morula rate to 35.1% (control: 61.2%).
Reduced blastocyst rate to 7.2% (control: 36.7%).
Reduced average offspring number to 10.1 (control: 15.3).
Increased aberrant spindle rate to 52.9% (control: 22.2%).
Increased misaligned chromosome rate to 28.6% (control: 15.9%).
Reduced acetylated α-tubulin fluorescence intensity to 15.4 A.U. (control: 32.2 A.U.).
Increased defective kinetochore-microtubule attachments rate to 46.1% (control: 14.3%).
Reduced Juno fluorescence intensity to 24.5 A.U. (control: 34.4 A.U.).
Reduced cortical granule fluorescence intensity to 28.7 A.U. (control: 40.7 A.U.).
Reduced ovastacin fluorescence intensity to 38.7 A.U. (control: 58.7 A.U.).
Reduced sperm binding number to 89.3 per egg (control: 143.8 per egg).
Reduced mitochondrial fluorescence intensity to 18.3 A.U. (control: 27.5 A.U.).
Increased ROS fluorescence intensity to 17.85 A.U. (control: 2.5 A.U.).
Increased γ-H2A.X fluorescence intensity to 21.5 A.U. (control: 13.4 A.U.).
Increased Annexin-V fluorescence intensity to 12.3 A.U. (control: 3.8 A.U.).
Identified 719 downregulated and 528 upregulated differentially expressed genes in oocytes, enriched in pathways related to mitochondrial oxidative phosphorylation, apoptosis, and oocyte meiosis.
-
Animal Model:ICR (5-week-old male)[3]
-
Dosage:1 mg/kg BW/day; 5 mg/kg BW/day
-
Administration:p.o.; daily; 28 days
-
Result:Significantly decreased body weight gain and liver weight at both doses.
Significantly decreased liver index at 1 mg/kg dose; significantly decreased liver index, kidney weight, and kidney index at 5 mg/kg dose.
Did not significantly reduce body weight at either dose.
Significantly decreased glutathione (GSH) content in liver at both doses.
Significantly increased lipid peroxidation (LPO) content, superoxide dismutase (SOD) activity, and malondialdehyde (MDA) content in liver at 5 mg/kg dose; did not significantly increase LPO content in liver at 1 mg/kg dose.
Caused no significant changes to catalase (CAT) or peroxidase (POD) activity in liver at either dose.
Caused no significant changes to oxidative stress biomarkers in kidney at either dose.
Significantly increased relative abundances of lipid, lactate, acetate, choline, leucine, glutamate, glutamine, succinate, valine, alanine, lysine, and uracil in liver at both doses; significantly decreased relative abundances of phosphocholine (PC), glycerophosphocholine (GPC), and glycogen in liver at both doses.
Additionally significantly decreased relative abundances of alpha-glucose, beta-glucose, and betaine, and increased relative abundance of taurine in liver at 5 mg/kg dose.
Significantly decreased relative abundance of taurine in kidney at 1 mg/kg dose; significantly increased relative abundances of choline, PC, and glutamine, and decreased relative abundances of lactate, acetate, leucine, taurine, betaine, and succinate in kidney at 5 mg/kg dose.
Significantly altered D-glutamine and D-glutamate metabolism, alanine-aspartate-glutamate metabolism, pyruvate metabolism, and arginine biosynthesis in liver tissue at both doses.
Significantly altered phenylalanine, tyrosine, and tryptophan biosynthesis in kidney tissue at both doses; additionally significantly altered pyruvate metabolism, arginine biosynthesis, and taurine and hypotaurine metabolism in kidney tissue at 5 mg/kg dose.
- RT-PCR
- Reproductive and Developmental Toxicity Study
- RNA extraction experimental
- Detection of Apoptosis
- TUNEL staining for apoptotic DNA fragmentation
- Annexin V plus membrane-impermeant dye apoptosis staining
- ROS/oxidative-stress fluorescent staining
- Mitochondrial membrane-potential and mitochondrial mass staining
- Apoptosis Solutions
- Hepatotoxicity Study
- Genotoxicity/Mutagenicity Study
- Real Time qPCR (Q-PCR)


Chemical Information
-
CAS No. 178928-70-6
-
Appearance Solid
-
Molecular Weight 344.26
-
Formula C14H15Cl2N3OS
-
Color White to light yellow
-
SMILES
S=C1NC=NN1CC(CC2=C(Cl)C=CC=C2)(C3(CC3)Cl)O
-
Synonyms
JAU-6476
-
Shipping
Room temperature in continental US; may vary elsewhere.
-
Storage
Powder -20°C 3 years In solvent -80°C 6 months -20°C 1 month


Solvent & Solubility
In Vitro:
DMSO : 50 mg/mL (145.24 mM; Need ultrasonic; Hygroscopic DMSO has a significant impact on the solubility of product, please use newly opened DMSO)
Please refer to the solubility information to select the appropriate solvent. Once prepared, please aliquot and store the solution to prevent product inactivation from repeated freeze-thaw cycles.
Storage method and period of stock solution: -80°C, 6 months; -20°C, 1 month. When stored at -80°C, please use it within 6 months. When stored at -20°C, please use it within 1 month.
Please refer to the solubility information to select the appropriate solvent. Once prepared, please aliquot and store the solution to prevent product inactivation from repeated freeze-thaw cycles.
Storage method and period of stock solution: -80°C, 6 months; -20°C, 1 month. When stored at -80°C, please use it within 6 months. When stored at -20°C, please use it within 1 month.
Concentration (start) × Volume (start) = Concentration (final) × Volume (final)
In Vivo:
Select the appropriate dissolution method based on your experimental animal and administration route.
- For the following dissolution methods, please ensure to first prepare a clear stock solution using an In Vitro approach and then sequentially add co-solvents:
- To ensure reliable experimental results, the clarified stock solution can be appropriately stored based on storage conditions. As for the working solution for In Vivo experiments, it is recommended to prepare freshly and use it on the same day.
- The percentages shown for the solvents indicate their volumetric ratio in the final prepared solution. If precipitation or phase separation occurs during preparation, heat and/or sonication can be used to aid dissolution.
Add each solvent one by one: 10% DMSO 40% PEG300 5% Tween-80 45% Saline
Solubility: ≥ 2.5 mg/mL (7.26 mM); Clear solution
This protocol yields a clear solution of ≥ 2.5 mg/mL (saturation unknown).
Taking 1 mL working solution as an example, add 100 μL DMSO stock solution (25.0 mg/mL) to 400 μL PEG300, and mix evenly; then add 50 μL Tween-80 and mix evenly; then add 450 μL Saline to adjust the volume to 1 mL.
Preparation of Saline: Dissolve 0.9 g sodium chloride in ddH₂O and dilute to 100 mL to obtain a clear Saline solution.
Add each solvent one by one: 10% DMSO 90% (20% SBE-β-CD in Saline)
Solubility: ≥ 2.5 mg/mL (7.26 mM); Clear solution
This protocol yields a clear solution of ≥ 2.5 mg/mL (saturation unknown).
Taking 1 mL working solution as an example, add 100 μL DMSO stock solution (25.0 mg/mL) to 900 μL 20% SBE-β-CD in Saline, and mix evenly.
Preparation of 20% SBE-β-CD in Saline (4°C, storage for one week): 2 g SBE-β-CD powder is dissolved in 10 mL Saline, completely dissolve until clear.
In Vivo Dissolution Calculator
Please enter the basic information of animal experiments:
-
-
-
-
Recommended: Prepare an additional quantity of animals to account for potential losses during experiments.
Please enter your animal formula composition:
-
%DMSO +
Recommended: Keep the proportion of DMSO in working solution below 2% if your animal is weak.
-
%+
-
+%Tween-80 + +
-
%Saline +
The co-solvents required include: DMSO, . All of co-solvents are available by MedChemExpress (MCE). , Tween 80. All of co-solvents are available by MedChemExpress (MCE).
Working solution concentration: 0.22 mg/mL
Method for preparing stock solution: mg drug dissolved in μL DMSO. Stock solution concentration: mg/mL.
1. Take μL DMSO stock solution;
2. Add μL .
μL , mix evenly;
3. Then add μL Tween 80, mix evenly;
4. Then add μL
Please ensure that the stock solution in the first step is dissolved to a clear state, and add co-solvents in sequence. You can use ultrasonic heating (ultrasonic cleaner, recommended frequency 20-40 kHz), vortexing, etc. to assist dissolution.


Purity & Documentation
-
Data Sheet (285 KB)
-
SDS (761 KB)
- English - EN (761 KB)
- Français - FR (761 KB)
- Deutsch - DE (761 KB)
- Norwegian - NO (761 KB)
- Español - ES (761 KB)
- Swedish - SV (761 KB)
- Italian - IT (761 KB)
- Korean - KR (761 KB)
- Portuguese - PT (761 KB)
-
Handling Instructions (2659 KB)
References
[1]. Parker JE, et al. Prothioconazole and prothioconazole-desthio activities against Candida albicans sterol 14-α-demethylase. Appl Environ Microbiol. 2013;79(5):1639-1645. [Content Brief]
[2]. Zhang M, et al. Prothioconazole exposure disrupts oocyte maturation and fertilization by inducing mitochondrial dysfunction and apoptosis in mice. Free Radic Biol Med. 2024;213:274-284. [Content Brief]
[3]. Meng Z, et al. Effects of exposure to prothioconazole and its metabolite prothioconazole-desthio on oxidative stress and metabolic profiles of liver and kidney tissues in male mice. Environ Pollut. 2021;269:116215. [Content Brief]
[4]. Tian S, et al. Prothioconazole and prothioconazole-desthio induced different hepatotoxicities via interfering with glycolipid metabolism in mice. Pestic Biochem Physiol. 2022;180:104983. [Content Brief]


Complete Stock Solution Preparation Table
Please refer to the solubility information to select the appropriate solvent. Once prepared, please aliquot and store the solution to prevent product inactivation from repeated freeze-thaw cycles.
Storage method and period of stock solution: -80°C, 6 months; -20°C, 1 month. When stored at -80°C, please use it within 6 months. When stored at -20°C, please use it within 1 month.
| Optional Solvent | Concentration Solvent Mass | 1 mg | 5 mg | 10 mg | 25 mg |
|---|---|---|---|---|---|
| DMSO | 1 mM | 2.9048 mL | 14.5239 mL | 29.0478 mL | 72.6195 mL |
| 5 mM | 0.5810 mL | 2.9048 mL | 5.8096 mL | 14.5239 mL | |
| 10 mM | 0.2905 mL | 1.4524 mL | 2.9048 mL | 7.2620 mL | |
| 15 mM | 0.1937 mL | 0.9683 mL | 1.9365 mL | 4.8413 mL | |
| 20 mM | 0.1452 mL | 0.7262 mL | 1.4524 mL | 3.6310 mL | |
| 25 mM | 0.1162 mL | 0.5810 mL | 1.1619 mL | 2.9048 mL | |
| 30 mM | 0.0968 mL | 0.4841 mL | 0.9683 mL | 2.4207 mL | |
| 40 mM | 0.0726 mL | 0.3631 mL | 0.7262 mL | 1.8155 mL | |
| 50 mM | 0.0581 mL | 0.2905 mL | 0.5810 mL | 1.4524 mL | |
| 60 mM | 0.0484 mL | 0.2421 mL | 0.4841 mL | 1.2103 mL | |
| 80 mM | 0.0363 mL | 0.1815 mL | 0.3631 mL | 0.9077 mL | |
| 100 mM | 0.0290 mL | 0.1452 mL | 0.2905 mL | 0.7262 mL |


Prothioconazole Related Classifications
HY-116568 Related Classifications
 Powered by Bioz
Keywords
- Prothioconazole
- 178928-70-6
- JAU-6476
- JAU6476
- JAU 6476
- Fungal
- Cytochrome P450
- Microtubule/Tubulin
- Mitochondrial Metabolism
- DNA/RNA Synthesis
- Apoptosis
- Fatty Acid Synthase (FASN)
- Mycosphaerella graminicola CYP51
- candidiasis
- mitochondrial dysfunction
- Candida albicans ATCC SC5314
- ICR mice
- prothioconazole-desthio
- CaCYP51
- ergosterol
- α-tubulin
- Candida albicans
- Inhibitor
- inhibitor
- inhibit