



HDAC-IN-39
Based on 1 publication(s) in Google Scholar
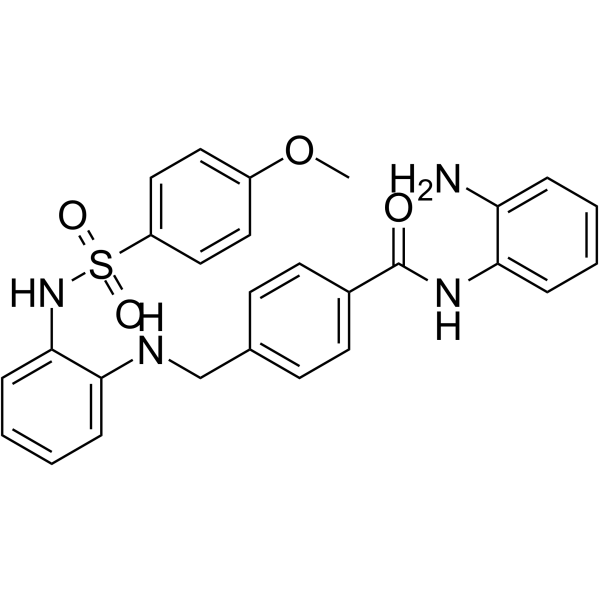
HDAC-IN-39 (compound 16c) is a potent HDAC inhibitor, with IC50 values of 1.07 μM (HDAC1), 1.47 μM (HDAC2), and 2.27 μM (HDAC3), respectively. HDAC-IN-39 also significantly inhibits microtubule polymerization. HDAC-IN-39 induces cell cycle arrest at the G2/M phase. HDAC-IN-39 displays promising anticancer activity against resistant cancer cells.
For research use only. We do not sell to patients.
- CAS No.: 2414046-33-4
- Formula: C27H26N4O4S
- Molecular Weight:502.58
-
Storage:
Please store the product under the recommended conditions in the Certificate of Analysis.

To place orders, for customer services and technical support, please contact: MedChemExpress USA
Tel: 609-228-6898 E-mail: [email protected] [email protected]


-
 Biological Activity
-
Chemical Information
- Protocols
- Purity & Documentation
- References
-
 Help & FAQs


Publications Citing Use of MedChemExpress (MCE) HDAC-IN-39
More

Biological Activity
Description
IC50 & Target
|
HDAC1 1.07 μM (IC50) |
HDAC2 1.47 μM (IC50) |
HDAC3 2.27 μM (IC50) |
HDAC8 >10 μM (IC50) |
Cellular Effect
|
Cell Line

|
Type | Value | Description | References |
|---|---|---|---|---|
| KB | GI50 |
0.012 μM
Compound: 16c
|
Antiproliferative activity against human KB cells incubated for 48 hrs by SRB assay
Antiproliferative activity against human KB cells incubated for 48 hrs by SRB assay
|
[PMID: 32171161] |
| KB | IC50 |
12 nM
Compound: 20
|
Antiproliferative activity against human KB cells assessed as cell growth inhibition
Antiproliferative activity against human KB cells assessed as cell growth inhibition
|
[PMID: 34101463] |
| KB | IC50 |
12 nM
Compound: 20
|
Antiproliferative activity against vincristine-resistant human KB cells assessed as cell growth inhibition
Antiproliferative activity against vincristine-resistant human KB cells assessed as cell growth inhibition
|
[PMID: 34101463] |
| KB | IC50 |
22 nM
Compound: 20
|
Antiproliferative activity against etoposide-resistant human KB cells assessed as cell growth inhibition
Antiproliferative activity against etoposide-resistant human KB cells assessed as cell growth inhibition
|
[PMID: 34101463] |


Chemical Information
-
CAS No. 2414046-33-4
-
Molecular Weight 502.58
-
Formula C27H26N4O4S
-
SMILES
COC1=CC=C(C=C1)S(=O)(NC2=CC=CC=C2NCC3=CC=C(C=C3)C(NC4=CC=CC=C4N)=O)=O
-
Shipping
Room temperature in continental US; may vary elsewhere.
-
Storage
Please store the product under the recommended conditions in the Certificate of Analysis.


Publications (1)
-
Journal Impact Factor
-
Most Recent

Protocols
-
Cell Cytotoxicity Assay
Cytotoxicity assays are usually based on the assessment of cell membrane damage, which can also be indirectly detected by measuring cell viability. Detection methods include MTT assay, CKK-8 assay, LDH assay and ATP assay, etc.
-
Flow cytometric DNA-content cell-cycle staining
Flow cytometric DNA-content cell-cycle staining measures the fluorescence intensity of DNA-bound fluorochromes in single cells or nuclei to estimate DNA content distributions, allowing assignment of populations to G0/G1, S, and G2/M phases by DNA histogram deconvolution. Propidium iodide (PI) intercalates into DNA, and PI fluorescence is proportional to cellular DNA content when staining is performed under conditions that make DNA accessible and minimize non-DNA signal. Cells with G2/M DNA content are expected to show approximately twice the fluorescence intensity of G0/G1 cells, while S-phase cells occupy intermediate fluorescence values. PI-based DNA-content analysis can also detect cells with fractional DNA content, often reported as sub-G1, when DNA fragmentation and extraction during staining reduce retained DNA signal in apoptotic cells. DAPI is an alternative DNA fluorochrome for univariate DNA-content analysis, while bivariate approaches combining DNA content with proliferation
-
BrdU Incorporation Assay
Bromodeoxyuridine (BrdU) incorporation assay is based on the principle that BrdU, a thymidine analog, is incorporated into newly synthesized DNA during the S phase of the cell cycle, thereby serving as a marker of DNA replication and cellular proliferation. Incorporated BrdU can be detected using anti-BrdU antibodies following DNA denaturation, enabling visualization or quantification of proliferating cells through immunochemical detection methods such as immunofluorescence or immunohistochemistry.
-
Protocol for Cell Cycle
Cell-cycle analysis by flow cytometry measures DNA content in single cells to estimate the fraction of cells in G0/G1, S, and G2/M phases. Propidium iodide intercalates into DNA, and after RNA removal with RNase, fluorescence intensity reflects cellular DNA content: 2N cells are assigned to G0/G1, cells between 2N and 4N to S phase, and 4N cells to G2/M. DNA-content analysis alone cannot reliably separate G0 from G1 or G2 from M. Ki-67 can distinguish quiescent G0 cells from cycling cells, EdU or BrdU incorporation marks active DNA synthesis in S phase, and phospho-histone H3 staining identifies mitotic cells within the 4N population.


Purity & Documentation
References

Calculators
Concentration (start) × Volume (start) = Concentration (final) × Volume (final)


HDAC-IN-39 Related Classifications
HY-146392 Related Classifications
 Powered by Bioz