



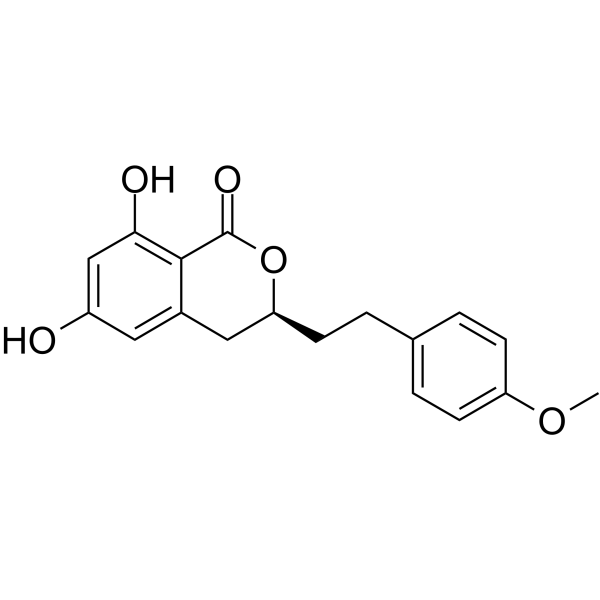
Agrimonolide
Based on 1 publication(s) in Google Scholar
Agrimonolide is a phenethyl isocoumarin compound discovered from Agrimonia pilosa, exhibiting anti-inflammatory, antioxidant, and anticancer activities. Agrimonolide inhibits NF-κB, MAPK, and TLR4-mediated neuroinflammatory signaling, suppresses Notch and JAK2/STAT3 signaling to modulate Th17/Treg balance and maintain the intestinal barrier. Agrimonolide decreases HIF1A expression, inhibits glycolysis, and induces ferroptosis and cell cycle arrest via the mTOR pathway in tumor models, thereby suppressing cancer cell viability, proliferation, and metastasis. Agrimonolide exerts hepatoprotective and anti-fibrotic effects by regulating bile acid transporter expression and reducing hepatic bile acid accumulation. Agrimonolide is used for research on ulcerative colitis, ovarian cancer, non-small cell lung cancer, cholestatic liver injury, and neuroinflammation.
Nur für Forschungszwecke. Wir verkaufen nicht an Patienten.
- Reinheit : 98%
- CAS. Nr.: 21499-24-1
- Formel: C18H18O5
- Molecular Weight:314.33
-
Speicherung:Powder -20°C, 3 years ; In solvent -80°C, 6 months , -20°C, 1 month

To place orders, for customer services and technical support, please contact: MedChemExpress USA
Tel: 609-228-6898 E-mail: [email protected] [email protected]


-
 Biologische Aktivität
-
Chemical Information
-
Lösungsmittel & Löslichkeit
- Protokoll
- Reinheit & Dokumentation
- Verweise
-
 Help & FAQs


Publications Citing Use of MedChemExpress (MCE) Agrimonolide
More

Biologische Aktivität
Beschreibung
In Vitro
Agrimonolide (10-20 μM; 4 days) inhibits Th17 cell differentiation from naïve CD4+ T cells isolated from C57BL/6J mice, as shown by reduced CD4+IL-17A+ cell frequency and lower RORγt mRNA expression[1].
Agrimonolide (10-20 μM; 4 days) promotes Treg cell differentiation from naïve CD4+ T cells isolated from C57BL/6J mice, as shown by increased CD4+CD25+Foxp3+ cell frequency and higher Foxp3 mRNA expression[1].
Network pharmacology analysis identifies HIF1A as a key core target of Agrimonolide in ovarian cancer, with significant enrichment of the HIF-1 signaling pathway[2].
Agrimonolide (10-40 μM; 0-3 days) inhibits viability of SKOV3 and A2780 ovarian cancer cells[2].
Agrimonolide (10-40 μM; 14 days) suppresses colony formation of SKOV3 and A2780 ovarian cancer cells[2].
Agrimonolide (10-100 μM; 24 h) exhibits no significant cytotoxicity in BV2 microglial and Neuro-2a neuronal cells at concentrations below 100 μM[6].
Agrimonolide (10-40 μM; 48 h) reduces glucose uptake and lactate production in SKOV3 and A2780 ovarian cancer cells[2].
Agrimonolide (20-40 μM) decreases extracellular acidification rate, indicating reduced glycolytic activity, in SKOV3 and A2780 ovarian cancer cells[2].
Agrimonolide (10-40 μM) decreases protein expression of HIF1A, HK2, and LDHA in SKOV3 and A2780 ovarian cancer cells[2].
Agrimonolide (40 μM) has inhibitory effects on glycolysis and HK2 expression in A2780 ovarian cancer cells that are reversed by overexpression of HIF1A, confirming that Agrimonolide attenuates glycolysis through modulation of HIF1A[2].
Agrimonolide (10-40 μM) inhibits malignant progression and induces ferroptosis in A549 non-small cell lung cancer cells by blocking the mTOR signaling pathway[3].
Agrimonolide does not show significant inhibitory activity against LPS-induced NO production in BV2 microglial cells at the tested concentrations, as it is not among the five active compounds identified in the assay[5].
Agrimonolide (10-50 μM; 2 h pre-incubation before LPS stimulation) dose-dependently inhibits LPS-induced P65 phosphorylation in BV2 cells with an IC50 of 20.3 μM[6].
Agrimonolide (10-50 μM; 2 h pre-incubation before LPS stimulation) dose-dependently inhibits LPS-induced phosphorylation of JNK and P38 in BV2 microglial cells[6].
Agrimonolide (10-50 μM; 2.5 h pre-incubation before LPS stimulation) dose-dependently inhibits LPS-induced nuclear translocation of the NF-κB subunit P50 in BV2 cells[6].
Agrimonolide (10-50 μM; pre-incubated before LPS stimulation) inhibits LPS-induced activation of NF-κB and MAPK signaling pathways in primary mouse astrocytes[6].
In silico molecular docking predicts that agrimonolide binds with high affinity to TLR4, IRAK1, and TRAF6 (binding energies ≤ −6.53 kcal/mol) and with moderate affinity to MyD88, supporting a multi-target mechanism of action on the TLR4 signaling pathway[6].
Agrimonolide reduces IL-1β secretion from LPS-stimulated BV2 microglial cells[6].
Agrimonolide (10-50 μM; 6 h LPS stimulation) significantly reduces mRNA expression of IL-1β, IL-6, TNF-α, and IL-18 in LPS-stimulated BV2 cells[6].
Agrimonolide (10-50 μM; 6 h LPS stimulation) reduces LPS-induced mRNA expression of TLR4, MyD88, IRAK1, and TRAF6 in BV2 microglial cells[6].
Agrimonolide (10-50 μM; pre-incubated before LPS stimulation) inhibits LPS-induced activation of primary mouse microglia, as evidenced by reduced CD68 expression and preserved ramified morphology[6].
Agrimonolide (10-50 μM; pre-incubated before LPS stimulation) significantly reduces mRNA expression of IL-1β, IL-6, TNF-α, and IL-18 in LPS-stimulated primary mouse astrocytes[6].
Agrimonolide (10-50 μM; pre-incubated before LPS stimulation) dose-dependently inhibits LPS-induced GFAP upregulation and activation of primary mouse astrocytes[6].
Agrimonolide (10-50 μM; 2 h pre-incubation before LPS stimulation) dose-dependently reduces LPS-induced expression of NLRP3, iNOS, and COX-2 proteins in BV2 microglial cells[6].
Agrimonolide (10-50 μM; 2 h pre-incubation before LPS stimulation) dose-dependently reduces LPS-induced expression of TLR4, IRAK1, and TRAF6 proteins in BV2 microglial cells, while MyD88 protein levels were not notably altered under these conditions[6].
MedChemExpress (MCE) has not independently confirmed the accuracy of these methods. They are for reference only. Further protocols information, click here.
-
Cell Line:SKOV3, A2780 ovarian cancer cells
-
Concentration:10, 20, 40 μM
-
Incubation Time:0, 1, 2, 3 days
-
Result:Significantly reduced the viability of both SKOV3 and A2780 ovarian cancer cells at concentrations of 20 μM and 40 μM.
Did not produce a significant effect on cell viability at 10 μM.
-
Cell Line:SKOV3, A2780 ovarian cancer cells
-
Concentration:10, 20, 40 μM
-
Incubation Time:14 days
-
Result:Suppressed colony formation in both SKOV3 and A2780 cells at 20 μM and 40 μM.
Showed a lesser effect on colony formation at 10 μM compared to higher concentrations.
-
Cell Line:BV2 mouse microglial cells
-
Concentration:10, 30, 50 μM
-
Incubation Time:2 h pre-incubation before LPS stimulation; 45 min (LPS stimulation)
-
Result:Suppressed the LPS-induced increase of p-P65 in a dose-dependent manner, yielding an IC50 of 20.3 μM based on p-P65 band densitometry quantification.\nSignificantly suppressed LPS-induced phosphorylation of both JNK and p38 kinase in a dose-dependent manner.
Eliminated the LPS-induced increase of P50 levels in the nucleus of BV2 cells in a dose-dependent manner.
-
Cell Line:BV2 mouse microglial cells
-
Concentration:10, 30, 50 μM
-
Incubation Time:pre-incubated before LPS stimulation; 6 h (LPS stimulation)
-
Result:Significantly reduced the mRNA levels of IL-1β, IL-6, TNF-α, and IL-18 in LPS-stimulated BV2 cells.\nReduced the mRNA levels of TLR4, MyD88, IRAK1, and TRAF6 in LPS-stimulated BV2 cells.
-
Cell Line:BV2 mouse microglial cells
-
Concentration:10, 30, 50 μM
-
Incubation Time:2 h pre-incubation before LPS stimulation; 24 h (LPS stimulation)
-
Result:Markedly reduced the LPS-induced expression of NLRP3, iNOS, and COX-2 proteins in a dose-dependent manner.\nEffectively inhibited LPS-induced increases in TLR4, IRAK1, and TRAF6 protein levels in a dose-dependent manner.
Did not notably alter MyD88 protein levels.
In Vivo
Agrimonolide (10-90 mg/kg; i.p.; daily; 28 days) exerts dose-dependent hepatoprotective, antifibrotic, and anti-inflammatory effects in DDC-induced chronic cholestatic liver injury in mice, reducing hepatic bile acid accumulation and normalizing bile acid homeostasis via modulation of bile acid transporters and metabolic enzymes[4].
Agrimonolide (90 mg/kg; i.p.; daily; 28 days) reduces hepatic hydroxyproline by 60.3%, decreases myeloid cell and macrophage infiltration, and modulates bile acid transporter expression to promote bile acid efflux and reduce hepatic bile acid accumulation in DDC-induced chronic cholestatic liver injury in mice, and these hepatoprotective, antifibrotic, and anti-inflammatory effects are diminished by the bile acid transport inhibitor BMS-986020[4].
Agrimonolide (25-50 mg/kg; i.p.; daily; 5 days) pretreatment mitigates LPS-driven neuroinflammation in ICR mice by decreasing glial activation and expression of inflammatory mediators[6].
MedChemExpress (MCE) has not independently confirmed the accuracy of these methods. They are for reference only.
-
Animal Model:C57BL/6J (male; 6 weeks old)[1]
-
Dosage:25 mg/kg/day; 50 mg/kg/day
-
Administration:i.g.; daily; starting before DSS exposure
-
Result:Reduced body weight loss in a dose-dependent manner compared to the DSS-only group.
Restored colon length in a dose-dependent manner compared to the DSS-only group.
Lowered disease activity index scores in a dose-dependent manner compared to the DSS-only group.
Alleviated mucosal damage, inflammatory cell infiltration, and crypt structure destruction in the colon.
Suppressed myeloperoxidase activity in colon tissues, with the 50 mg/kg dose showing a more substantial reduction than the 25 mg/kg dose.
Decreased the production of pro-inflammatory cytokines IL-1β, TNF-α, and IL-6 in colonic tissue.
Reduced the phosphorylation levels of IKKα/β, IκBα, and p65 in the NF-κB pathway.
Increased the protein expression levels of tight junction proteins Occludin and ZO-1.
Reduced serum FITC-dextran concentration.
Decreased the absolute number of CD4+IL-17A+ Th17 cells in mesenteric lymph nodes.
Increased the percentage of CD4+CD25+Foxp3+ Treg cells in mesenteric lymph nodes.
Modulated the mRNA and protein levels of Th17-specific transcription factor RORγt and Treg-specific transcription factor Foxp3 in colon and spleen tissues.
Reduced the mRNA and protein expression of Notch-1, Jagged1, and DLL4 in colonic tissue.
Inhibited the phosphorylation of JAK2 and STAT3.
Reduced protein expression of Notch1 and STAT3 as confirmed by immunofluorescence.
-
Animal Model:C57BL/6 J (male; 8 weeks old; 20-25 g; specific pathogen-free)[4]
-
Dosage:10 mg/kg; 30 mg/kg; 90 mg/kg
-
Administration:i.p.; daily; 28 days
-
Result:Alleviated DDC-induced increase in liver-to-body weight ratio in a dose-dependent manner.
Mitigated DDC-induced elevations in serum ALT, AST, ALP, total bilirubin, and direct bilirubin in a dose-dependent manner.
Alleviated ductular proliferation, macrophage infiltration, intraductal plugs, pericholangitis, onion skin-type periductal fibrosis, and biliary fibrosis.
Reduced DDC-increased hepatic hydroxyproline accumulation in a dose-dependent manner.
Markedly decreased hepatic mRNA expression of fibrosis markers α-Sma, Col1a1, Timp1, Epcam, and Mmp2, and reduced α-SMA protein expression at 90 mg/kg.
Reduced hepatic mRNA upregulation of inflammatory cytokines Tnf-α, Il-6, Il-1β, and Tgfb1.
Alleviated excessive bile duct proliferation in all dosage groups as confirmed by CK19 staining.
Reduced hepatic bile acid levels in a dose-dependent manner.
Increased hepatic mRNA expression of bile acid synthesis enzymes Cyp7a1, Cyp8b1, and Cyp7b1 dose-dependently, and reversed DDC-induced downregulation of Cyp27a1 at 90 mg/kg.
Inhibited DDC-induced increases in TCA, T-α-MCA, β-MCA, and T-β-MCA; reversed accumulation of T-CDCA, T-DCA, and T-UDCA at 90 mg/kg.
Reversed DDC-induced downregulation of Bsep at all three doses, with 30 and 90 mg/kg increasing Bsep expression.
Decreased DDC-elevated expression of Oatp2, Mrp3, and Mrp4 in a dose-dependent manner; increased DDC-reduced Ntcp and Oatp1 expression at 30 and 90 mg/kg.
Dose-dependently alleviated DDC-induced upregulation of phase I enzymes Cyp3a11 and Cyp2b10, and reversed DDC-induced inhibition of phase II enzymes Ugt1a1 and Sult2a1.
-
Animal Model:C57BL/6 J (male; 8 weeks old; 20-25 g; specific pathogen-free)[4]
-
Dosage:90 mg/kg
-
Administration:i.p.; daily; 28 days
-
Result:Partially restored DDC-increased liver-to-body weight ratio from 10.96% to 5.31%.
Normalized serum ALT, AST, and ALP levels.
Increased hepatic expression of bile efflux genes Bsep and Mrp2.
Downregulated Oatp2, Mrp3, and Mrp4, and upregulated Ntcp and Oatp1.
Reduced DDC-increased hepatic hydroxyproline from 81.3 μg/mg liver to 32.3 μg/mg liver.
Decreased hepatic mRNA expression of fibrosis markers α-Sma, Col1a1, Timp1, and Epcam, and inhibited Tgfb1 gene expression.
Alleviated ductular proliferation, intraductal plugs, inflammatory cell infiltration, and pericholangitis as shown by immunohistochemistry.
Decreased the percentage of myeloid cells and increased the percentage of lymphoid cells, inhibited CD4+ and CD8+ lymphocyte infiltration, and decreased the numbers of both Kupffer cells and monocyte-derived macrophages as shown by flow cytometry.
-
Animal Model:ICR mice (6 weeks old)[6]
-
Dosage:25 mg/kg; 50 mg/kg
-
Administration:i.p.; daily; 5 days
-
Result:Attenuated LPS-induced activation of microglia and astrocytes in the hippocampus, as evidenced by reduced IBA-1 and GFAP immunoreactivity, decreased density of IBA-1-positive microglia and GFAP-positive astrocytes, and mitigation of morphological changes associated with activation.
Suppressed LPS-induced microglial and astrocytic activation in the cortical area.
Dose-dependently suppressed the LPS-induced upregulation of IBA-1 and GFAP protein levels in western blot analysis.
Significantly downregulated the mRNA levels of LPS-induced pro-inflammatory factors including NLRP3, iNOS, COX-2, IL-1β, IL-6, TNF-α, and IL-18 in the hippocampus in RT-qPCR analysis.


Chemical Information
-
CAS. Nr. 21499-24-1
-
Appearance Solid
-
Molecular Weight 314.33
-
Formel C18H18O5
-
Color White to off-white
-
SMILES
O=C1C2=C(O)C=C(O)C=C2C[C@H](CCC3=CC=C(OC)C=C3)O1
-
Structure Classification
-
Initial Source
-
Versand
Room temperature in continental US; may vary elsewhere.
-
Speicherung
Powder -20°C 3 years In solvent -80°C 6 months -20°C 1 month


Publications (1)
-
Journal Impact Factor
-
Most Recent


Lösungsmittel & Löslichkeit
In Vitro:
DMSO : 25 mg/mL (79.53 mM; Need ultrasonic and warming; Hygroscopic DMSO has a significant impact on the solubility of product, please use newly opened DMSO)
Please refer to the solubility information to select the appropriate solvent. Once prepared, please aliquot and store the solution to prevent product inactivation from repeated freeze-thaw cycles.
Storage method and period of stock solution: -80°C, 6 months; -20°C, 1 month. When stored at -80°C, please use it within 6 months. When stored at -20°C, please use it within 1 month.
Please refer to the solubility information to select the appropriate solvent. Once prepared, please aliquot and store the solution to prevent product inactivation from repeated freeze-thaw cycles.
Storage method and period of stock solution: -80°C, 6 months; -20°C, 1 month. When stored at -80°C, please use it within 6 months. When stored at -20°C, please use it within 1 month.
Konzentration (Stammlösung) × Volumen (Stammlösung) = Konzentration (Ziellösung) × Volumen (Ziellösung)

Protokoll
-
RNA extraction experimental
By lysing cells, releasing RNA, and removing impurities such as proteins and DNA, high-purity RNA products are finally obtained. The commonly used traditional method is the guanidine isothiocyanate/phenol/chloroform method (Trizol), which is suitable for a variety of animal materials including animal tissues, microorganisms, cultured cells, etc., and most plant materials.
-
Mammalian live/dead viability and cytotoxicity staining
Live/dead viability and cytotoxicity staining assays are based on the simultaneous detection of intracellular esterase activity in metabolically active (viable) cells and membrane integrity loss in non-viable cells. In commonly used dual-staining approaches, membrane-permeant fluorogenic substrates are converted by intracellular esterases into fluorescent products in live cells, while impermeant DNA-binding dyes selectively enter cells with compromised plasma membranes and label nucleic acids in dead or dying cells, enabling discrimination between viable and non-viable populations by fluorescence microscopy or flow cytometry.
-
Naïve CD4+ T-cell subset differentiation/polarization
Naïve CD4+ T-cell subset differentiation/polarization is an in vitro assay in which purified naïve CD4+ T cells are activated through TCR and CD28 costimulation and cultured with defined cytokines and neutralizing antibodies to generate Th0, Th1, Th2, Th17, or induced Treg-like populations. Differentiation is detected by subset-associated cytokines and transcription factors: IFN-γ/T-bet for Th1, IL-4/GATA3 for Th2, IL-17A/RORγt for Th17, and Foxp3 for induced Treg cells. The assay readout is usually generated by intracellular cytokine staining after restimulation, transcription-factor staining by flow cytometry, ELISA of secreted cytokines, or gene-expression analysis. The result reflects cytokine-directed lineage commitment or polarization rather than antigen-specific immune protection by itself.
-
BrdU Incorporation Assay
Bromodeoxyuridine (BrdU) incorporation assay is based on the principle that BrdU, a thymidine analog, is incorporated into newly synthesized DNA during the S phase of the cell cycle, thereby serving as a marker of DNA replication and cellular proliferation. Incorporated BrdU can be detected using anti-BrdU antibodies following DNA denaturation, enabling visualization or quantification of proliferating cells through immunochemical detection methods such as immunofluorescence or immunohistochemistry.
-
Protocol for Cell Cycle
Cell-cycle analysis by flow cytometry measures DNA content in single cells to estimate the fraction of cells in G0/G1, S, and G2/M phases. Propidium iodide intercalates into DNA, and after RNA removal with RNase, fluorescence intensity reflects cellular DNA content: 2N cells are assigned to G0/G1, cells between 2N and 4N to S phase, and 4N cells to G2/M. DNA-content analysis alone cannot reliably separate G0 from G1 or G2 from M. Ki-67 can distinguish quiescent G0 cells from cycling cells, EdU or BrdU incorporation marks active DNA synthesis in S phase, and phospho-histone H3 staining identifies mitotic cells within the 4N population.
-
CCK-8/WST-8 Cell Proliferation Assay
The CCK-8/WST-8 assay is based on the reduction of the water-soluble tetrazolium salt WST-8 to a water-soluble formazan product by cellular dehydrogenases in metabolically active cells, where the generated formazan amount is proportional to the number of living cells and is quantified by measuring absorbance in the visible range, providing a colorimetric readout for cell viability and proliferation assessment. This class of tetrazolium-based assays improves upon earlier MTT-based systems by producing a water-soluble formazan, eliminating the need for organic solubilization steps and enabling direct spectrophotometric measurement in culture medium.
-
Research Protocol for Inflammation-related Diseases
The NLRP3 inflammasome is a cytosolic innate immune signaling platform that integrates priming signals and danger-signal activation to promote caspase-1 activation, maturation of IL-1β and IL-18, and gasdermin D-mediated pyroptotic cell death. The core experimental logic is to determine whether inflammatory disease phenotypes are driven by increased NLRP3 expression, ASC-containing inflammasome assembly, caspase-1 cleavage, GSDMD cleavage, and extracellular release of IL-1β/IL-18 rather than by nonspecific cell injury alone. The pathway is strongly linked to inflammation-related disease phenotypes because monosodium urate crystals activate NALP3/NLRP3 inflammasome signaling in gout-like crystal inflammation, cholesterol crystals activate NLRP3 inflammasomes in atherogenesis models, and DSS-induced intestinal inflammation has been reported to involve NLRP3 inflammasome activity. However, experimental colitis studies also show context-dependent protective effects of NLRP3 inflammasome co
-
Research Protocol for Neurological Diseases
PINK1/Parkin-mediated mitophagy pathway is a mitochondrial quality-control signaling axis in which mitochondrial depolarization stabilizes PINK1 on damaged mitochondria, activates Parkin recruitment and E3 ubiquitin ligase activity, promotes ubiquitination of outer mitochondrial membrane proteins, recruits selective autophagy adaptors, and drives lysosomal degradation of damaged mitochondria. In neurological disease research, this pathway is experimentally important because neurons, especially dopaminergic neurons, are highly dependent on mitochondrial integrity, and defective mitochondrial turnover can lead to mitochondrial dysfunction, oxidative stress, impaired neuronal survival, α-synuclein accumulation, and neuroinflammatory damage-associated signals. The genetic disease link is strongest in Parkinson’s disease because mutations in PRKN/parkin cause autosomal recessive juvenile parkinsonism, mutations in PINK1 cause hereditary early-onset Parkinson’s disease, and Drosophila studie
-
Cell Viability Determination by MTT Colorimetric Assay
The following protocol uses the MTT colorimetric assay as a classic literature-established method for assessing cell viability/metabolic activity in cultured mammalian cells. MTT[3-(4,5-dimethylthiazol-2-yl)-2,5-diphenyltetrazolium bromide] is reduced by metabolically active cells to a colored formazan product; the amount of formazan is quantified spectrophotometrically and provides an indirect measure of metabolically active viable cells. Importantly, MTT reduction reflects cellular oxidoreductase/metabolic activity rather than an absolute direct count of living cells, so changes in cellular metabolism can alter the signal independently of cell number.
-
Flow cytometric DNA-content cell-cycle staining
Flow cytometric DNA-content cell-cycle staining measures the fluorescence intensity of DNA-bound fluorochromes in single cells or nuclei to estimate DNA content distributions, allowing assignment of populations to G0/G1, S, and G2/M phases by DNA histogram deconvolution. Propidium iodide (PI) intercalates into DNA, and PI fluorescence is proportional to cellular DNA content when staining is performed under conditions that make DNA accessible and minimize non-DNA signal. Cells with G2/M DNA content are expected to show approximately twice the fluorescence intensity of G0/G1 cells, while S-phase cells occupy intermediate fluorescence values. PI-based DNA-content analysis can also detect cells with fractional DNA content, often reported as sub-G1, when DNA fragmentation and extraction during staining reduce retained DNA signal in apoptotic cells. DAPI is an alternative DNA fluorochrome for univariate DNA-content analysis, while bivariate approaches combining DNA content with proliferation
-
Cell Cytotoxicity Assay
Cytotoxicity assays are usually based on the assessment of cell membrane damage, which can also be indirectly detected by measuring cell viability. Detection methods include MTT assay, CKK-8 assay, LDH assay and ATP assay, etc.
-
DSS-Induced Colitis
Dextran sulfate sodium (DSS)-induced colitis is generated by administering DSS in mouse drinking water, producing epithelial injury, barrier disruption, weight loss, diarrhea, fecal blood, colon shortening, histologic mucosal damage, and inflammatory mediator changes; the model is mainly used to study acute or chronic intestinal inflammation resembling selected features of ulcerative colitis. DSS injury is interpreted through clinical and tissue readouts rather than a single molecular endpoint: daily body weight, stool consistency, and bleeding are combined into a disease activity index, while colon length, histology, cytokines, myeloperoxidase activity, intestinal permeability, and tight-junction markers provide complementary measures of inflammation and barrier damage.
-
TNBS-Induced Colitis
TNBS-induced colitis is produced by intrarectal delivery of 2,4,6-trinitrobenzene sulfonic acid in ethanol, where ethanol disrupts the mucosal barrier and TNBS haptenates colonic proteins, generating immune-mediated colonic inflammation with weight loss, diarrhea, ulceration, transmural injury, inflammatory-cell infiltration, and cytokine responses. The model is used as an experimental intestinal inflammation model with Crohn’s disease–like features, especially when Th1-type responses, IL-12–dependent inflammation, chronic relapsing inflammation, or fibrosis-related endpoints are studied.
-
Notch Pathway Solutions
The Notch pathway is a contact-dependent signaling pathway that controls cell-fate decisions, differentiation, proliferation, and tissue patterning through interactions between membrane-bound Notch receptors and membrane-bound ligands on neighboring cells. Canonical Notch signaling is activated when ligand engagement triggers proteolytic release of the Notch intracellular domain, which enters the nucleus and regulates transcription together with DNA-binding transcriptional complexes. In the canonical mechanism, ligand-dependent Notch activation leads to release of the intracellular Notch domain, and presenilin-dependent γ-secretase activity is required for production of the active intracellular signaling fragment. The released intracellular domain functions as a nuclear signal that converts Notch receptor activation at the membrane into transcriptional regulation of target programs such as HES/HEY-family genes and other context-dependent downstream targets. The literature links Notch p
-
Ferroptosis Solutions
Ferroptosis is an iron-dependent, non-apoptotic form of regulated cell death characterized by lethal lipid peroxidation and sensitivity to suppression by iron chelators or lipophilic radical-trapping antioxidants. The core pathway links cystine uptake through system Xc−, glutathione availability, GPX4-dependent detoxification of phospholipid hydroperoxides, iron-dependent oxidative reactions, and polyunsaturated-phospholipid metabolism into a cell-death program that is biochemically and morphologically distinct from apoptosis, necrosis, and autophagy. The ferroptosis pathway is experimentally linked to phenotype through chemical and genetic perturbation. Erastin induces ferroptosis by inhibiting cystine uptake through system Xc− and weakening antioxidant defenses, while GPX4 inhibition or depletion causes lipid peroxide accumulation and ferroptotic cancer-cell death. ACSL4 and oxidizable arachidonoyl- or adrenoyl-containing phosphatidylethanolamines shape ferroptosis sensitivity by con
-
MTT Cell Proliferation Assay
The MTT assay is a colorimetric endpoint assay for estimating viable cell number, cell growth, cytotoxicity, or cell activation in cultured mammalian cells. Living cells reduce the yellow tetrazolium salt MTT into purple/blue formazan, while dead cells do not generate the same signal; the resulting color can be quantified with a multiwell spectrophotometer. MTT reduction is commonly interpreted as a readout of metabolic activity that often correlates with viable cell number, but it should not be treated as a direct cell-counting method unless the assay is optimized for the cell type and experimental condition. Studies show that MTT reduction can involve mitochondrial and non-mitochondrial reducing systems, and formazan may accumulate in intracellular lipid droplets rather than simply marking mitochondria.
-
Orthotopic Cell-Line Xenograft
Orthotopic cell-line xenograft models involve implantation of human cancer cell lines into the anatomically corresponding organ of immunodeficient mice to reproduce tumor growth within a native microenvironment, enabling more clinically relevant tumor behavior compared with subcutaneous models. These models are widely used because orthotopic placement better recapitulates tumor progression, including invasion and metastatic spread, which are often underrepresented in heterotopic implantation systems. Compared with conventional xenografts, orthotopic implantation is described as more technically complex but provides improved simulation of tumor-microenvironment interactions and metastatic behavior, making it particularly valuable for translational oncology research. Surgical orthotopic implantation approaches have been emphasized as enabling faithful reproduction of clinical cancer features, including metastasis and disease progression patterns that align with the tumor’s organ of origi


Reinheit & Dokumentation
-
Data Sheet (302 KB)
-
SDS (393 KB)
- English - EN (393 KB)
- Français - FR (393 KB)
- Deutsch - DE (393 KB)
- Norwegian - NO (393 KB)
- Español - ES (393 KB)
- Swedish - SV (393 KB)
- Italian - IT (393 KB)
- Korean - KR (393 KB)
- Portuguese - PT (393 KB)
-
Handling Instructions (2659 KB)
Verweise
[1]. Jiang J, et al. Agrimonolide mitigated DSS-induced colitis by modulating the balance between Treg and Th17 cells through the suppression of the Notch and JAK2/STAT3 signaling pathways. Heliyon. 2024 Jul 15;10(13):e33803. [Content Brief]
[5]. Kim HW, et al. Acylphloroglucinolated Catechin and Phenylethyl Isocoumarin Derivatives from Agrimonia pilosa. J Nat Prod. 2016 Sep 23;79(9):2376-83. [Content Brief]


Complete Stock Solution Preparation Table
Please refer to the solubility information to select the appropriate solvent. Once prepared, please aliquot and store the solution to prevent product inactivation from repeated freeze-thaw cycles.
Storage method and period of stock solution: -80°C, 6 months; -20°C, 1 month. When stored at -80°C, please use it within 6 months. When stored at -20°C, please use it within 1 month.
| Optional Solvent | Concentration Solvent Mass | 1 mg | 5 mg | 10 mg | 25 mg |
|---|---|---|---|---|---|
| DMSO | 1 mM | 3.1814 mL | 15.9069 mL | 31.8137 mL | 79.5343 mL |
| 5 mM | 0.6363 mL | 3.1814 mL | 6.3627 mL | 15.9069 mL | |
| 10 mM | 0.3181 mL | 1.5907 mL | 3.1814 mL | 7.9534 mL | |
| 15 mM | 0.2121 mL | 1.0605 mL | 2.1209 mL | 5.3023 mL | |
| 20 mM | 0.1591 mL | 0.7953 mL | 1.5907 mL | 3.9767 mL | |
| 25 mM | 0.1273 mL | 0.6363 mL | 1.2725 mL | 3.1814 mL | |
| 30 mM | 0.1060 mL | 0.5302 mL | 1.0605 mL | 2.6511 mL | |
| 40 mM | 0.0795 mL | 0.3977 mL | 0.7953 mL | 1.9884 mL | |
| 50 mM | 0.0636 mL | 0.3181 mL | 0.6363 mL | 1.5907 mL | |
| 60 mM | 0.0530 mL | 0.2651 mL | 0.5302 mL | 1.3256 mL |


Agrimonolide Related Classifications
HY-N2830 Related Classifications
 Powered by Bioz