



CDK1-IN-4
Based on 1 publication(s) in Google Scholar
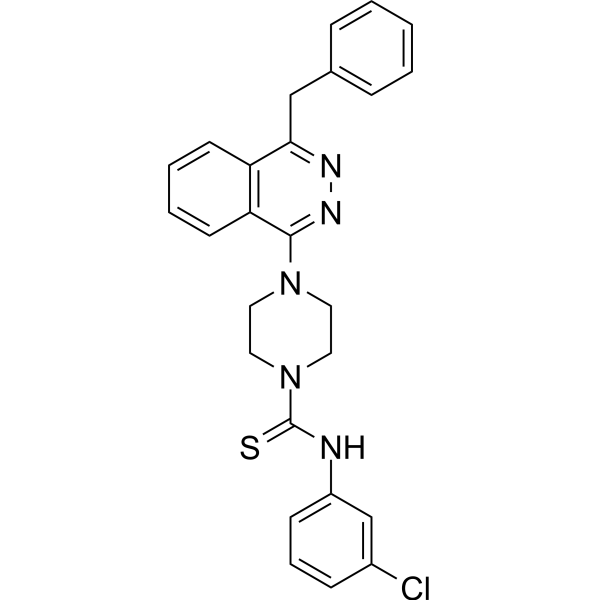
CDK1-IN-4 (10d) is a selective CDK1 inhibitor with IC50s of 44.52, 624.93 and 135.22 nM for CDK1, CDK2 and CDK5, respectively. CDK1-IN4 inhibits the growth of cancer cells by affecting cell cycle. CDK1-IN-4 can be used for the research of cancer.
For research use only. We do not sell to patients.
- CAS No.: 3032997-16-0
- Formula: C26H24ClN5S
- Molecular Weight:474.02
-
Storage:
Please store the product under the recommended conditions in the Certificate of Analysis.

To place orders, for customer services and technical support, please contact: MedChemExpress USA
Tel: 609-228-6898 E-mail: [email protected] [email protected]


-
 Biological Activity
-
Chemical Information
- Protocols
- Purity & Documentation
- References
-
 Help & FAQs


Publications Citing Use of MedChemExpress (MCE) CDK1-IN-4
More

Biological Activity
Description
IC50 & Target
|
CDK1 44.52 nM (IC50) |
CDK2 621.93 nM (IC50) |
CDK5 135.22 nM (IC50) |
In Vitro
CDK1-IN-4 (0-10 μM; 24 h) inhibits the growth of PDAC, melanoma, leukemia, colon and breast cancer cells[1]. CDK1-IN-4 (0-1 μM) inhibits CDK1, CDK2 and CDK5 with IC50s of 36.8, 305.17 and 369.37 nM, respectively[1]. CDK1-IN-4 (0-10 μM) inhibits AXL, PTK2B, FGFR, JAK1, IGF1R and BRAF kinases with IC50s of 2488, 8957, 7620, 8541, 4294 and 1156 nM, respectively[1]. CDK1-IN-4 (0.88 μM; 24 h) decreases CDK1 protein level in vitro and affects cell cycle[1].
MedChemExpress (MCE) has not independently confirmed the accuracy of these methods. They are for reference only.
-
Cell Line:PDAC, melanoma, leukemia, colon and breast cancer cell lines
-
Concentration:0-10 μM
-
Incubation Time:24 hours
-
Result:Inhibited cell growth of PDAC, melanoma, leukemia, colon, and breast cancer cell over 69%, and inhibited MDA-PATC53 and PL45 cells with IC50s of 0.88 and 1.14 μM, respectively.
-
Cell Line:MDA-PATC53 cell line
-
Concentration:0.88 μM
-
Incubation Time:24 hours
-
Result:Downregulated CDK1 protein level compared to untreated cells.
-
Cell Line:MDA-PATC53 cell line
-
Concentration:0.88 μM
-
Incubation Time:24 hours
-
Result:Significantly arrested in G2/M phase of the cell cycle compared with the untreated cells.


Chemical Information
-
CAS No. 3032997-16-0
-
Molecular Weight 474.02
-
Formula C26H24ClN5S
-
SMILES
S=C(N1CCN(C2=NN=C(CC3=CC=CC=C3)C4=C2C=CC=C4)CC1)NC5=CC=CC(Cl)=C5
-
Shipping
Room temperature in continental US; may vary elsewhere.
-
Storage
Please store the product under the recommended conditions in the Certificate of Analysis.


Publications (1)
-
Journal Impact Factor
-
Most Recent
-
J Exp Clin Cancer Res
Deubiquitylase YOD1 regulates CDK1 stability and drives triple-negative breast cancer tumorigenesis. [Abstract]2023 Sep 4;42(1):228. PMID: 37667382


Purity & Documentation
References

Calculators
Concentration (start) × Volume (start) = Concentration (final) × Volume (final)


CDK1-IN-4 Related Classifications
HY-151408 Related Classifications
 Powered by Bioz