



Geiparvarin
Geiparvarin is an anticancer agent and an inhibitor of MAO-B (pIC50 = 6.84 μM). Geiparvarin exerts anti-tumor effects by downregulating COX2 expression and inhibiting angiogenesis. Geiparvarin blocks the cell cycle at the G1 phase and induces apoptosis of cancer cells. Geiparvarin has anti-microtubule activity and destroys the cytoskeleton to exert anti-proliferative effects. Geiparvarin has research significance for lung cancer, leukemia, and breast cancer.
Nos produits utilisent uniquement pour la recherche. Nous ne vendons pas aux patients.
- CAS No.: 36413-91-9
- Formule: C19H18O5
- Masse moléculaire:326.34
-
Stockage:
Please store the product under the recommended conditions in the Certificate of Analysis.


To place orders, for customer services and technical support, please contact: MedChemExpress USA
Tel: 609-228-6898 E-mail: [email protected] [email protected]


-
 Activité biologique
-
Chemical Information
- Protocole
- Pureté et documentation
- Références
-
 Help & FAQs


-
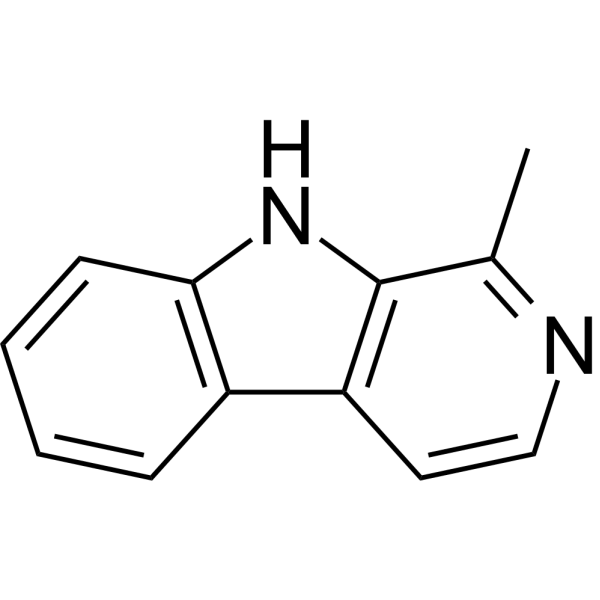
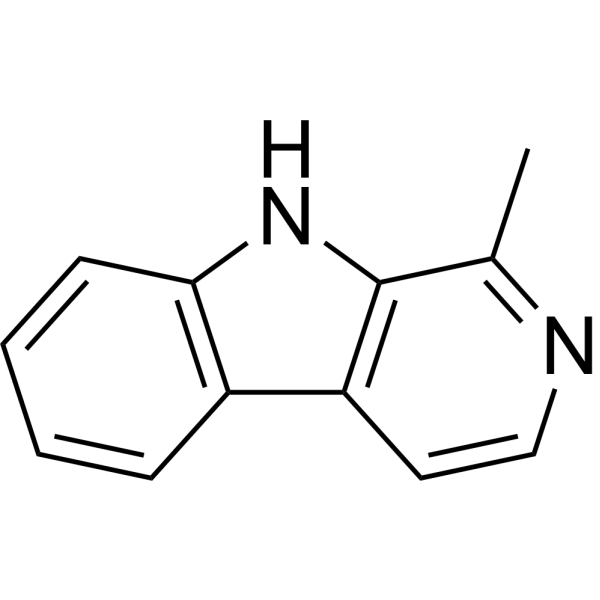
HY-101392
HarmaneMAO Inhibitor -
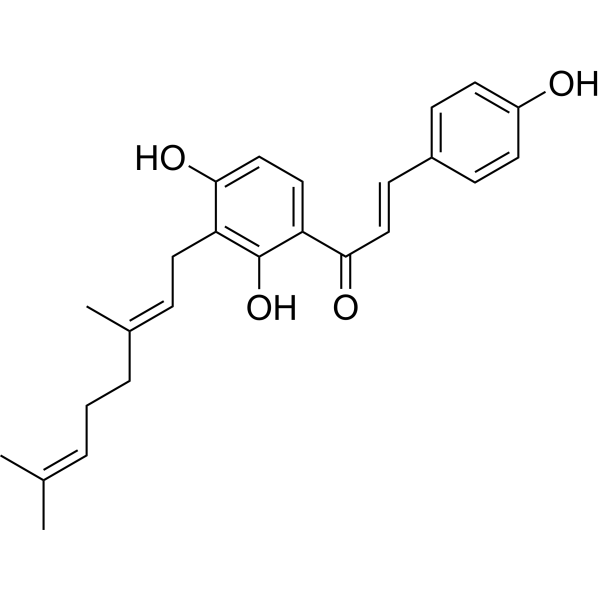
HY-111588
XanthoangelolApoptosis Inducer -
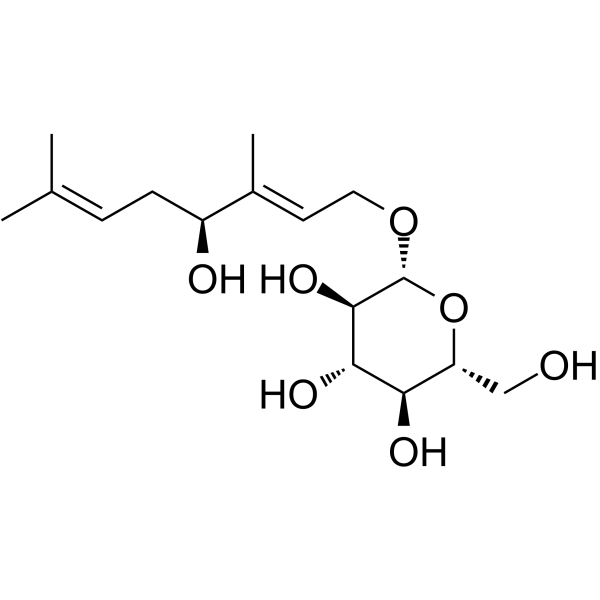
HY-N0505
RosiridinMAO A/B Inhibitor -
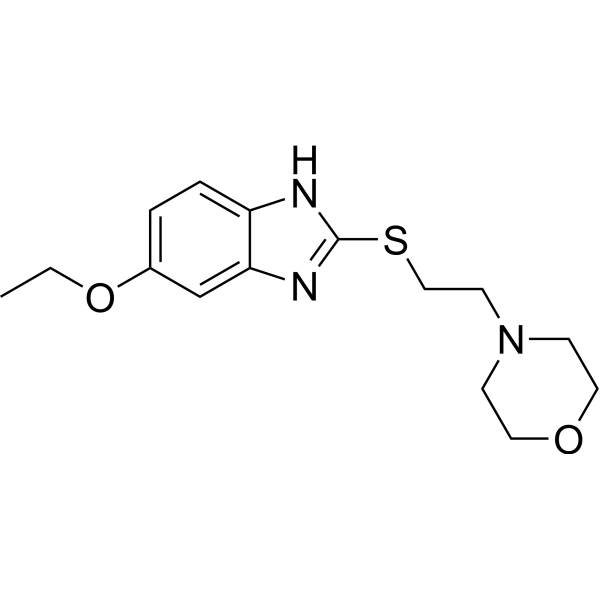
HY-14895
FabomotizoleAnxiolytic Drug -
HY-101392R
Harmane (Standard) -

HY-14895R
Fabomotizole (Standard)Anxiolytic Drug -

HY-N0505R
Rosiridin (Standard)MAO A/B Inhibitor -
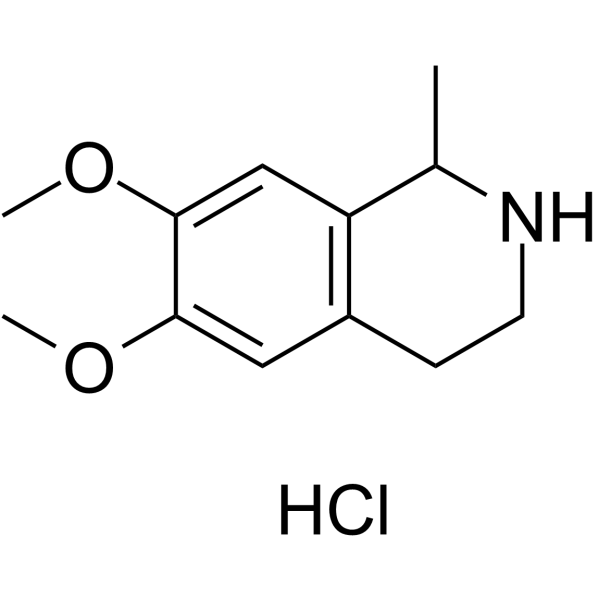
HY-22385A
Salsolidine hydrochlorideMAO A Inhibitor
Voir tous les produits spécifiques à Isoform Caspase
More

Activité biologique
Description
IC50 & Target
|
COX-2 |
Caspase 3 |
MAO-B 6.84 μM (pIC50) |
Cellular Effect
|
Cell Line

|
Type | Value | Description | References |
|---|---|---|---|---|
| A549 | IC50 |
18.02 μM
Compound: Geiparvarin
|
Cytotoxicity against human A549 cells by after 48 hrs by MTT assay
Cytotoxicity against human A549 cells by after 48 hrs by MTT assay
|
[PMID: 22579780] |
| FM3A | IC50 |
7.87 μg/mL
Compound: 1 (geiparvarin)
|
Inhibitory effect on the proliferation of murine mammary carcinoma FM3A cells
Inhibitory effect on the proliferation of murine mammary carcinoma FM3A cells
|
[PMID: 1588564] |
| HeLa | IC50 |
9.09 μM
Compound: Geiparvarin
|
Cytotoxicity against human HeLa cells by after 48 hrs by MTT assay
Cytotoxicity against human HeLa cells by after 48 hrs by MTT assay
|
[PMID: 22579780] |
| L02 | IC50 |
>300 μM
Compound: Geiparvarin
|
Cytotoxicity against human L02 cells by after 48 hrs by MTT assay
Cytotoxicity against human L02 cells by after 48 hrs by MTT assay
|
[PMID: 22579780] |
| L1210 | IC50 |
5.31 μg/mL
Compound: 1 (geiparvarin)
|
Inhibitory effect on the proliferation of murine leukemia L1210 cells.
Inhibitory effect on the proliferation of murine leukemia L1210 cells.
|
[PMID: 1588564] |
| MDA-MB-231 | IC50 |
9.88 μM
Compound: Geiparvarin
|
Cytotoxicity against human MDA-MB-231 cells by after 48 hrs by MTT assay
Cytotoxicity against human MDA-MB-231 cells by after 48 hrs by MTT assay
|
[PMID: 22579780] |
| MT4 | IC50 |
1.64 μg/mL
Compound: 1 (geiparvarin)
|
Inhibitory effect on the proliferation of human T-lymphocyte MT-4 cells.
Inhibitory effect on the proliferation of human T-lymphocyte MT-4 cells.
|
[PMID: 1588564] |
| Raji | IC50 |
8.25 μg/mL
Compound: 1 (geiparvarin)
|
Inhibitory effect on the proliferation of human B-lymphoblast Raji cells.
Inhibitory effect on the proliferation of human B-lymphoblast Raji cells.
|
[PMID: 1588564] |
| SGC-7901 | IC50 |
7.59 μM
Compound: Geiparvarin
|
Cytotoxicity against human SGC7901 cells by after 48 hrs by MTT assay
Cytotoxicity against human SGC7901 cells by after 48 hrs by MTT assay
|
[PMID: 22579780] |
| SW480 | IC50 |
20.34 μM
Compound: Geiparvarin
|
Cytotoxicity against human SW480 cells by after 48 hrs by MTT assay
Cytotoxicity against human SW480 cells by after 48 hrs by MTT assay
|
[PMID: 22579780] |
In Vitro
Geiparvarin (Compound 8) (72h) inhibits the proliferation of human tumor cell lines (IC50: 5.7 μM for SHSY5Y, 6.3 μM for HL-60, 9.2 μM for K562, 9.8 μM for HT-1080, 11.5 μM for A-549)[1].
Geiparvarin (8 μM, 24-72 h) arrests HL-60 cell cycle at the G1 phase and induces caspase-independent apoptosis[1].
Geiparvarin (72 h) shows complete inhibitory effects on drug-resistant cell lines and is not affected by transporters that mediate the efflux of antitumor drugs[1].
Geiparvarin (1 μM, 24 h) inhibits cell invasion ability in HOS and 143B cells[2].
Geiparvarin (0.5-2 μM, 24-48 h) activates apoptotic pathways in HOS and 143B cells, inhibits COX2 and downstream angiogenic pathways, and induces caspase-dependent apoptosis[2].
Geiparvarin exerts its antitumor effects in osteosarcoma cells by downregulating COX2, and overexpression of COX2 reverses its inhibition of proliferation and invasion[2].
Geiparvarin (10 μM, 24 h) disrupts the cytoskeleton, especially intermediate filaments, in Balb/c 3T3 fibroblasts[3].
Geiparvarin (0.01-10 μM) shows a significant increase in the inhibition rate of MAO-B extracted from rat liver mitochondria with increasing concentration, pIC50 = 6.84 (IC50 = 1.45 μM)[4].
MedChemExpress (MCE) has not independently confirmed the accuracy of these methods. They are for reference only.
-
Cell Line:K562 cells, HL-60 cells, HT-1080 cells, A-549 cells, SHSY5Y cells , CEM cells, CEM/Vbl100 cells, LoVo cells, LoVo/Doxo cells;
-
Concentration:
-
Incubation Time:72 h
-
Result:Had an IC50 range of 5.7 μM-11.5 μM in human tumor cell lines.
-
Cell Line:L02 cells, A-549 cells, HeLa cells, QGY-7701 cells, SW480 cells , SGC7901 cells, MDA-MB-231 cells
-
Concentration:
-
Incubation Time:48 h
-
Result:Had significant inhibitory activity against a variety of cancer cells (such as SGC7901: IC₅₀=7.59 μM; HeLa: IC₅₀=9.09 μM) and had low toxicity to normal liver cells L02 (IC₅₀>300 μM).
Ranged in IC₅₀ values of cells after treatment: 7.59-20.34 μM.
-
Cell Line:HOS Cells, 143B Cells, HL-60 cells
-
Concentration:0.5 μM, 1 μM, 2 μM for HOS Cells and 143B Cells 8 μM for HL-60 cells
-
Incubation Time:24 h, 48 h for HOS Cells and 143B Cells; 72 h for HL-60 cells
-
Result:Significantly increased Caspase-3 enzyme activity.
Reduced the proportion of G1 phase cells from 43.7 % to S phase cells from 34.8 % after 72 hours.
Induced DNA fragmentation in HL-60 cells.
Caused chromatin condensation and apoptotic body formation in HL-60 cells, as observed by electron microscopy.
-
Cell Line:HOS Cells, 143B Cells
-
Concentration:1 μM
-
Incubation Time:24 h
-
Result:Significantly reduced the number of cells penetrating the membrane.
-
Cell Line:HOS Cells, 143B Cells
-
Concentration:0.5 μM, 1 μM, 2 μM
-
Incubation Time:24 h, 48 h
-
Result:Down-regulated COX2, VEGF, CD31 (angiogenesis-related proteins) and up-regulated cleaved PARP/caspase-3 (apoptosis proteins).
-
Cell Line:Balb/c 3T3 fibroblasts
-
Concentration:10 μM
-
Incubation Time:24 h
-
Result:Slightly shortened microfilaments and reduced their density, inhibited microtubule polymerization, and caused the intermediate filament vimentin to reorganize into short fibers and accumulate around the nucleus.
In Vivo
MedChemExpress (MCE) has not independently confirmed the accuracy of these methods. They are for reference only.
-
Animal Model:143B/9901 cells xenograft tumor model in female nude mice (6 weeks)[2]
-
Dosage:0.5 mg/kg
-
Administration:Intraperitoneal injection (i.p.), every 3 days for several weeks; Intraperitoneal injection (i.p.),every day (for safety assessment)
-
Result:Significantly reduced the tumor volume and weight of the subcutaneous transplanted tumor model, and increased the apoptotic cells in the tumor tissue.
Inhibited the growth of primary tumors and lung metastasis, and reduced the number and size of lung metastatic nodules.
Increased the weight of mice, and there was no pathological damage to major organs.
- RNA extraction experimental
- Human pluripotent stem cell endothelial-cell differentiation
- Vascular/Branching Fractal Analysis
- Annexin V plus membrane-impermeant dye apoptosis staining
- BrdU Incorporation Assay
- Protocol for Cell Cycle
- Breast Cancer Modeling
- Phalloidin F-actin cytoskeleton staining
- Cell Viability Determination by MTT Colorimetric Assay
- Detection of Apoptosis
- TUNEL staining for apoptotic DNA fragmentation
- Flow cytometric DNA-content cell-cycle staining
- Endothelial Tube Formation Assay
- Apoptosis Solutions
- Endothelial Cell Migration/Angiogenic Sprouting Assay


Chemical Information
-
CAS No. 36413-91-9
-
Masse moléculaire 326.34
-
Formule C19H18O5
-
SMILES
C/C(C(OC(C)1C)=CC1=O)=C\COC2=CC=C(C=CC(O3)=O)C3=C2
-
Structure Classification
-
Initial Source
-
Livraison
Room temperature in continental US; may vary elsewhere.
-
Stockage
Please store the product under the recommended conditions in the Certificate of Analysis.


Pureté et documentation
Références
[1]. Giampietro Viola, et al. Synthesis, cytotoxicity, and apoptosis induction in human tumor cells by geiparvarin analogues. Chem Biodivers. 2004 Sep;1(9):1265-80. [Content Brief]
[2]. Bin Wang, et al. Geiparvarin Inhibits the Progression of Osteosarcoma by Down-regulating COX2 Expression. Chem Biodivers. 2004 Sep;1(9):1265-80. [Content Brief]
[3]. C Bocca, et al. Cytoskeleton-interacting activity of geiparvarin, diethylstilbestrol and conjugates. Chem Biol Interact. 2001 Sep 28;137(3):285-305. [Content Brief]
[4]. Angelo Carotti, et al. Natural and synthetic geiparvarins are strong and selective MAO-B inhibitors. Synthesis and SAR studies. Bioorg Med Chem Lett. 2002 Dec 16;12(24):3551-5. [Content Brief]
[5]. Yikai Zhang, et al. Convenient synthesis of novel geiparvarin analogs with potential anti-cancer activity via click chemistry. Eur J Med Chem. 2012 Jul:53:356-63. [Content Brief]

Calculators
Concentration (start) × Volume (start) = Concentration (final) × Volume (final)


Geiparvarin Related Classifications
HY-N15657 Related Classifications
 Powered by Bioz