



SHP2/CDK4-IN-1
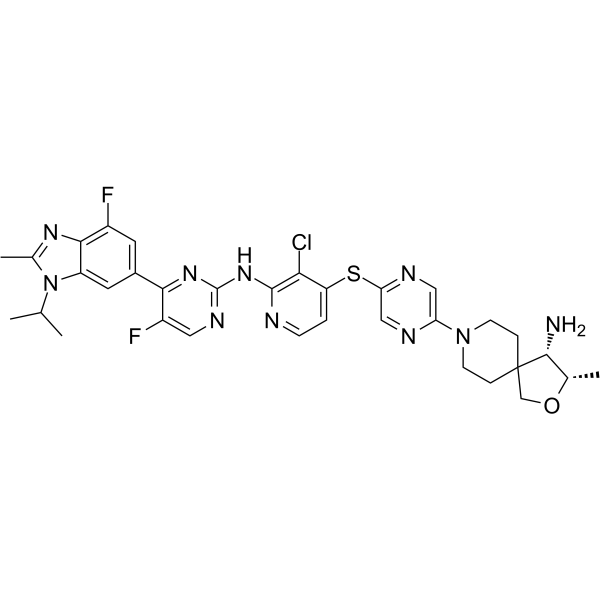
SHP2/CDK4-IN-1 (compound 10) is an orally active and potent SHP2 and CDK4 dual inhibitor, with IC50 values of 4.3 and 18.2 nM, respectively. SHP2/CDK4-IN-1 effectively induces G0/G1 arrest to prevent the proliferation of TNBC cell lines. SHP2/CDK4-IN-1 shows significant antitumor efficacy in the EMT6 syngeneic mouse model. SHP2/CDK4-IN-1 can be used for triple-negative breast cancer (TNBC) research.
For research use only. We do not sell to patients.
- CAS No.: 2924036-87-1
- Formula: C33H35ClF2N10OS
- Molecular Weight:693.21
-
Storage:
Please store the product under the recommended conditions in the Certificate of Analysis.

To place orders, for customer services and technical support, please contact: MedChemExpress USA
Tel: 609-228-6898 E-mail: [email protected] [email protected]


-
 Biological Activity
-
Chemical Information
- Protocols
- Purity & Documentation
- References
-
 Help & FAQs




Biological Activity
Description
IC50 & Target
|
CDK4 18.2 ± 1.3 nM (IC50) |
Cellular Effect
|
Cell Line

|
Type | Value | Description | References |
|---|---|---|---|---|
| EMT6 | IC50 |
0.64 μM
Compound: 10
|
Antiproliferative activity against mouse EMT6 cells assessed as inhibition of cell growth incubated for 48 hrs by MTT assay
Antiproliferative activity against mouse EMT6 cells assessed as inhibition of cell growth incubated for 48 hrs by MTT assay
|
[PMID: 35447031] |
| MDA-MB-231 | IC50 |
5.57 μM
Compound: 10
|
Antiproliferative activity against human MDA-MB-231 cells assessed as inhibition of cell growth incubated for 48 hrs by MTT assay
Antiproliferative activity against human MDA-MB-231 cells assessed as inhibition of cell growth incubated for 48 hrs by MTT assay
|
[PMID: 35447031] |
| MDA-MB-468 | IC50 |
1.76 μM
Compound: 10
|
Antiproliferative activity against human MDA-MB-468 cells assessed as inhibition of cell growth incubated for 48 hrs by MTT assay
Antiproliferative activity against human MDA-MB-468 cells assessed as inhibition of cell growth incubated for 48 hrs by MTT assay
|
[PMID: 35447031] |


Chemical Information
-
CAS No. 2924036-87-1
-
Molecular Weight 693.21
-
Formula C33H35ClF2N10OS
-
SMILES
CC(C)N1C(C)=NC2=C(C=C(C=C12)C3=NC(NC4=C(C(SC5=NC=C(N=C5)N6CCC7([C@H](N)[C@H](C)OC7)CC6)=CC=N4)Cl)=NC=C3F)F
-
Shipping
Room temperature in continental US; may vary elsewhere.
-
Storage
Please store the product under the recommended conditions in the Certificate of Analysis.

Protocols
-
Flow cytometric DNA-content cell-cycle staining
Flow cytometric DNA-content cell-cycle staining measures the fluorescence intensity of DNA-bound fluorochromes in single cells or nuclei to estimate DNA content distributions, allowing assignment of populations to G0/G1, S, and G2/M phases by DNA histogram deconvolution. Propidium iodide (PI) intercalates into DNA, and PI fluorescence is proportional to cellular DNA content when staining is performed under conditions that make DNA accessible and minimize non-DNA signal. Cells with G2/M DNA content are expected to show approximately twice the fluorescence intensity of G0/G1 cells, while S-phase cells occupy intermediate fluorescence values. PI-based DNA-content analysis can also detect cells with fractional DNA content, often reported as sub-G1, when DNA fragmentation and extraction during staining reduce retained DNA signal in apoptotic cells. DAPI is an alternative DNA fluorochrome for univariate DNA-content analysis, while bivariate approaches combining DNA content with proliferation
-
Patient-Derived Xenograft (PDX)
Patient-derived xenograft (PDX) models are generated by engrafting primary human tumor tissue directly into immunodeficient mice, allowing in vivo propagation of patient tumor biology without initial in vitro adaptation. These models are used to preserve key histopathological and molecular characteristics of the original tumor and enable assessment of tumor growth dynamics and therapeutic response in a living organism. The biological readout is tumor engraftment and subsequent growth in the murine host, which reflects the ability of human tumor cells to survive, vascularize, and expand in an immunocompromised microenvironment.
-
Protocol for Cell Cycle
Cell-cycle analysis by flow cytometry measures DNA content in single cells to estimate the fraction of cells in G0/G1, S, and G2/M phases. Propidium iodide intercalates into DNA, and after RNA removal with RNase, fluorescence intensity reflects cellular DNA content: 2N cells are assigned to G0/G1, cells between 2N and 4N to S phase, and 4N cells to G2/M. DNA-content analysis alone cannot reliably separate G0 from G1 or G2 from M. Ki-67 can distinguish quiescent G0 cells from cycling cells, EdU or BrdU incorporation marks active DNA synthesis in S phase, and phospho-histone H3 staining identifies mitotic cells within the 4N population.
-
Breast Cancer Modeling
Breast cancer is a heterogeneous cancer, and it has been distinguished into four subtypes: luminal A, luminal B, HER2-positive and basal-like. Molecular mutations, epigenetic alterations, hormone exposure and immune microenvironment are related to the progression of breast cancer.
-
Cell Viability Determination by MTT Colorimetric Assay
The following protocol uses the MTT colorimetric assay as a classic literature-established method for assessing cell viability/metabolic activity in cultured mammalian cells. MTT[3-(4,5-dimethylthiazol-2-yl)-2,5-diphenyltetrazolium bromide] is reduced by metabolically active cells to a colored formazan product; the amount of formazan is quantified spectrophotometrically and provides an indirect measure of metabolically active viable cells. Importantly, MTT reduction reflects cellular oxidoreductase/metabolic activity rather than an absolute direct count of living cells, so changes in cellular metabolism can alter the signal independently of cell number.
-
How to Choose the Right Model Animal
Choosing the right model animal is a validity-driven decision in which the species, strain, sex, age, genetic background, disease-induction method, outcome measures, and welfare burden must match the scientific question rather than laboratory tradition or convenience. A model should be selected by judging face validity, construct validity, and predictive validity: whether it resembles the human phenotype, whether it reproduces relevant mechanisms, and whether results are likely to predict human biology or treatment response. Animal studies often fail to translate because of species differences, weak disease resemblance, poor experimental design, inadequate reporting, publication bias, and underuse of randomization, blinding, and sample-size justification. Unresolved questions include how to rank competing models objectively, how much human-disease complexity must be reproduced for a given objective, and when non-animal systems such as organoids, ex vivo tissue, or computational models


Purity & Documentation
References

Calculators
Concentration (start) × Volume (start) = Concentration (final) × Volume (final)


SHP2/CDK4-IN-1 Related Classifications
HY-150609 Related Classifications
 Powered by Bioz