



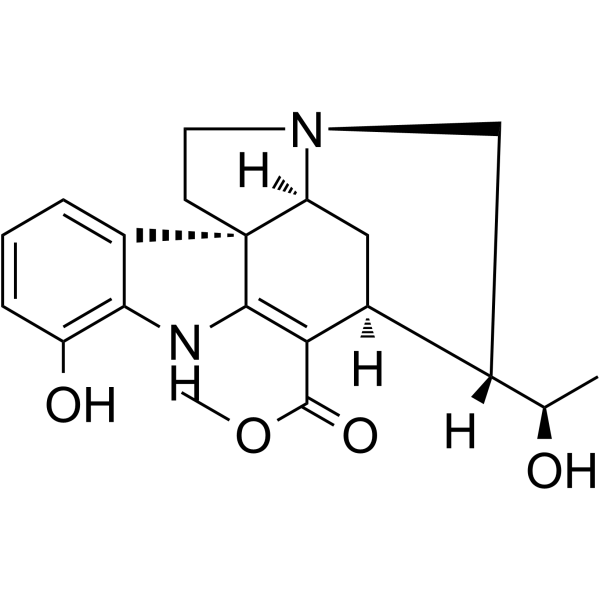
19-epi-Scholaricine

Based on 1 Customer Validation
19-epi-Scholaricine is an orally active indole alkaloid. 19-epi-Scholaricine downregulates the expression of profibrotic/apoptotic proteins (HRAS, HSP90AA1, KDR) and upregulates the expression of cell cycle-related protein (CDK2). 19-epi-Scholaricine suppresses ROS production and reduces the release of inflammatory mediators, thereby attenuating podocyte apoptosis, renal inflammation and oxidative stress by inhibiting AKT/mTOR. 19-epi-Scholaricine can be used in the research of chronic glomerulonephritis and membranous nephropathy.
Nos produits utilisent uniquement pour la recherche. Nous ne vendons pas aux patients.
- Pureté : 99.14%
- CAS No.: 132923-06-9
- Formule: C20H24N2O4
- Masse moléculaire:356.42
-
Stockage:
4°C, protect from light
* In solvent : -80°C, 6 months; -20°C, 1 month (protect from light)

To place orders, for customer services and technical support, please contact: MedChemExpress USA
Tel: 609-228-6898 E-mail: [email protected] [email protected]


-
 Activité biologique
-
Chemical Information
- Protocole
- Pureté et documentation
- Références
-
 Help & FAQs


Voir tous les produits spécifiques à Isoform VEGFR
MoreVoir tous les produits spécifiques à Isoform TNF Receptor
More

Activité biologique
Description
In Vitro
19-epi-Scholaricine (10-50 μM; 24 h) protects ADR-stimulated MPC5 cells from injury, and significantly increases cell viability after 24 h of treatment at the concentration of 50 μM[1].
19-epi-Scholaricine (50 μM; 24 h) regulates the expression of CGN-related targets in ADR-induced MPC5 cells, downregulating HRAS, HSP90AA1 and KDR while upregulating CDK2[1].
19-epi-Scholaricine (50 μM; 24 h) significantly reduces the level of ROS production in ADR-stimulated MPC5 cells[1].
19-epi-Scholaricine (1-20 μM; 25 h) inhibits the release of NO in LPS (HY-D1056)-induced mouse podocyte MPC5 cells[2].
19-epi-Scholaricine (1 μM; 25 h) downregulates the gene expression of Tnf-α and Il-6 in LPS-induced mouse podocyte cell line MPC5[2].
19-epi-Scholaricine (1 μM; 25 h) upregulates the expression of circadian rhythm and AKT/mTOR pathway genes in LPS-stimulated mouse podocyte cell line MPC5[2].
19-epi-Scholaricine (1 μM; 24 h) reduces lipopolysaccharide (LPS)-induced reactive oxygen species (ROS) production in the mouse podocyte cell line MPC5[2].
19-epi-Scholaricine (1 μM; 24 h) restores the mitochondrial membrane potential of LPS-stimulated mouse podocytes MPC5[2].
MedChemExpress (MCE) has not independently confirmed the accuracy of these methods. They are for reference only. Further protocols information, click here.
-
Cell Line:adriamycin (ADR)-stimulated murine glomerular podocyte (MPC5) cells
-
Concentration:10, 20, 40 and 50 μM
-
Incubation Time:24 h
-
Result:Increased the survival rate of ADR-stimulated MPC5 cells; the 50 μM concentration produced a statistically significant increase relative to the ADR-only model group.
-
Cell Line:adriamycin (ADR)-stimulated murine glomerular podocyte (MPC5) cells
-
Concentration:50 μM
-
Incubation Time:24 h
-
Result:Downregulated the protein expression of HRAS, HSP90AA1, and KDR, and upregulated the protein expression of CDK2 in ADR-stimulated MPC5 cells, reversing the expression changes induced by ADR.
-
Cell Line:adriamycin (ADR)-stimulated murine glomerular podocyte (MPC5) cells
-
Concentration:50 μM
-
Incubation Time:24 h
-
Result:Downregulated the mRNA expression of hras, hsp90aa1, and kdr and upregulated the mRNA expression of cdk2 in ADR-stimulated MPC5 cells, reversing the expression changes induced by ADR.
-
Cell Line:MPC5 murine podocytes (LPS-stimulated)
-
Concentration:1 μM
-
Incubation Time:1 h pre-incubation, then 24 h LPS stimulation
-
Result:Significantly reduced the LPS-induced expression of Tnf-α and IL-6 genes in MPC5 cells, restoring levels to near normal.\nUpregulated the expression of Arntl, Cry1, Akt, mTor, and Bcl-2/Bax genes in LPS-stimulated MPC5 cells.
In Vivo
19-epi-scholaricine (1.0 mg/kg; oral gavage; daily; 6 weeks) exhibits superior or comparable therapeutic efficacy to prednisone at 2 mg/kg in a mouse model of membranous nephropathy, as evidenced by reduced urinary protein, restored renal function, suppressed inflammation and oxidative stress, improved histopathology, and modulation of the ARNTL/AKT/mTOR pathway[2].
MedChemExpress (MCE) has not independently confirmed the accuracy of these methods. They are for reference only.
-
Animal Model:ICR mice (male, 32-36 g, adriamycin-induced)[1]
-
Dosage:1 mg/kg
-
Administration:p.o.; daily; 28 days
-
Result:Reduced urinary protein levels from 11.51 mg/24 h (model group) to 8.84 mg/24 h at day 7.
Attenuated the ADR-induced decrease in serum albumin (ALB) from 30.74 U/L (model group) to 35.92 U/L, and in serum total protein (TP) from 51.01 U/L (model group) to 55.63 U/L.
Reduced serum urea nitrogen (BUN) levels from 9.49 μmol/L (model group) to 8.44 μmol/L.
Ameliorated kidney histopathological damage, including reduced diffuse proliferation of glomerular tracts and decreased lymphocyte/plasma cell infiltration.
-
Animal Model:ICR (male, 25 ± 3 g, membranous nephropathy induced by 5 mg/kg C-BSA tail vein injection every 3 days for 6 doses)[2]
-
Dosage:1.0 mg/kg
-
Administration:oral gavage; daily; 6 weeks
-
Result:Reduced 24-hour urinary protein from 9.9 to 6.2 mg.
Increased the urine creatinine (Ucr)/blood creatinine (Scr) ratio from 42.7 to 76.5.
Decreased renal C3 deposition integrated fluorescence signal from 2.1 to 0.52.
Reduced renal IL-1β expression from 4.4 to 1.4.
Normalized oxidative stress markers (malondialdehyde, glutathione, superoxide dismutase, catalase) in kidney homogenates.
Ameliorated histopathological renal lesions including lymphocyte infiltration, loosely stained cytoplasm, and glomerular basement membrane (GBM) thickening to near-normal levels.
Upregulated renal expression of circadian rhythm genes (Arntl, Cry1) and downregulated phosphorylated AKT/mTOR pathway components.


Chemical Information
-
CAS No. 132923-06-9
-
Appearance Solid
-
Masse moléculaire 356.42
-
Formule C20H24N2O4
-
Color Light yellow to light brown
-
SMILES
O=C(C1=C2[C@]3(C4=CC=CC(O)=C4N2)[C@@](C[C@@]1([H])[C@@]5([H])[C@H](O)C)([H])N(C5)CC3)OC
-
Livraison
Room temperature in continental US; may vary elsewhere.
-
Stockage
4°C, protect from light
* In solvent : -80°C, 6 months; -20°C, 1 month (protect from light)

Protocole
-
RNA extraction experimental
By lysing cells, releasing RNA, and removing impurities such as proteins and DNA, high-purity RNA products are finally obtained. The commonly used traditional method is the guanidine isothiocyanate/phenol/chloroform method (Trizol), which is suitable for a variety of animal materials including animal tissues, microorganisms, cultured cells, etc., and most plant materials.
-
Apoptosis
Apoptosis, also called programmed cell death, is generally characterized by distinct morphological characteristics.
-
TUNEL staining for apoptotic DNA fragmentation
TUNEL staining detects DNA strand breaks by using terminal deoxynucleotidyl transferase to add labeled nucleotides to exposed 3′-OH DNA termini, generating either microscopic staining in fixed cells or tissue sections, or fluorescence/cytometric signal in cell suspensions. TUNEL positivity reflects DNA fragmentation but should not be interpreted alone as definitive apoptosis, because TUNEL can also label necrotic, autolytic, mechanically damaged, or DNA-repair-associated DNA breaks.
-
Flow cytometric DNA-content cell-cycle staining
Flow cytometric DNA-content cell-cycle staining measures the fluorescence intensity of DNA-bound fluorochromes in single cells or nuclei to estimate DNA content distributions, allowing assignment of populations to G0/G1, S, and G2/M phases by DNA histogram deconvolution. Propidium iodide (PI) intercalates into DNA, and PI fluorescence is proportional to cellular DNA content when staining is performed under conditions that make DNA accessible and minimize non-DNA signal. Cells with G2/M DNA content are expected to show approximately twice the fluorescence intensity of G0/G1 cells, while S-phase cells occupy intermediate fluorescence values. PI-based DNA-content analysis can also detect cells with fractional DNA content, often reported as sub-G1, when DNA fragmentation and extraction during staining reduce retained DNA signal in apoptotic cells. DAPI is an alternative DNA fluorochrome for univariate DNA-content analysis, while bivariate approaches combining DNA content with proliferation
-
Annexin V plus membrane-impermeant dye apoptosis staining
Annexin V-based apoptosis assays rely on the detection of phosphatidylserine (PS) externalization from the inner leaflet of the plasma membrane to the outer leaflet, an early biochemical hallmark of apoptosis. Fluorescently labeled Annexin V binds PS in a calcium-dependent manner, enabling identification of early apoptotic cells by flow cytometry or fluorescence microscopy. When combined with a membrane-impermeant DNA-binding dye (e. g. , propidium iodide), this approach allows discrimination between viable (Annexin V−/dye−), early apoptotic (Annexin V+/dye−), and late apoptotic or necrotic (Annexin V+/dye+) cell populations by assessing membrane integrity and PS exposure.
-
BrdU Incorporation Assay
Bromodeoxyuridine (BrdU) incorporation assay is based on the principle that BrdU, a thymidine analog, is incorporated into newly synthesized DNA during the S phase of the cell cycle, thereby serving as a marker of DNA replication and cellular proliferation. Incorporated BrdU can be detected using anti-BrdU antibodies following DNA denaturation, enabling visualization or quantification of proliferating cells through immunochemical detection methods such as immunofluorescence or immunohistochemistry.
-
ROS/oxidative-stress fluorescent staining
ROS/oxidative-stress fluorescent staining uses cell-permeant fluorogenic probes that become fluorescent after oxidation inside cells or tissues; commonly used examples include DCFH-DA/DCFDA for broad cellular oxidant detection, DHE for superoxide-related signal detection, MitoSOX for mitochondrial superoxide-related signal detection, and CellROX probes for oxidative-stress-associated fluorescence readouts. The assay detects probe oxidation rather than a single ROS species unless the probe and analysis method have been chemically validated for that species. DCFH-DA enters cells, is deacetylated by intracellular esterases to DCFH, and produces fluorescent DCF after oxidation, so the readout is used as an operational measure of total cellular oxidative stress rather than a species-specific ROS measurement. DHE and MitoSOX can report superoxide-related oxidation, but red fluorescence alone can include non-specific ethidium-like oxidation products; HPLC or optimized spectral approaches are
-
Apoptosis Solutions
Apoptosis is a regulated, generally non-lytic cell-death pathway that removes unwanted, damaged, infected, or abnormal cells through coordinated morphological changes, caspase activation, DNA fragmentation, and membrane remodeling. The intrinsic apoptosis pathway is controlled mainly by mitochondrial outer membrane permeabilization, BCL-2 family proteins, cytochrome c release, apoptosome formation, caspase-9 activation, and downstream executioner caspase-3/7 activation. The extrinsic apoptosis pathway is initiated by death receptors such as Fas, TNFR, and TRAIL receptors, which recruit adaptor proteins and activate caspase-8 before engaging executioner caspases or mitochondrial amplification through BID cleavage. Apoptosis is linked to many phenotypes, including cancer cell killing, tissue homeostasis, immune regulation, neurodegeneration, infection response, and treatment-induced cytotoxicity; unresolved questions include how apoptosis interacts with necroptosis, pyroptosis, ferroptos
-
Protocol for Cell Cycle
Cell-cycle analysis by flow cytometry measures DNA content in single cells to estimate the fraction of cells in G0/G1, S, and G2/M phases. Propidium iodide intercalates into DNA, and after RNA removal with RNase, fluorescence intensity reflects cellular DNA content: 2N cells are assigned to G0/G1, cells between 2N and 4N to S phase, and 4N cells to G2/M. DNA-content analysis alone cannot reliably separate G0 from G1 or G2 from M. Ki-67 can distinguish quiescent G0 cells from cycling cells, EdU or BrdU incorporation marks active DNA synthesis in S phase, and phospho-histone H3 staining identifies mitotic cells within the 4N population.
-
Research Protocol for Inflammation-related Diseases
The NLRP3 inflammasome is a cytosolic innate immune signaling platform that integrates priming signals and danger-signal activation to promote caspase-1 activation, maturation of IL-1β and IL-18, and gasdermin D-mediated pyroptotic cell death. The core experimental logic is to determine whether inflammatory disease phenotypes are driven by increased NLRP3 expression, ASC-containing inflammasome assembly, caspase-1 cleavage, GSDMD cleavage, and extracellular release of IL-1β/IL-18 rather than by nonspecific cell injury alone. The pathway is strongly linked to inflammation-related disease phenotypes because monosodium urate crystals activate NALP3/NLRP3 inflammasome signaling in gout-like crystal inflammation, cholesterol crystals activate NLRP3 inflammasomes in atherogenesis models, and DSS-induced intestinal inflammation has been reported to involve NLRP3 inflammasome activity. However, experimental colitis studies also show context-dependent protective effects of NLRP3 inflammasome co


Pureté et documentation
-
Fiche technique (284 KB)
-
SDS (252 KB)
- English - EN (252 KB)
- Français - FR (252 KB)
- Deutsch - DE (252 KB)
- Norwegian - NO (252 KB)
- Español - ES (252 KB)
- Swedish - SV (252 KB)
- Italian - IT (252 KB)
- Korean - KR (252 KB)
- Portuguese - PT (252 KB)
-
Instruction de manipulation (2659 KB)
Références
[1]. Guo R, et al. Pharmacological investigation of indole alkaloids from Alstonia scholaris against chronic glomerulonephritis. Phytomedicine. 2023;118:154958. [Content Brief]
[2]. Tian CB, et al. Managing circadian rhythm involved in alleviating membranous nephropathy by alkaloids of Alstonia scholaris. Phytomedicine. 2025;148:157467. [Content Brief]

Calculators
Concentration (start) × Volume (start) = Concentration (final) × Volume (final)


19-epi-Scholaricine Related Classifications
HY-N10379 Related Classifications
 Powered by Bioz