



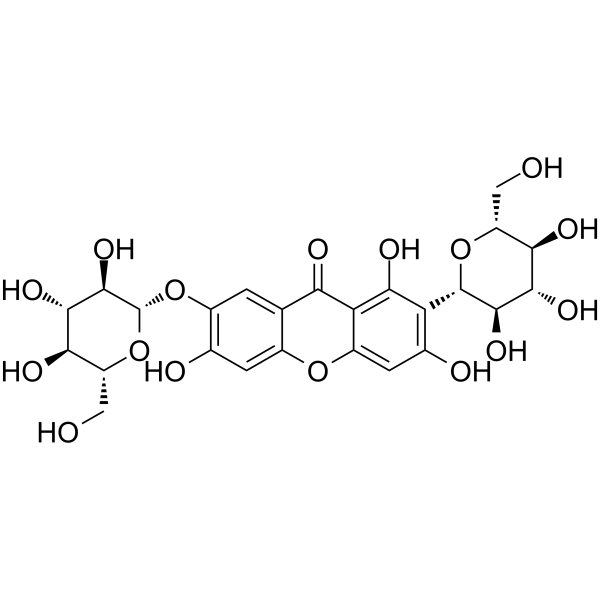
Neomangiferin
Based on 1 publication(s) in Google Scholar
Neomangiferin is an orally active natural flavonoid. Neomangiferin partially ameliorates non-alcoholic fatty liver disease (NAFLD) by regulating the expression of genes related to free fatty acid uptake and lipid oxidation. Neomangiferin exerts anti-colitis effects by inhibiting Th17/Treg cell differentiation. Neomangiferin exerts anti-aging and lifespan-extending effects by targeting upregulation of bas-1, which in turn activates the autophagy, IIS and MAPK pathways. Neomangiferin has the potential to prevent aseptic loosening of prostheses after total joint arthroplasty due to its significant anti-inflammatory and osteoclastogenesis-inhibiting effects.
For research use only. We do not sell to patients.
- Purity : 99.80%
- CAS No.: 64809-67-2
- Formula: C25H28O16
- Molecular Weight:584.48
-
Storage:
4°C, protect from light
* In solvent : -80°C, 6 months; -20°C, 1 month (protect from light)

To place orders, for customer services and technical support, please contact: MedChemExpress USA
Tel: 609-228-6898 E-mail: [email protected] [email protected]


-
 Biological Activity
-
Chemical Information
-
Solvent & Solubility
- Protocols
- Purity & Documentation
- References
-
 Help & FAQs



Publications Citing Use of MedChemExpress (MCE) Neomangiferin
More

Biological Activity
Description
In Vitro
Neomangiferin (5, 10, 20 μM; 5 days) suppresses TGFβ/IL-6-induced Th17 cell differentiation in purified splenic CD4+ T cells from C57BL/6J mice, reducing IL-17 and RORγt expression[2].
Neomangiferin (5, 10, 20 μM; 5 days) promotes anti-CD3/anti-CD28-induced Treg cell differentiation in purified splenic T cells from C57BL/6J mice, increasing IL-10 expression[2].
MedChemExpress (MCE) has not independently confirmed the accuracy of these methods. They are for reference only. Further protocols information, click here.
In Vivo
Neomangiferin (10-20 mg/kg; p.o.; once daily; for 3 consecutive days) ameliorates TNBS-induced colitis in male C57BL/6J mice by inhibiting proinflammatory cytokine production and restoring the Th17/Treg balance; at the dose of 20 mg/kg, it inhibits myeloperoxidase activity by 73.9% and reduces IL-17 levels by 63.6%[2].
Neomangiferin (20 mg/kg; p.o.; daily; for 3 consecutive weeks) improves spontaneous chronic colitis in male C57BL/6 IL-10 knockout mice by reducing the production of proinflammatory cytokines, inhibiting myeloperoxidase activity by 52.6%, and restoring the Th17/Treg balance[2].
Neomangiferin (2.5-5 mg/kg, i.p., once every other day for 21 consecutive days) dose-dependently inhibits UHMWPE particle-induced inflammatory calvarial osteolysis in mice[3].
MedChemExpress (MCE) has not independently confirmed the accuracy of these methods. They are for reference only.
-
Animal Model:Sprague-Dawley (SD) (male, 7-week-old, 200 g, high-fat diet-induced NAFLD)[1]
-
Dosage:50 mg/kg·day-1 BW; 25 mg/kg·day-1 BW
-
Administration:oral gavage; daily; 13 weeks
-
Result:Significantly decreased body weight compared to HF control group after 3 weeks of treatment; by week 8, reduced body weight to normal control levels with high-dose treatment.
Significantly lowered relative weights of organs (liver, spleen, testicle, brain, heart) and adipose tissues (abdominal, perirenal, subcutaneous, epididymal fat) with high-dose treatment compared to HF control group.
Reduced serum triglyceride (TG), total cholesterol (TC), low-density lipoprotein cholesterol (LDL-C), alanine aminotransferase (ALT), aspartate aminotransferase (AST), AST/ALT ratio, glucose (GLU), and D-3-hydroxybutyric acid (D-3H) levels, and increased serum high-density lipoprotein cholesterol (HDL-C) levels and HDL-C/TC ratio after 13 weeks of treatment compared to HF control group.
Decreased hepatic TG, TC, and malondialdehyde (MDA) levels, and increased hepatic superoxide dismutase (SOD) and glutathione peroxidase (GSH-PX) levels compared to HF control group.
Increased fecal TG and TC levels compared to HF control group.
Reduced liver fat content from 43.6% (HF control) to a statistically significant lower level, decreased body fat content, and restored brown adipose tissue size with high-dose treatment compared to HF control group.
Significantly reduced hepatic fatty droplets, lipid accumulation, and renal lipid droplet accumulation compared to HF control group.
Lowered blood glucose levels at 30, 60, 90, and 120 minutes post-glucose gavage, and reduced glucose area under the curve (AUC) compared to HF control group.
Increased respiratory exchange rate (RER), oxygen consumption (VO2), and carbon dioxide production (VCO2) with high-dose treatment compared to HF control group, correcting diurnal metabolic rhythm defect.
Upregulated hepatic mRNA and protein expression of peroxisome proliferator-activated receptor α (PPARα) and carnitine palmitoyltransferase 1a (CPT1a), and downregulated hepatic mRNA and protein expression of fatty acid transport protein 2 (FATP2) and long-chain-fatty-acid-CoA ligase 1 (ACSL1) after 13 weeks of treatment compared to HF control group.
-
Animal Model:C57BL/6J (male, 6 weeks old, 20-23 g, TNBS-induced colitis)[2]
-
Dosage:10 mg/kg; 20 mg/kg
-
Administration:p.o.; daily; 3 days
-
Result:Inhibited TNBS-induced colon shortening.
Reduced macroscopic colitis scores.
Suppressed myeloperoxidase activity by 73.9% (20 mg/kg dose).
Prevented TNBS-induced reduction in tight junction proteins ZO-1, occludin, and claudin-1.
Inhibited TNBS-induced ERK phosphorylation, NF-κB activation, and expression of inducible nitric oxide synthase and cyclooxygenase-2.
Reduced colon tissue levels of TNF-α by 45.5%, IL-1β by 78.1%, IL-17 by 63.6%, and IL-6 by 85.5%, while increasing IL-10 expression (20 mg/kg dose).
Inhibited TNBS-induced Th17 cell differentiation in colonic lamina propria and increased Treg cell differentiation.
Attenuated TNBS-mediated upregulation of IL-17, IFN-γ, RORγt, and T-bet mRNA, and restored TNBS-suppressed IL-10, IL-5, Foxp3, and GATA3 mRNA expression.
-
Animal Model:C57BL/6 IL-10 knockout (male, 13 weeks old at treatment initiation, 18-21 g, spontaneous chronic colitis)[2]
-
Dosage:20 mg/kg
-
Administration:p.o.; daily; 3 weeks
-
Result:Reduced colonic myeloperoxidase activity by 52.6%.
Improved histopathological severity of colitis.
Increased expression of tight junction proteins ZO-1, occludin, and claudin-1.
Inhibited infiltration of antigen-presenting cells.
Suppressed ERK phosphorylation, NF-κB activation, and expression of inducible nitric oxide synthase and cyclooxygenase-2.
Reduced colon tissue levels of TNF-α by 17.3%, IL-1β by 54.5%, IFN-γ by 27.8%, and IL-17 by 52.8%.
Inhibited Th17 cell differentiation in colonic lamina propria and increased Treg cell differentiation.
Suppressed IL-17 and RORγt mRNA expression.
-
Animal Model:C57BL/6 (8-week-old male, specific pathogen free grade, UHMWPE particles implanted into calvarial subperiosteal space)[3]
-
Dosage:2.5 mg/kg; 5 mg/kg
-
Administration:i.p.; every other day; 21 days
-
Result:Significantly increased bone mineral density (BMD) and bone volume/tissue volume ratio (BV/TV), and decreased the number of bone resorption pits and total skull porosity compared to the vehicle group, with 5 mg/kg group showing greater improvement than 2.5 mg/kg group.
Significantly reduced the number of TRAP-positive osteoclasts and the area of calvarial bone erosion compared to the vehicle group, with 5 mg/kg group showing greater reduction than 2.5 mg/kg group.
Significantly reduced serum levels of TNF-α, IL-1β, RANKL, OSCAR, and CTX-1, and increased serum OPG levels compared to the vehicle group, with 5 mg/kg group showing greater reductions in proinflammatory cytokines and osteoclast markers, and greater increase in OPG, than 2.5 mg/kg group.


Chemical Information
-
CAS No. 64809-67-2
-
Appearance Solid
-
Molecular Weight 584.48
-
Formula C25H28O16
-
Color White to light yellow
-
SMILES
OC1=C(C2=O)C(OC3=CC(O)=C(O[C@@H]([C@@H]([C@@H](O)[C@@H]4O)O)O[C@@H]4CO)C=C23)=CC(O)=C1[C@@H]([C@@H]([C@@H](O)[C@@H]5O)O)O[C@@H]5CO
-
Structure Classification
-
Initial Source
-
Shipping
Room temperature in continental US; may vary elsewhere.
-
Storage
4°C, protect from light
* In solvent : -80°C, 6 months; -20°C, 1 month (protect from light)


Publications (1)
-
Journal Impact Factor
-
Most Recent


Solvent & Solubility
In Vitro:
DMSO : 100 mg/mL (171.09 mM; Need ultrasonic; Hygroscopic DMSO has a significant impact on the solubility of product, please use newly opened DMSO)
Please refer to the solubility information to select the appropriate solvent. Once prepared, please aliquot and store the solution to prevent product inactivation from repeated freeze-thaw cycles.
Storage method and period of stock solution: -80°C, 6 months; -20°C, 1 month (protect from light). When stored at -80°C, please use it within 6 months. When stored at -20°C, please use it within 1 month.
Please refer to the solubility information to select the appropriate solvent. Once prepared, please aliquot and store the solution to prevent product inactivation from repeated freeze-thaw cycles.
Storage method and period of stock solution: -80°C, 6 months; -20°C, 1 month (protect from light). When stored at -80°C, please use it within 6 months. When stored at -20°C, please use it within 1 month.
Concentration (start) × Volume (start) = Concentration (final) × Volume (final)
In Vivo:
Select the appropriate dissolution method based on your experimental animal and administration route.
- For the following dissolution methods, please ensure to first prepare a clear stock solution using an In Vitro approach and then sequentially add co-solvents:
- To ensure reliable experimental results, the clarified stock solution can be appropriately stored based on storage conditions. As for the working solution for In Vivo experiments, it is recommended to prepare freshly and use it on the same day.
- The percentages shown for the solvents indicate their volumetric ratio in the final prepared solution. If precipitation or phase separation occurs during preparation, heat and/or sonication can be used to aid dissolution.
Add each solvent one by one: 10% DMSO 40% PEG300 5% Tween-80 45% Saline
Solubility: ≥ 2.5 mg/mL (4.28 mM); Clear solution
This protocol yields a clear solution of ≥ 2.5 mg/mL (saturation unknown).
Taking 1 mL working solution as an example, add 100 μL DMSO stock solution (25.0 mg/mL) to 400 μL PEG300, and mix evenly; then add 50 μL Tween-80 and mix evenly; then add 450 μL Saline to adjust the volume to 1 mL.
Preparation of Saline: Dissolve 0.9 g sodium chloride in ddH₂O and dilute to 100 mL to obtain a clear Saline solution.
Add each solvent one by one: 10% DMSO 90% (20% SBE-β-CD in Saline)
Solubility: ≥ 2.5 mg/mL (4.28 mM); Clear solution
This protocol yields a clear solution of ≥ 2.5 mg/mL (saturation unknown).
Taking 1 mL working solution as an example, add 100 μL DMSO stock solution (25.0 mg/mL) to 900 μL 20% SBE-β-CD in Saline, and mix evenly.
Preparation of 20% SBE-β-CD in Saline (4°C, storage for one week): 2 g SBE-β-CD powder is dissolved in 10 mL Saline, completely dissolve until clear.
In Vivo Dissolution Calculator
Please enter the basic information of animal experiments:
-
-
-
-
Recommended: Prepare an additional quantity of animals to account for potential losses during experiments.
Please enter your animal formula composition:
-
%DMSO +
Recommended: Keep the proportion of DMSO in working solution below 2% if your animal is weak.
-
%+
-
+%Tween-80 + +
-
%Saline +
The co-solvents required include: DMSO, . All of co-solvents are available by MedChemExpress (MCE). , Tween 80. All of co-solvents are available by MedChemExpress (MCE).
Working solution concentration: 0.22 mg/mL
Method for preparing stock solution: mg drug dissolved in μL DMSO. Stock solution concentration: mg/mL. * In solvent : -80°C, 6 months; -20°C, 1 month (protect from light)
1. Take μL DMSO stock solution;
2. Add μL .
μL , mix evenly;
3. Then add μL Tween 80, mix evenly;
4. Then add μL
Please ensure that the stock solution in the first step is dissolved to a clear state, and add co-solvents in sequence. You can use ultrasonic heating (ultrasonic cleaner, recommended frequency 20-40 kHz), vortexing, etc. to assist dissolution.

Protocols
-
RNA extraction experimental
By lysing cells, releasing RNA, and removing impurities such as proteins and DNA, high-purity RNA products are finally obtained. The commonly used traditional method is the guanidine isothiocyanate/phenol/chloroform method (Trizol), which is suitable for a variety of animal materials including animal tissues, microorganisms, cultured cells, etc., and most plant materials.
-
Naïve CD4+ T-cell subset differentiation/polarization
Naïve CD4+ T-cell subset differentiation/polarization is an in vitro assay in which purified naïve CD4+ T cells are activated through TCR and CD28 costimulation and cultured with defined cytokines and neutralizing antibodies to generate Th0, Th1, Th2, Th17, or induced Treg-like populations. Differentiation is detected by subset-associated cytokines and transcription factors: IFN-γ/T-bet for Th1, IL-4/GATA3 for Th2, IL-17A/RORγt for Th17, and Foxp3 for induced Treg cells. The assay readout is usually generated by intracellular cytokine staining after restimulation, transcription-factor staining by flow cytometry, ELISA of secreted cytokines, or gene-expression analysis. The result reflects cytokine-directed lineage commitment or polarization rather than antigen-specific immune protection by itself.
-
DSS-Induced Colitis
Dextran sulfate sodium (DSS)-induced colitis is generated by administering DSS in mouse drinking water, producing epithelial injury, barrier disruption, weight loss, diarrhea, fecal blood, colon shortening, histologic mucosal damage, and inflammatory mediator changes; the model is mainly used to study acute or chronic intestinal inflammation resembling selected features of ulcerative colitis. DSS injury is interpreted through clinical and tissue readouts rather than a single molecular endpoint: daily body weight, stool consistency, and bleeding are combined into a disease activity index, while colon length, histology, cytokines, myeloperoxidase activity, intestinal permeability, and tight-junction markers provide complementary measures of inflammation and barrier damage.
-
TNBS-Induced Colitis
TNBS-induced colitis is produced by intrarectal delivery of 2,4,6-trinitrobenzene sulfonic acid in ethanol, where ethanol disrupts the mucosal barrier and TNBS haptenates colonic proteins, generating immune-mediated colonic inflammation with weight loss, diarrhea, ulceration, transmural injury, inflammatory-cell infiltration, and cytokine responses. The model is used as an experimental intestinal inflammation model with Crohn’s disease–like features, especially when Th1-type responses, IL-12–dependent inflammation, chronic relapsing inflammation, or fibrosis-related endpoints are studied.
-
Autophagy
Autophagy is a process in which eukaryotic cells use lysosomes to degrade their own cytoplasmic proteins and damaged organelles under the regulation of autophagy related gene (Atg). Microtubule-associated proteins light chain 3 (LC3) is recognized as autophagy marker, which transfers from cytoplasmic LC3 (LC3-I) to membrane type (LC3-II). LC3-II/I ratio could be detected by Western Blot and fluorescence microscopy.
-
Lysosome and acidic-vesicle live-cell staining
Lysosome and acidic-vesicle live-cell staining detects acidic intracellular compartments by using membrane-permeant acidotropic probes that accumulate in low-pH vesicles, including lysosomes, late endosomes, autolysosomes, and acidic phagosomes. LysoTracker staining is commonly used as an intensity-based readout of acidic lysosomal compartment abundance or enlargement, while acridine orange produces green fluorescence in less concentrated compartments and red fluorescence after concentration-dependent accumulation in acidic vesicular organelles. Loss or reduction of acridine-orange red signal can be used as a readout of lysosomal membrane permeabilization or reduced acidic-vesicle integrity. This protocol is designed for live cultured cells and can be adapted for fluorescence microscopy, high-content imaging, plate-reader readout, or flow cytometry when the selected literature supports the readout. Because these dyes report acidotropic accumulation rather than lysosome identity alone,
-
Research Protocol for Inflammation-related Diseases
The NLRP3 inflammasome is a cytosolic innate immune signaling platform that integrates priming signals and danger-signal activation to promote caspase-1 activation, maturation of IL-1β and IL-18, and gasdermin D-mediated pyroptotic cell death. The core experimental logic is to determine whether inflammatory disease phenotypes are driven by increased NLRP3 expression, ASC-containing inflammasome assembly, caspase-1 cleavage, GSDMD cleavage, and extracellular release of IL-1β/IL-18 rather than by nonspecific cell injury alone. The pathway is strongly linked to inflammation-related disease phenotypes because monosodium urate crystals activate NALP3/NLRP3 inflammasome signaling in gout-like crystal inflammation, cholesterol crystals activate NLRP3 inflammasomes in atherogenesis models, and DSS-induced intestinal inflammation has been reported to involve NLRP3 inflammasome activity. However, experimental colitis studies also show context-dependent protective effects of NLRP3 inflammasome co
-
Research Protocol for Metabolic Diseases
AMP-activated protein kinase, AMPK, is a conserved cellular energy sensor that responds to reduced cellular energy status and coordinates metabolism by increasing ATP-generating catabolic pathways while suppressing ATP-consuming anabolic processes. In metabolic disease research, the AMPK pathway is experimentally relevant because it regulates hepatic lipid synthesis, fatty acid oxidation, glucose production, skeletal-muscle glucose disposal, mTORC1-linked biosynthesis, autophagy, mitochondrial homeostasis, and whole-body energy balance. The central pathway logic is that energy stress, metformin, exercise-like stimulation, or direct AMPK activators increase AMPKα Thr172 phosphorylation and downstream substrate phosphorylation, including ACC and RAPTOR. Phosphorylation of ACC suppresses lipogenesis and supports fatty acid oxidation, whereas phosphorylation of RAPTOR suppresses mTORC1 signaling and links cellular energy status to growth and protein synthesis control. The pathway is linked
-
iPSC cell differentiation
Induced pluripotent stem cells (iPSCs) are a type of cell that has similar properties to embryonic stem cells through somatic cell reprogramming.
-
Macroautophagy Solutions
Macroautophagy is a conserved lysosome-dependent degradation pathway in which cytoplasmic material is sequestered into double-membrane autophagosomes and delivered to lysosomes for degradation and recycling. The pathway supports cellular homeostasis during nutrient limitation, organelle stress, protein-aggregate accumulation, infection, differentiation, and tissue remodeling by coupling cargo sequestration, autophagosome maturation, lysosomal fusion, and degradation of cargo-derived macromolecules. The core molecular sequence includes initiation by nutrient- and stress-regulated autophagy machinery, autophagosome nucleation, LC3/ATG8-family conjugation to autophagosomal membranes, cargo selection through receptors such as SQSTM1/p62, autophagosome-lysosome fusion, and lysosomal degradation. LC3 was identified as a mammalian homolog of yeast Atg8 that localizes to autophagosomal membranes after processing, and p62/SQSTM1 was shown to connect ubiquitinated cargo with autophagic degradati
-
Osteoclast differentiation from monocyte/macrophage precursors
Osteoclast differentiation is an in vitro induction assay in which monocyte/macrophage-lineage precursors are exposed to macrophage colony-stimulating factor (M-CSF) and receptor activator of NF-κB ligand (RANKL), generating multinucleated osteoclasts that are commonly identified by tartrate-resistant acid phosphatase (TRAP) staining and functionally confirmed by resorption pits on dentin, bone, or mineralized substrates. M-CSF supports survival and expansion of osteoclast precursors, while RANKL binding to RANK drives osteoclast commitment, fusion, maturation, and resorptive function; osteoprotegerin inhibits this pathway by binding RANKL and preventing RANK activation. The main readouts are the number of TRAP-positive multinucleated cells, formation of F-actin rings, and resorbed surface area; TRAP-positive multinucleated cells indicate osteoclast differentiation, whereas pit formation on dentin, bone, or mineralized coating indicates functional bone-resorbing activity.


Purity & Documentation
-
Data Sheet (288 KB)
-
SDS (420 KB)
- English - EN (420 KB)
- Français - FR (420 KB)
- Deutsch - DE (420 KB)
- Norwegian - NO (420 KB)
- Español - ES (420 KB)
- Swedish - SV (420 KB)
- Italian - IT (420 KB)
- Korean - KR (420 KB)
- Portuguese - PT (420 KB)
-
Handling Instructions (2659 KB)
References
[1]. Zhou C, et al. Beneficial effects of neomangiferin on high fat diet-induced nonalcoholic fatty liver disease in rats. Int Immunopharmacol. 2015;25(1):218-228. [Content Brief]
[2]. Lim SM, et al. Neomangiferin modulates the Th17/Treg balance and ameliorates colitis in mice. Phytomedicine. 2016;23(2):131-140. [Content Brief]
[3]. Wang HT, et al. A study on the prevention and treatment of murine calvarial inflammatory osteolysis induced by ultra-high-molecular-weight polyethylene particles with neomangiferin. Exp Ther Med. 2018;16(5):3889-3896. [Content Brief]


Complete Stock Solution Preparation Table
Please refer to the solubility information to select the appropriate solvent. Once prepared, please aliquot and store the solution to prevent product inactivation from repeated freeze-thaw cycles.
Storage method and period of stock solution: -80°C, 6 months; -20°C, 1 month (protect from light). When stored at -80°C, please use it within 6 months. When stored at -20°C, please use it within 1 month.
| Optional Solvent | Concentration Solvent Mass | 1 mg | 5 mg | 10 mg | 25 mg |
|---|---|---|---|---|---|
| DMSO | 1 mM | 1.7109 mL | 8.5546 mL | 17.1092 mL | 42.7731 mL |
| 5 mM | 0.3422 mL | 1.7109 mL | 3.4218 mL | 8.5546 mL | |
| 10 mM | 0.1711 mL | 0.8555 mL | 1.7109 mL | 4.2773 mL | |
| 15 mM | 0.1141 mL | 0.5703 mL | 1.1406 mL | 2.8515 mL | |
| 20 mM | 0.0855 mL | 0.4277 mL | 0.8555 mL | 2.1387 mL | |
| 25 mM | 0.0684 mL | 0.3422 mL | 0.6844 mL | 1.7109 mL | |
| 30 mM | 0.0570 mL | 0.2852 mL | 0.5703 mL | 1.4258 mL | |
| 40 mM | 0.0428 mL | 0.2139 mL | 0.4277 mL | 1.0693 mL | |
| 50 mM | 0.0342 mL | 0.1711 mL | 0.3422 mL | 0.8555 mL | |
| 60 mM | 0.0285 mL | 0.1426 mL | 0.2852 mL | 0.7129 mL | |
| 80 mM | 0.0214 mL | 0.1069 mL | 0.2139 mL | 0.5347 mL | |
| 100 mM | 0.0171 mL | 0.0855 mL | 0.1711 mL | 0.4277 mL |


Neomangiferin Related Classifications
HY-N0723 Related Classifications
 Powered by Bioz